
Sample Category Title
September FOMC: A “Risk Management” Cut
Summary
- As expected, the FOMC reduced the fed funds target range by 25 bps to 4.00%-4.25% at the conclusion of its meeting today, the first adjustment in nine months. Newly confirmed Governor Stephan Miran was the lone dissenter at the meeting, preferring to cut by 50 bps instead of 25 bps.
- The decision to ease reflected a "shift in the balance of risks" with the Committee believing that the "downside risks to employment have risen." While inflation has ticked up since the spring, a development acknowledged in the post-meeting statement, job growth has downshifted sharply and the unemployment rate has risen to the top end of the Committee's central tendency range consistent with full employment.
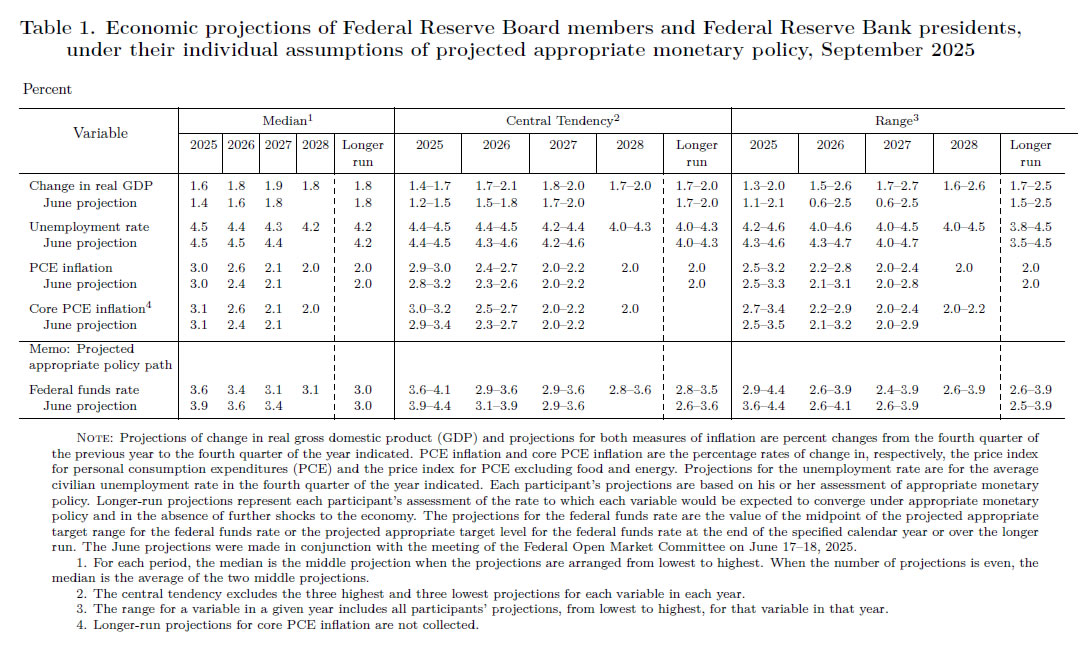
- Amid increased concerns about the jobs market, the median projection for the fed funds rate at the end of the year edged down by 25 bps to 3.625% relative to the previous projection from June, indicating an additional 50 bps of easing over the course of the FOMC's October and December meetings. The median projection for 2026 dipped to 3.375%, implying just 25 bps of cuts next year remains the base case after a bit more easing this year. The median estimate for the longer-run, "neutral" fed funds rate was unchanged at 3.0%.
- Yet, Chair Powell in the post-meeting press conference struck a mildly hawkish tone in our view and continued to signal that the Committee remains in no rush to return to neutral. Rather, with policy still somewhat restrictive, Chair Powell characterized today's adjustment as a "risk management cut" and the near-term monetary policy outlook as a "meeting-by-meeting situation."
- Overall, the outcome of today's meeting strikes us as a balanced response to the labor market's loss of momentum and still elevated pace of inflation. With the Fed's dual mandate in tension, what will the central bank do? We think the FOMC will put more weight on employment and cut the federal funds rate by 25 bps at each of its next two meetings, pushing the target range down to 3.50%-3.75% by year-end. We project two more 25 bps rate cuts at the March and June meetings next year followed by a long hold, resulting in a terminal fed funds rate of 3.00%-3.25%.
Chair Powell Corrals Most of the Cats
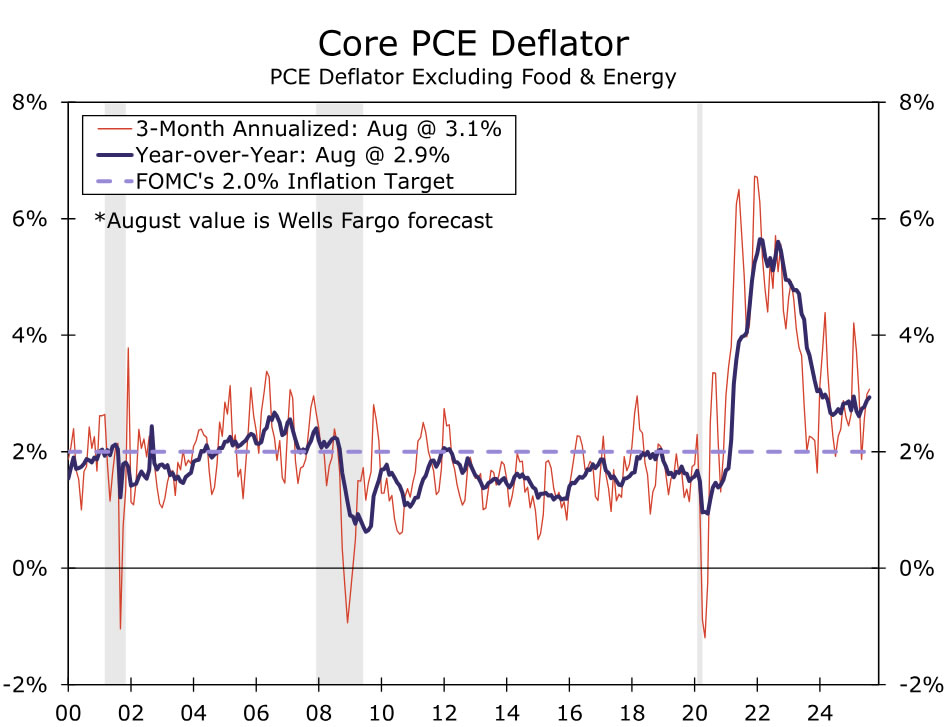
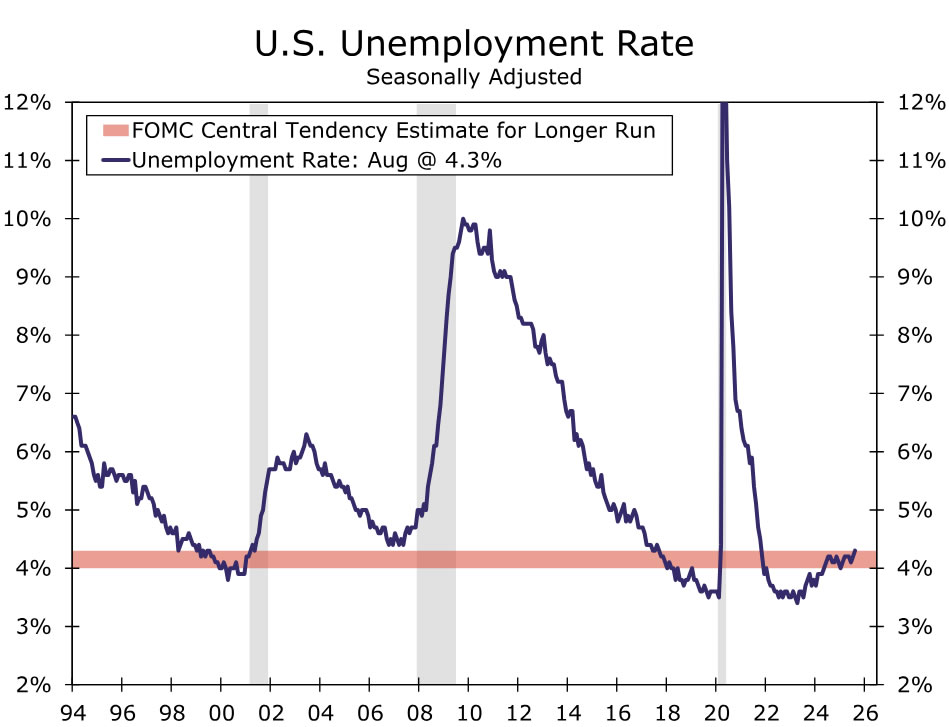
The September FOMC meeting did not disappoint. As was widely expected, the FOMC lowered the fed funds rate by 25 bps to 4.00%-4.25%. The move marked the first adjustment to the Committee's policy rate since December and reflected a shifting balance of risk between the FOMC's mandates of full employment and inflation. With the core PCE deflator running about a percentage point above target (Figure 1), the post-meeting statement maintained that inflation "remains somewhat elevated" and acknowledged that it has "moved up." However, the recent deterioration in the jobs market overshadowed concerns about stubborn inflation. The Committee no longer views labor market conditions as "solid" and noted the recent slowdown in job growth and uptick in unemployment in its discussion of recent economic conditions (Figure 2). More tellingly, the statement added that "downside risks to employment have risen," and that "in light of the shift in the balance of risks," the FOMC decided to cut its policy rate. The post-meeting statement reaffirmed the ongoing pace of balance sheet runoff.
The decision was not unanimous but showed policymakers are generally more aligned than what many expected ahead of the meeting. Governor Stephan Miran, who was sworn in Tuesday morning ahead of the start of the meeting, was the lone dissenter and preferred a 50 bps rate cut. Governors Waller and Bowman, who both dissented in July, voted in line with the bulk of the Committee, while no partcipants dissented in a more hawkish direction.
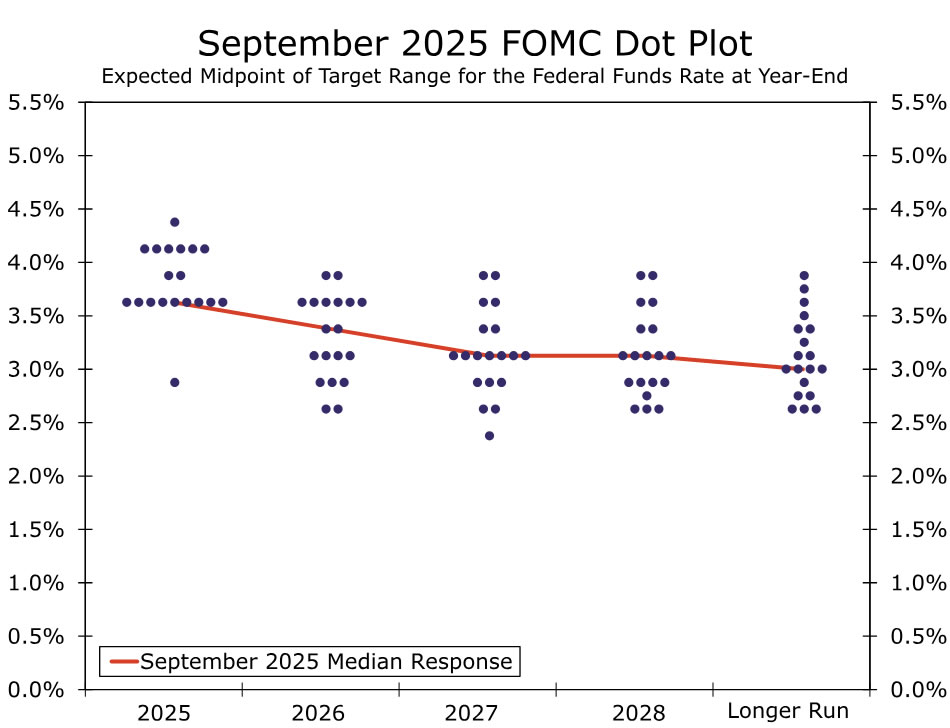
The Committee's ongoing bias to ease was more apparent in the Summary of Economic Projections. The median projection for the fed funds rate at year end slipped to 3.625% from 3.875% in the June SEP, implying most officials see an additional 50 bps of easing over the Committee's two remaining meetings of the year (Figure 3). The median dot for 2026 signaled just one cut next year, but this masks a decent amount of dispersion across the participants. Just two of the 19 participants were at the median (3.375%), and the median was just one dot away from slipping another 25 bps to 3.125%. Notably, the median estimate for the longer-run, "neutral" fed funds rate was unchanged at 3.0%. This underscores how most Committee members still view the policy setting as at least somewhat restrictive, giving some scope to lower the fed funds rate in an effort to cushion jobs market without outright accommodative monetary policy stoking higher inflation.
The Committee's economic outlook brightened a bit relative to June, with 0.2 ppt increases in the median projections for real GDP growth in 2025 and 2026 and a 0.1 ppt increase to growth in 2027. The median forecast for the unemployment rate at year-end 2025 was unchanged at 4.5%, but it dropped by 0.1 ppt for 2026 and 2027. That said, the median headline and core inflation projections for 2026 rose by 0.2 ppt to 2.6% amid tariffs that are still slowly seeping into selling prices, expectations for stronger economic growth, anticipated fiscal policy stimulus and more accommodative monetary policy. The median participant's projection does not have inflation returning to the FOMC's 2.0% target until 2028.
In the press conference, Chair Powell struck a mildly more hawkish tone in our view, saying that he was not quite ready to say that a neutral policy stance was warranted and characterizing today's rate cut as a "risk management" move. He also characterized the near-term monetary policy outlook as a "meeting-by-meeting situation" in a sign that although another two 25 bps rate cuts this year might be the base case, they are not a slam dunk pending new economic data in the coming months.
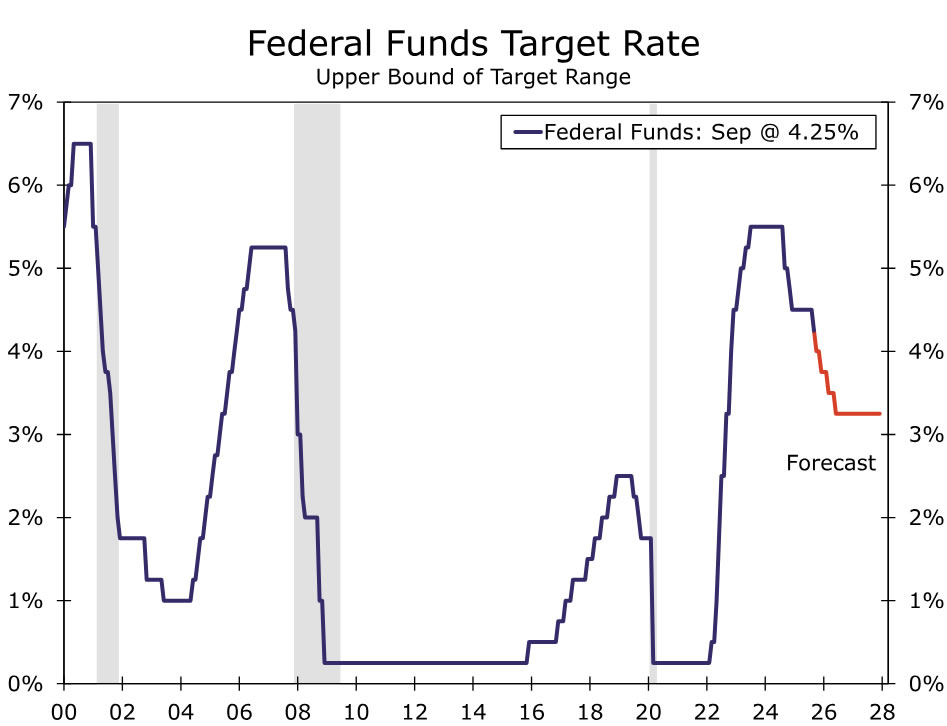
With the Fed's dual mandate in tension, what will the central bank do? We think the FOMC will put more weight on employment and cut the federal funds rate by 25 bps at each of its next two meetings, pushing the target range down to 3.50%-3.75% by year-end. We project two more 25 bps rate cuts at the March and June meetings next year followed by a long hold, resulting in a terminal fed funds rate of 3.00%-3.25% (Figure 4).
Fed Review: Slim Margins
- The Fed cut rates by 25bp in its September meeting, as widely anticipated.
- 9/19 participants saw only one more rate cut in the last two meetings of the year, or none. 9 participants expect two cuts, and one outlier (likely Miran) called for 125bp of additional easing. Hence, the slightest possible majority favours two cuts.
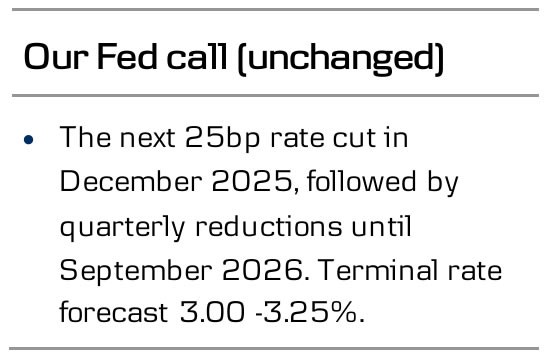
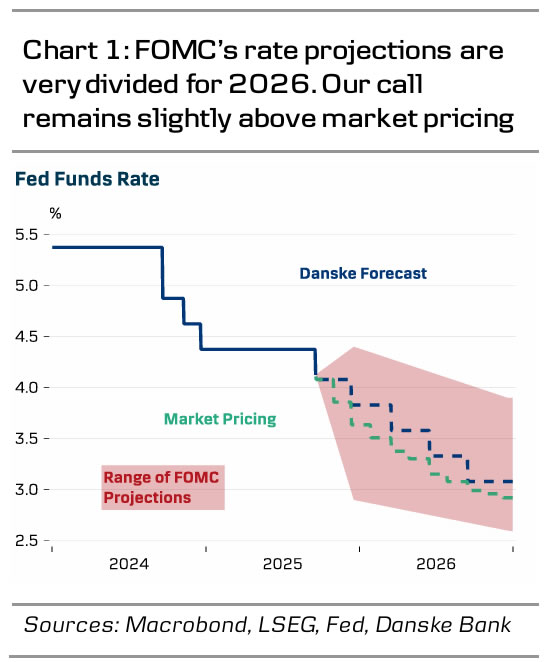
- We maintain our previous call and still expect only one more rate cut this year (in December), followed by three cuts in 2026, once per quarter.
- Markets price in 22bp of cuts by October, and 44bp by December. Key arguments for our more hawkish stance include the clear easing of financial conditions, elevated inflation expectations and relatively stable labour market balance.
The FOMC's decision to cut rates by 25bp was backed by a stronger consensus than some perhaps feared. Aside from Stephen Miran (who dissented for a 50bp cut), all voters supported the 25bp move.
The updated summary of economic projections revealed greater dispersion of views, however. One participant (likely a non-voter) saw that the Fed should not have cut rates at all today, or in the remaining meetings of the year. A total of 9 out of 19 participants called for a maximum of one additional cut (or no more cuts), whilst 9 out of 19 called for cuts in both of the remaining meetings of the year. One outlier, most likely Miran, called for 125bp of additional easing. That means that the slimmest possible majority favours cutting rates by (at least) two more times this year.
This also means that relatively small surprises in data could have a significant impact on the near-term rates outlook. The balance of power between the 'hawks' and the 'doves' could shift rapidly. Median forecasts for both growth and inflation were revised up for 2026. Powell emphasized that the rate cut was motivated by a shift in the balance of risks towards weaker labour markets, rather than deterioration of the baseline outlook.
We are still aligned with the hawkish camp in a sense that we think a gradual approach would be the best suited for the current environment. We do not think the outlook warrants rapid additional rate cuts, as financial conditions have already eased significantly this year. Improving credit growth and firms' order-inventory balances do not suggest the economy is headed towards an imminent slowdown.
The pass-through of tariff-related cost increases is still in its early days, and concluding anything on the persistence of price pressures is difficult when consumers' inflation expectations remain clearly elevated. And even the dreaded labour market still looks relatively balanced when accounting for the significant slowdown in supply growth. To quote Powell, 'It's not a bad economy'.
Admittedly, our call for an unchanged decision in the next meeting hinges on early October labour market data coming out solid, but we still prefer to position for higher short end USD rates. EUR/USD ended the evening close to pre-meeting levels, and we maintain our 12M forecast unchanged at 1.23.
EURJPY Wave Analysis
EURJPY: ⬇️ Sell
- EURJPY reversed from resistance zone
- Likely to fall to support level 169.9
EURJPY currency pair recently reversed down from the resistance zone between the resistance levels 173.65 (which stopped the price earlier this year) and 175.00 (yearly high from 2024.
This resistance zone was further strengthened by the upper daily and the weekly Bollinger Bands
Given the strength of the aforementioned the resistance zone and the overbought weekly Stochastic, EURJPY currency pair can be expected to fall to the next support level 169.90.

Fed cuts 25bps, projections signal two more moves this year
The Fed cut interest rates by 25bps to 4.00–4.25%, in line with market expectations. The decision was not unanimous, with newly confirmed temporary Governor Stephen Miran dissenting in favor of a larger 50bps cut. However, notable doves Christopher Waller and Michelle Bowman aligned with the majority, helping to anchor the outcome around the base case.
In its statement, the Fed reiterated that any further adjustments will be guided by incoming data, the evolving outlook, and the balance of risks. The careful wording underscored policymakers’ preference for a step-by-step approach, avoiding a signal of urgency while still keeping the easing cycle in play.
The updated projections confirmed a measured path of rate cuts. The median federal funds rate is expected to fall to 3.6% by year-end, implying two more 25bps reductions in October and December. For 2026, the Fed sees rates at 3.4%, suggesting just one cut that year, followed by another in 2027 to land just above the estimated 3.0% longer-run neutral rate.
On the labor market, the Fed’s outlook improved slightly. Unemployment is now expected at 4.5% in 2025, 4.4% in 2026, and 4.3% in 2027, a modestly better path than projected in June. This adjustment reflects confidence that the labor market can soften without unraveling, helping to balance the inflation fight with growth stability.
Inflation forecasts also shifted. Core PCE is now projected at 3.1% in 2025, dipping more sharply to 2.6% in 2026 before easing further to 2.1% in 2027. The 2026 forecast was revised higher from 2.4%, likely reflecting temporary tariff-related pressures, but the trajectory still points toward inflation returning close to target over the medium term.
Full FOMC statement and economic projections.
(FED) Federal Reserve Issues FOMC Statement
Recent indicators suggest that growth of economic activity moderated in the first half of the year. Job gains have slowed, and the unemployment rate has edged up but remains low. Inflation has moved up and remains somewhat elevated.
The Committee seeks to achieve maximum employment and inflation at the rate of 2 percent over the longer run. Uncertainty about the economic outlook remains elevated. The Committee is attentive to the risks to both sides of its dual mandate and judges that downside risks to employment have risen.
In support of its goals and in light of the shift in the balance of risks, the Committee decided to lower the target range for the federal funds rate by 1/4 percentage point to 4 to 4‑1/4 percent. In considering additional adjustments to the target range for the federal funds rate, the Committee will carefully assess incoming data, the evolving outlook, and the balance of risks. The Committee will continue reducing its holdings of Treasury securities and agency debt and agency mortgage‑backed securities. The Committee is strongly committed to supporting maximum employment and returning inflation to its 2 percent objective.
In assessing the appropriate stance of monetary policy, the Committee will continue to monitor the implications of incoming information for the economic outlook. The Committee would be prepared to adjust the stance of monetary policy as appropriate if risks emerge that could impede the attainment of the Committee's goals. The Committee's assessments will take into account a wide range of information, including readings on labor market conditions, inflation pressures and inflation expectations, and financial and international developments.
Voting for the monetary policy action were Jerome H. Powell, Chair; John C. Williams, Vice Chair; Michael S. Barr; Michelle W. Bowman; Susan M. Collins; Lisa D. Cook; Austan D. Goolsbee; Philip N. Jefferson; Alberto G. Musalem; Jeffrey R. Schmid; and Christopher J. Waller. Voting against this action was Stephen I. Miran, who preferred to lower the target range for the federal funds rate by 1/2 percentage point at this meeting.
Bank of Canada Resumes Monetary Easing
Summary
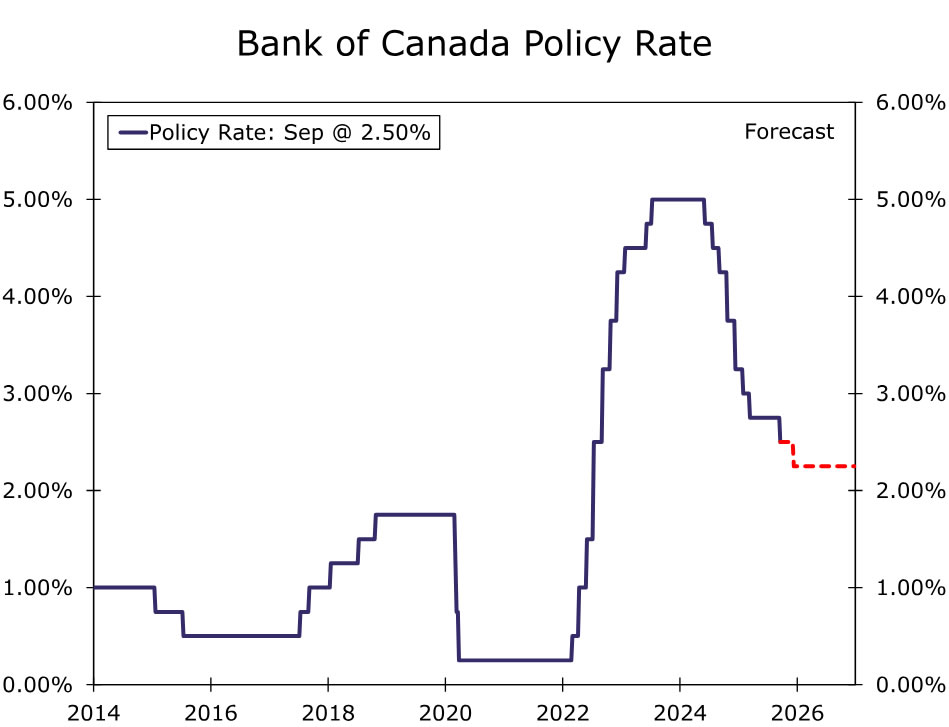
- The Bank of Canada (BoC) resumed its monetary easing at today's announcement, lowering the policy rate by 25 bps to 2.50%. The central bank said a weaker economy, combined with less upside risk to inflation, justified today's rate cut.
- While the central bank's assessment of the economy's prospects and inflation risks has softened, the BoC did not offer an explicit signal of a possible further reduction of interest rates at today's announcement. In that context, for now, we lean against the central bank delivering a back-to-back rate cut in October. Instead, we anticipate the next 25 bps rate cut will come at the BoC December announcement, which would take the BoC's policy rate to a cycle low of 2.25%.
- From a broader perspective, however, we acknowledge that the balance of risks around our Bank of Canada outlook is likely tilted toward earlier or more monetary policy easing. Among the key upcoming releases, should September see yet another decline in employment, Q3 business confidence show a further softening, and September inflation show reasonably benign price pressures, that could be enough for the central bank to lower interest rates again in October.
Bank of Canada Resumes Rate Cuts
The Bank of Canada (BoC) resumed its monetary easing at today's announcement, lowering its policy rate by 25 bps to 2.50%. The rate cut was widely expected by market participants, although we had leaned towards the BoC extending its monetary policy pause and holding rates steady. In deciding to lower interest rates, BoC policymakers noted both softening growth and diminishing upside inflation risks. Among the main aspects of today's announcement, the BoC said:
- Canada's Q2 GDP declined as expected in the second quarter, with both exports and business investment weaker. Consumer spending grew at a healthy pace, but weakness in the labor market will likely weigh on household spending in the months ahead.
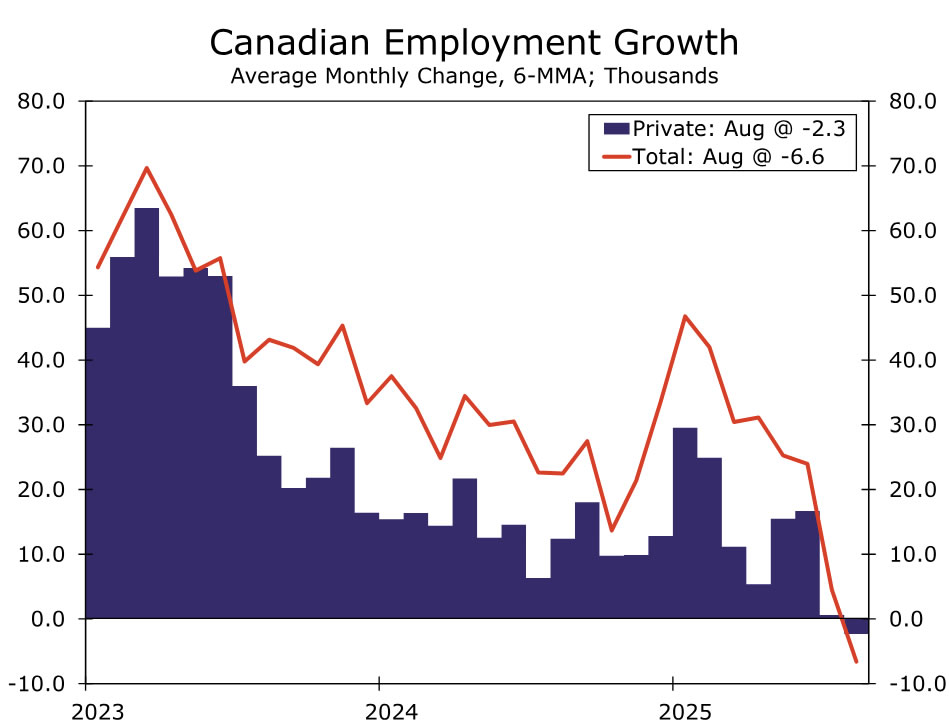
- Employment has fallen in the past two months, with job losses concentrated in trade-sensitive sectors. Unemployment has risen, and wage growth has continued to ease.
- While core inflation has been around 3% in recent months, on a monthly basis the upward momentum seen earlier this year has dissipated. A broader range of indicators suggests underlying inflation is running around 2½%. In addition, the government's decision to remove most retaliatory tariffs on imports from the United States should mean less upward price pressure moving forward.
The central bank said that with "a weaker economy and less upside risk to inflation, Governing Council judged that a reduction in the policy rate was appropriate to better balance the risks." The BoC reiterated that it is "proceeding carefully, with particular attention to the risks and uncertainties" and that it will "be assessing how exports evolve in the face of US tariffs and changing trade relationships; how much this spills over into business investment, employment, and household spending; how the cost effects of trade disruptions and reconfigured supply chains are passed on to consumer prices; and how inflation expectations evolve." Notably, and in contrast to the July announcement, the BoC did not offer an explicit signal of a possible further reduction in interest rates.
Ahead of today's announcement, our view had been the Bank of Canada would ease monetary policy further, with the main question being one of timing. With the Bank of Canada not offering an explicit easing signal, for now we lean against the central bank delivering back-to-back rate cuts with another move at its October announcement, and instead anticipate the next 25 bps rate cut will come at the BoC December announcement, which would take the BoC's policy rate to a cycle low of 2.25%. That said, both ourselves and the Bank of Canada are in "data-dependent" mode, and the key releases we will be watching in the coming weeks are the:
- September labor market report (released 10 October)
- Q3 Business Outlook Survey (released 20 October)
- September CPI (released 21 October)
Should September see yet another decline in employment, Q3 business confidence show a further softening, and September inflation show reasonably benign price pressures, that combination may well be enough for the central bank to lower interest rates again in October. Indeed, we acknowledge that from a broader perspective and in the event of sustained weakness in Canada's economy, the balance of risks around our Bank of Canada outlook is likely tilted toward earlier or more monetary policy easing, with a terminal policy rate of 2.00% or even lower not out of the question.
Access Technical Levels for Major FX Pairs Ahead of FOMC Rate Decision
It isn't typical to see as much FX volatility ahead of such a key FOMC.
Currency Markets had been particularly slow throughout August after some post-NFP correction in the US Dollar – Despite having reasons to sell the USD further, particularly after Powell's dovish speech at Jackson Hole, end-summer slow trading largely contained volatility for fiat majors.
To catch up with the volatility seen in Equities (which kept flying higher throughout that entire period), the US Dollar took a two-day downward train to start this week.
The greenback saw close to 1% moves in Monday and yesterday's consecutive sessions against European currencies particularly – The widest range throughout the whole FX Market between the 12th of August to last Friday had been ~0.50%.
As explained in our previous piece, except for a huge switch of fundamentals and/or a leak to an upcoming decision, it is rare that players accelerate such volatility ahead of the FOMC.
The only reasoning would be strong and sudden hedging that corroborates with Miran entering the FOMC meeting right before its start.
Anyways, let's have a look at technical levels for all FX major pairs as the market gets ready for the FOMC decision (and the Bank of Canada rate decision, releasing very soon – we will update the levels on a new piece).
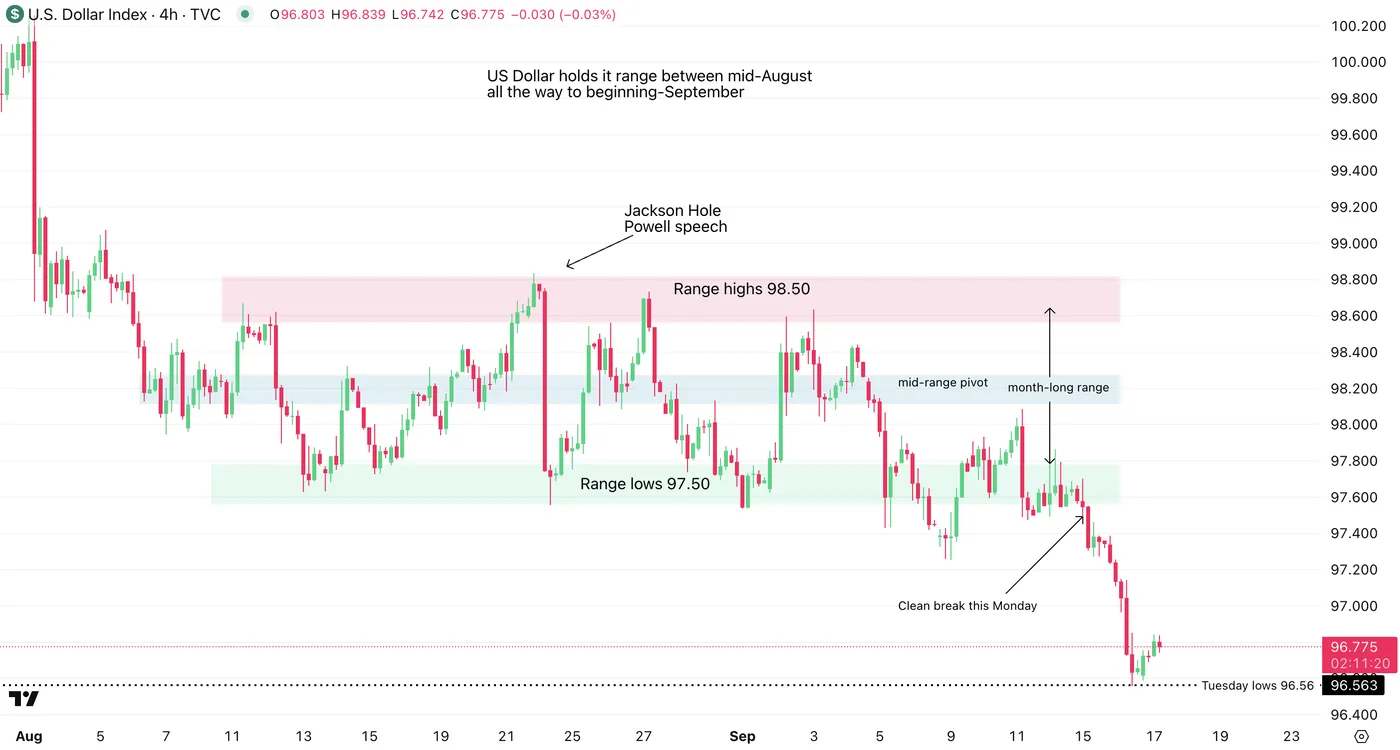
DXY 4H Chart, September 17, 2025 – Source: TradingView
All FX Majors Charts with the key levels in play for the September FOMCNZDUSD 8H Chart and levels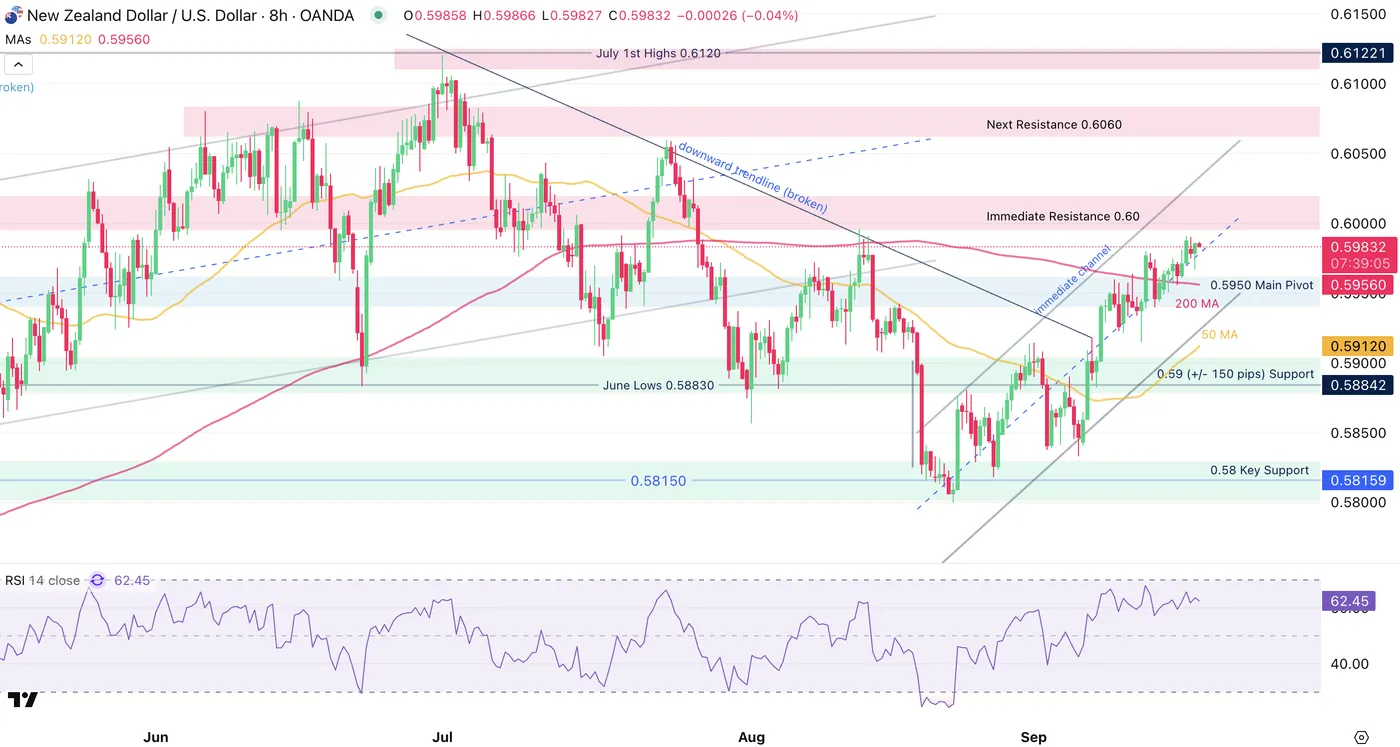 NZDUSD 8H Chart, September 17, 2025, Source: TradingView
Trading Levels for NZDUSD:
Resistance Levels
- Immediate Resistance 0.60
- Next Resistance 0.6060
- July 1st Highs 0.6120
Support Levels
- 0.5950 Main Pivot (acting as immediate support)
- 0.59 (+/- 150 pips) Support
- 0.58 Key Support
USDJPY 8H Chart and levels (testing support)
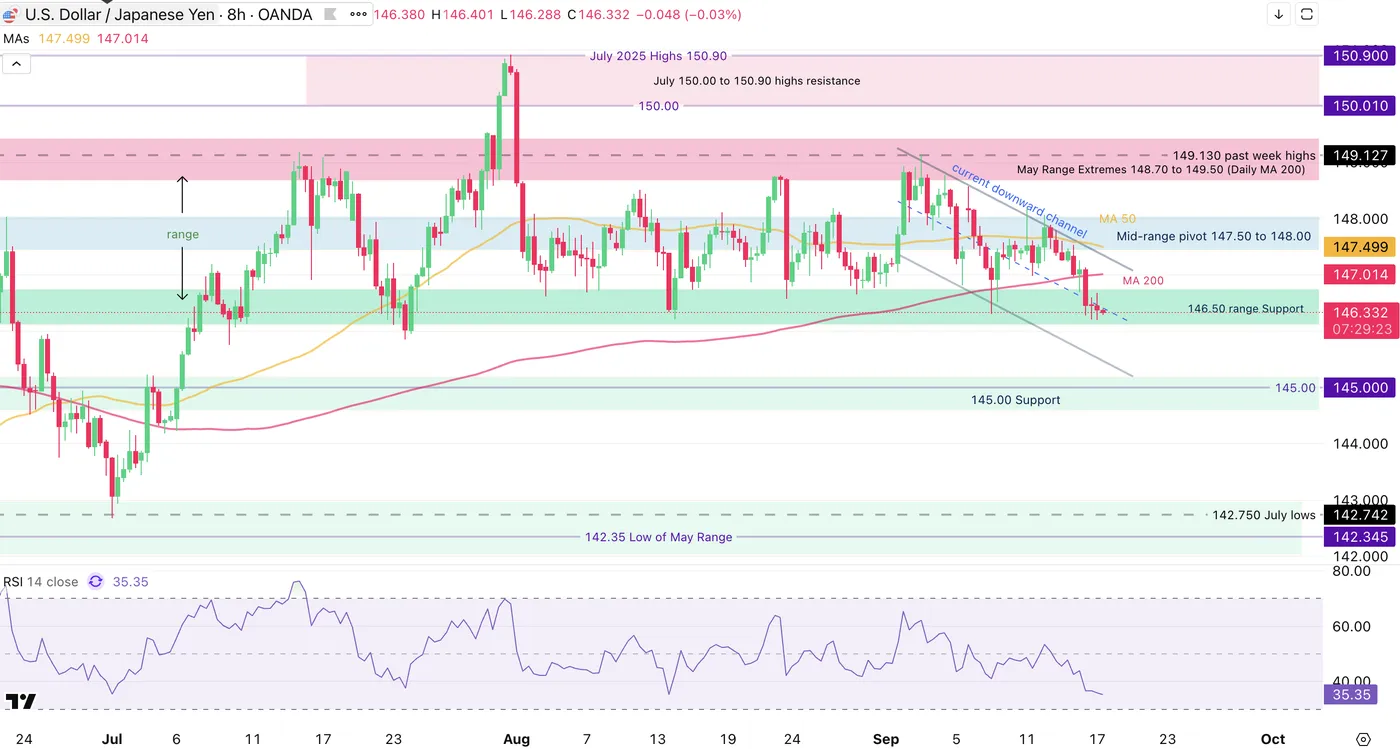
USDJPY 8H Chart, September 17, 2025, Source: TradingView
You can access an in-depth USDJPY analysis right here, released earlier today!
Levels to watch for USDJPY:
Resistance Levels
- Mid-range pivot 147.50 to 148.00
- May Range Extremes 148.70 to 149.50
- 150.00 psychological resistance
- 150.90 July highs
Support Levels
- 146.50 range support (testing)
- 145.00 psychological support
- 142.35 low of the May range, main support
AUDUSD – A sharp rebound from the prior week selloff
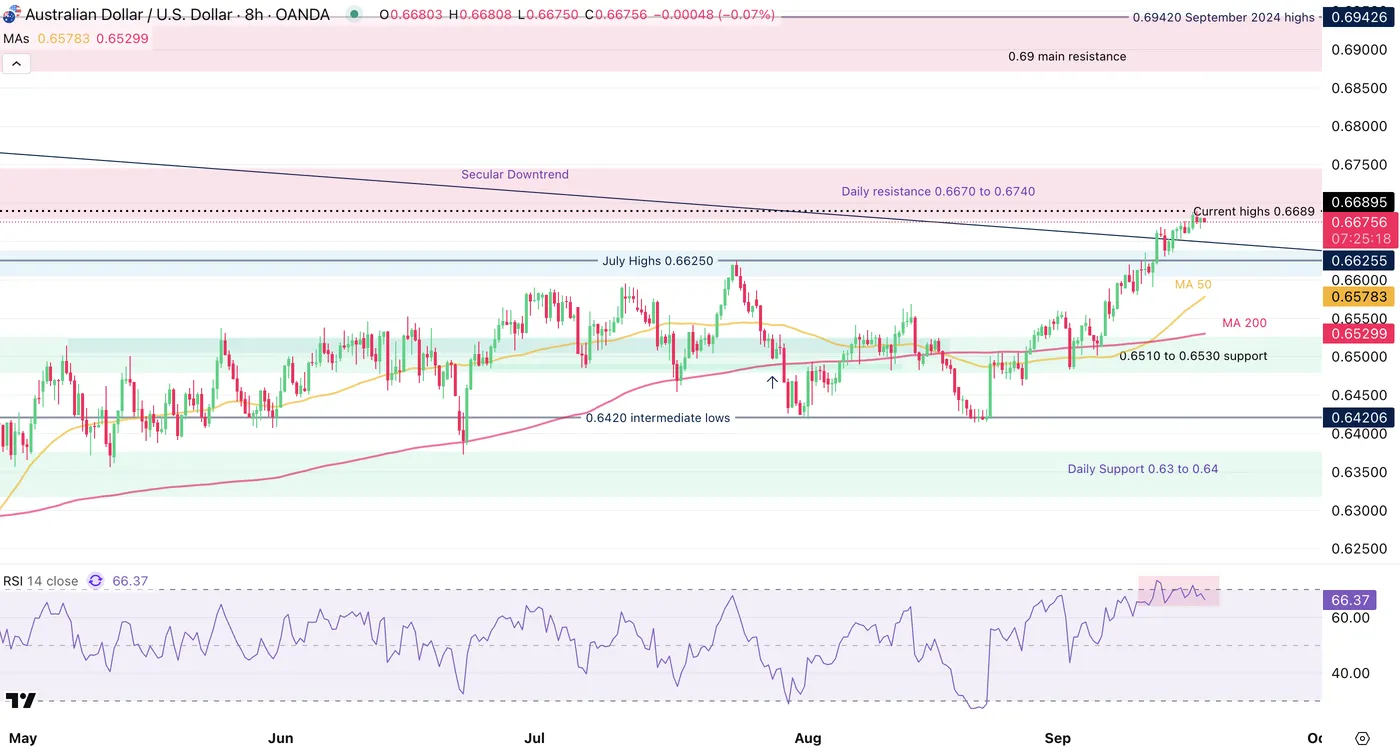
AUDUSD 8H Chart, September 17, 2025, Source: TradingView
AUDUSD Trading Levels:
Resistance Levels
- US CPI highs 0.6690 (2025 highs)
- Daily resistance 0.6670 to 0.6740
- 0.69 zone main resistance (+/- 150 pips)
Support Levels
- July Highs 0.66250 (+/- 100 pips) acting as key pivot and support
- 0.6510 to 0.6530 support (confluence with 50-day MA)
- 0.6420 August 22, 2025 lows (pre-Jackson Hole conference)
- Daily Support 0.63 to 0.64
EURUSD 8H Chart and levels
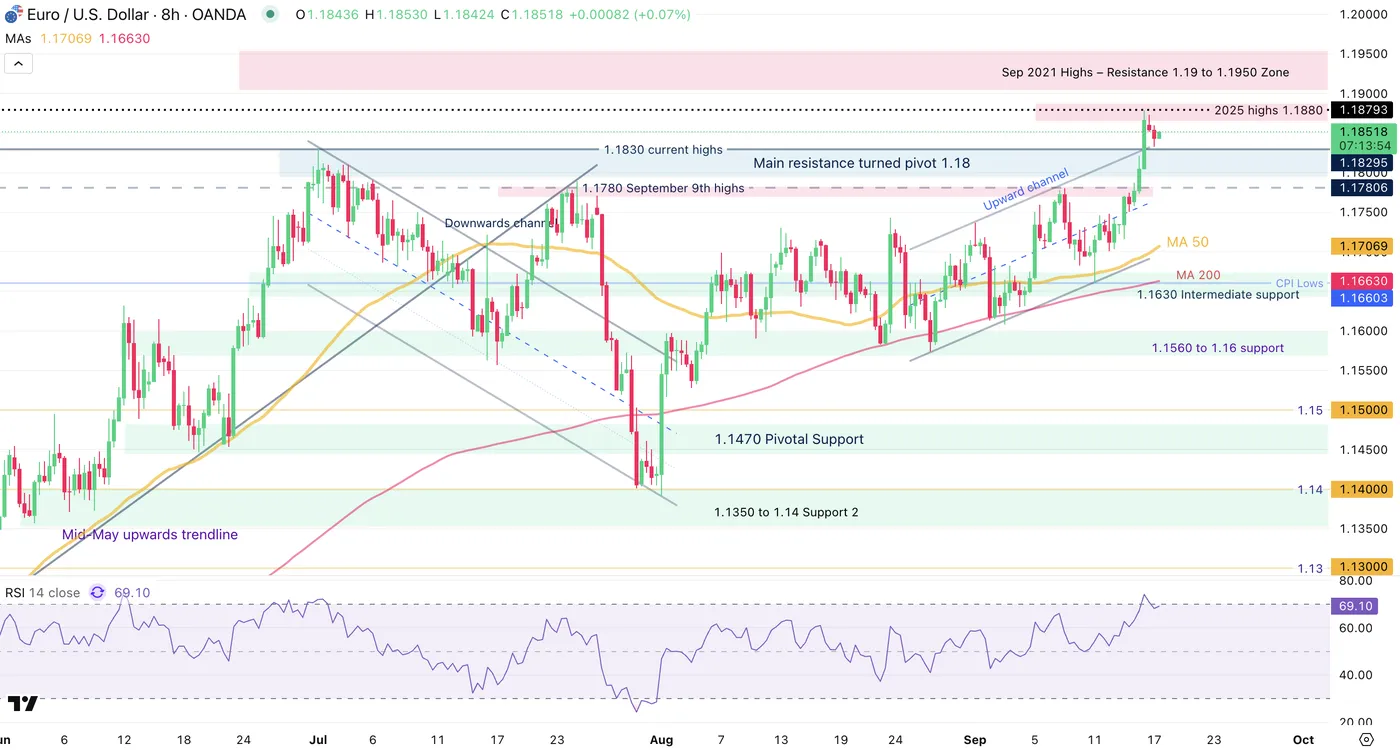
EURUSD 8H Chart, September 17, 2025, Source: TradingView
Levels to watch for EURUSD:
Resistance Levels:
- 2025 highs 1.1880
- Main resistance turned pivot 1.18 to 1.1830 (yearly highs)
- 1.20 psychological level and 2021 highs
Support Levels:
- 1.1750 Intermediate Pivot (+/- 150 pips)
- 1.1650 Key support
- 1.16 Main support
- 1.1470 Pivotal Support (bearish below this)
The Swissie regains some strength – USDCHF
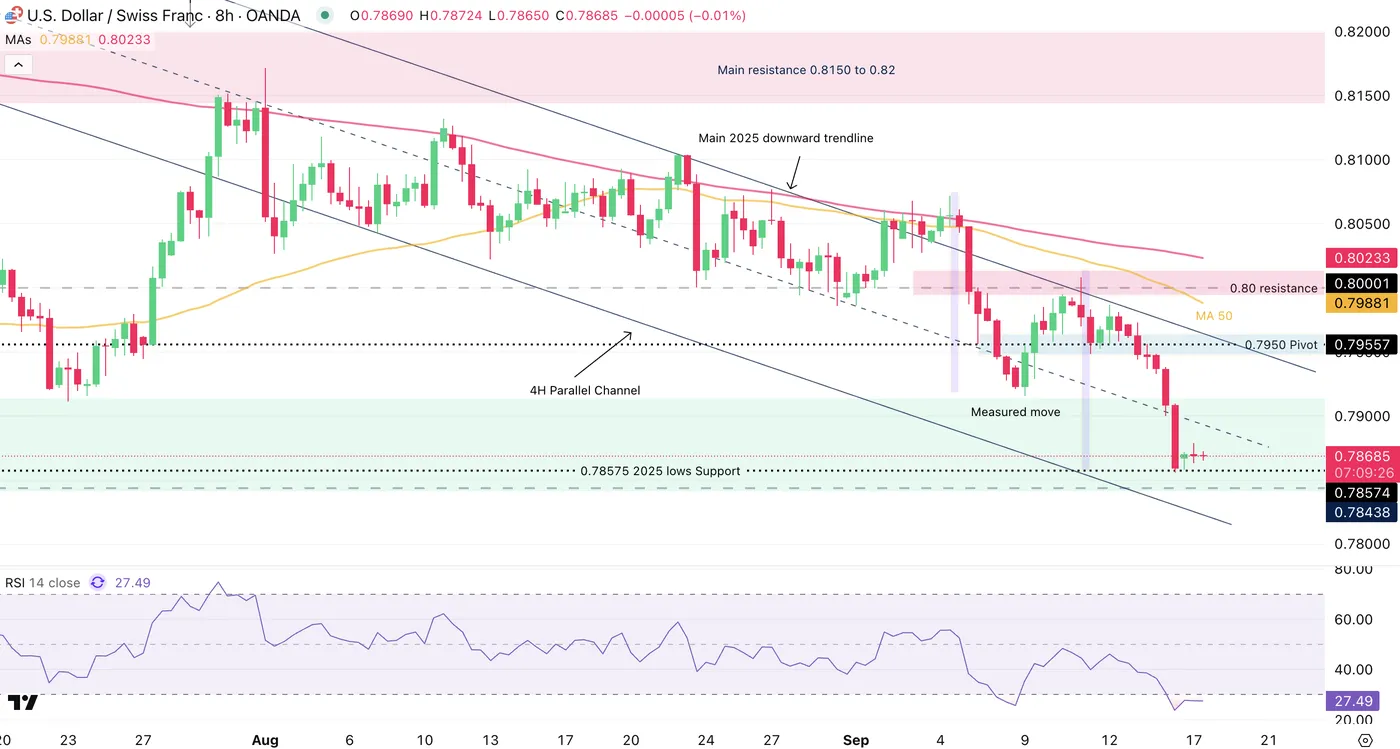
USDCHF 4H Chart, September 17, 2025, Source: TradingView
Here is our latest in-depth analysis of the USDCHF (from yesterday) that was published as things were moving aggressively. Despite new lows being reached, the analysis is still valid!
Levels to watch for USDCHF:
Resistance Levels
- 0.7950 Key pivot
- Long-term pivot 0.80 Zone (0.80 to 0.8010)
- Main resistance 0.8150 to 0.82 (last highs 0.8165)
- May 2025 highs 0.8475 Resistance Zone
Support Levels
- 0.78575 2025 lows Support
- 0.77 to 0.7735 August 2011 lows
- 0.76 Psychological level
The Pound is back on track – GBPUSD
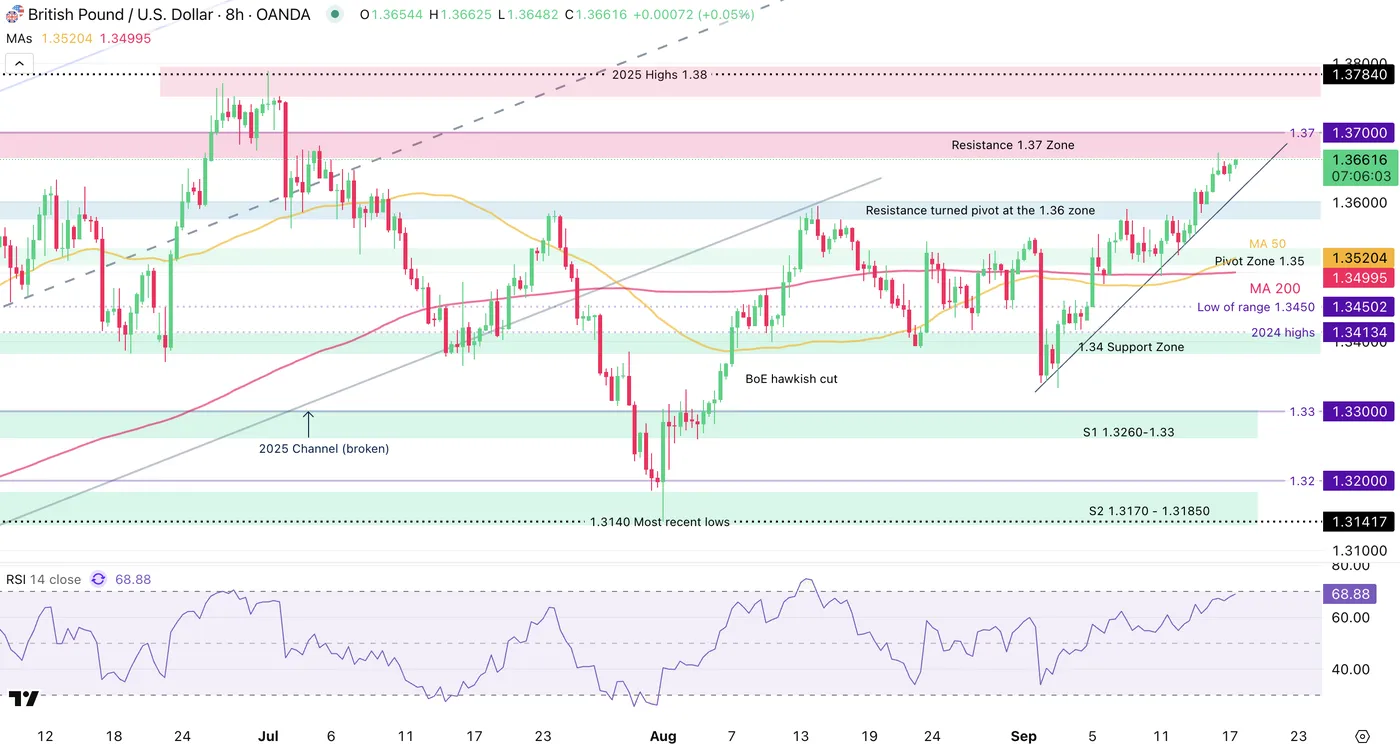
GBPUSD 8H Chart, September 17, 2025, Source: TradingView
Levels to watch for GBPUSD:
Resistance Levels
- 2025 precise high 1.3788
- 2025 Highs resistance 1.3760 to 1.38
- Resistance 1.37 Zone (immediate resistance)
Support Levels
- Resistance turned pivot at the 1.36 zone
- Support Zone 1.35
- 1.34 Support Zone
USDCAD (Subject to change with ongoing Bank of Canada decision, Cut by 25 bps)
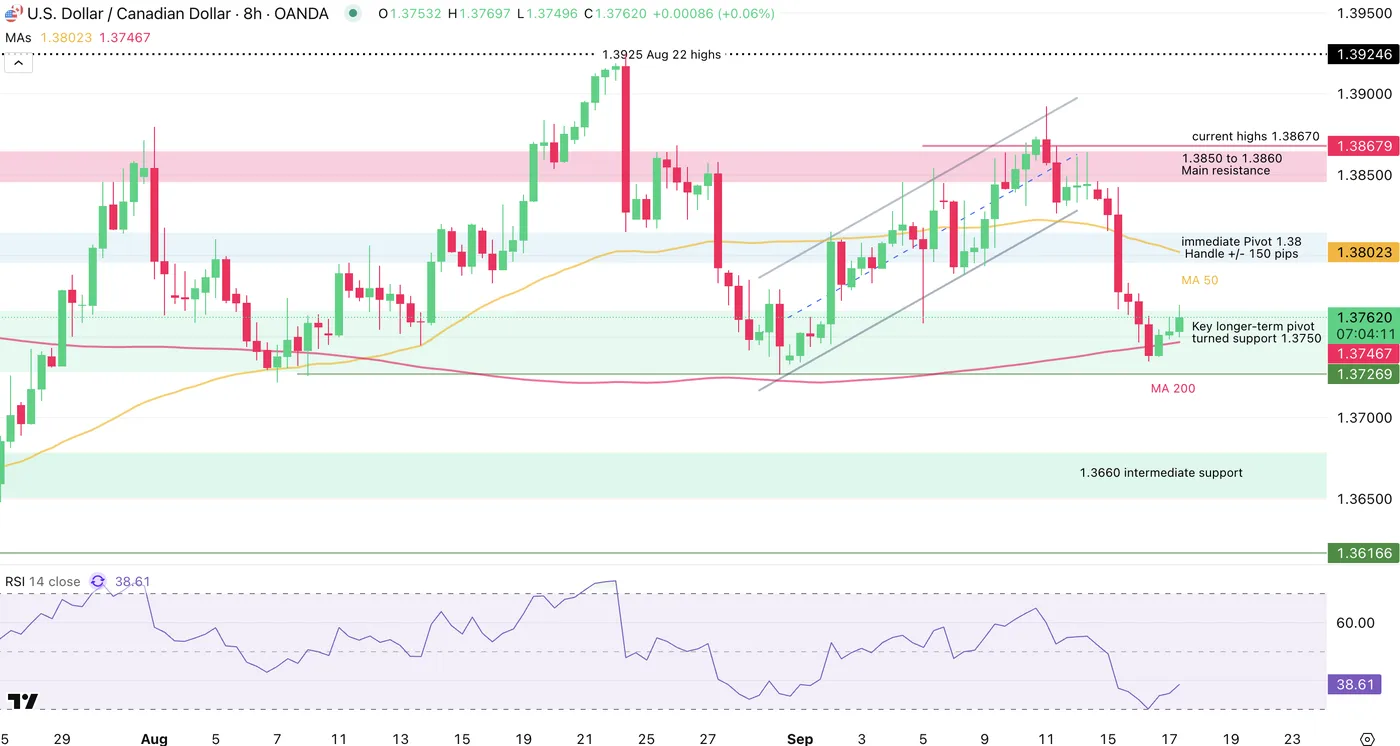
USDCAD 8H Chart, September 17, 2025, Source: TradingView
An update to the chart will be presented in an upcoming piece: Mid-Week NA Markets update with a detailed USDCAD analysis inside. Here is the BoC statement.
Levels to watch for USDCAD:
Resistance Levels
- 1.38 Handle +/- 150 pips
- 1.3850 to 1.3860 Main resistance
- 1.3925 Aug 22 highs
Support Levels
- Key longer-term pivot turned support 1.3750 (currently testing)
- 1.3660 intermediate support
- 1.3550 Main 2025 Support
Safe Trades as the FOMC approaches!
USD/CHF Outlook: Swiss Franc Renews 15-Year Highs on Shifting SNB Doctrine
- Riding on the coattails of dollar weakness and safe-haven demand for much of 2025, USD/CHF currently trades at monthly lows of 0.78698, down -1.10% in yesterday’s session alone.
- Despite renewed deflationary pressures, as seen in Monday's PPI report, safe-haven flows concerning U.S. policy, especially regarding trade, continue to benefit CHF pricing,
- While the SNB has been expected to return to its usual playbook of currency interventions to weaken the franc, recent market realisations suggest that new leadership is less interested in ‘interventionist’ policy.
Currently on pace for its best yearly performance in over two decades, 2025 has been an interesting year for dollar-franc traders.
While recent domestic GDP numbers and continuing deflationary pressures within the Swiss economy would typically bode poorly for the Swiss franc, the significant appreciation in value seen across much of this year can be summed up in three words: safe-haven flows.
This goes double considering the recent change of tack from the Bank of Japan, with the unwinding of the now infamous carry trade diverting much of the demand for safe-haven currencies towards the franc over the yen.
Despite an unremarkable economic performance, at least one outcome is a rapid appreciation in franc value, currently at #1 in year-to-date performance, with the euro coming in a close second place.
USD/CHF: Shifting SNB doctrine to remove USD/CHF downside limit
With the Swiss franc trading at multi-year highs since June, many expected the Swiss National Bank to intervene, in a return to its typical playbook.
Having relied heavily on currency intervention to control CHF pricing in years past, it would seem that new leadership, under Chair Martin Schlegel, is less interested in ‘interventionist policy’ than his predecessors.
While the market has slowly but surely come to this realisation, having seen many opportunities this year where intervention would have likely happened in years past, it seems the SNB is taking a more hands-off approach.
This has been further vindicated by the SNB's clear difference in buying habits, which have purchased fewer francs in the last twelve months than in previous years by an order of magnitude.
While traders have been cautious about taking further CHF shorts, fearing a potential for intervention, it would seem that, once all pieced together, the SNB is more comfortable with a stronger franc than once thought.
On this basis, considering the SNB is more likely to leave the CHF at the mercy of market forces in the short term, we can consider USD/CHF downside renewed, as seen in yesterday’s session.
That said, traders would do well to remember that an apparent change to ‘non-interventionalist’ policy only remains true until it doesn't; so best to approach with at least some caution.
USD/CHF: Technical Analysis 17/09/2025
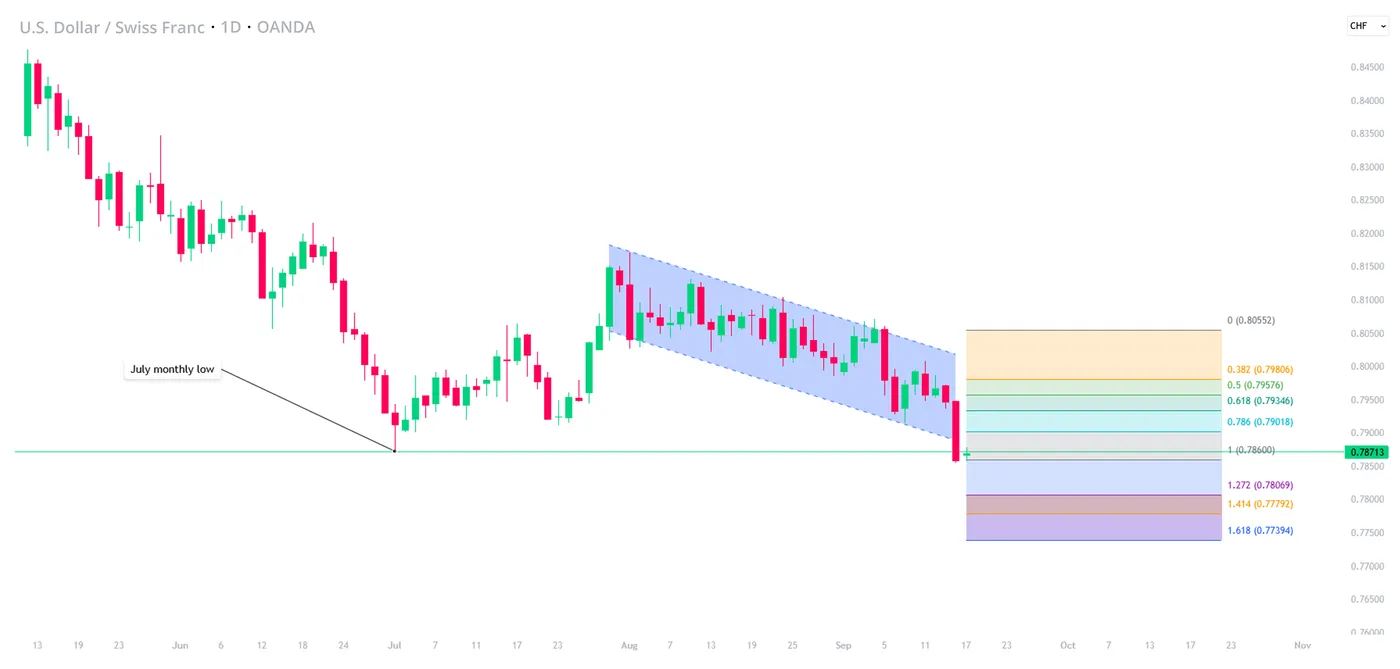
USD/CHF, OANDA, TradingView,17/09/2025
- Painting fresh 15-year lows in yesterday’s session, bearish momentum has been renewed owing to SNB developments. Breaking previous lows at 0.78713, the level has failed to offer any support to a falling USD/CHF price.
- Yesterday’s price action also broke the previously held downwards channel, with 0.78500 being an obvious next key level target should downside continue.
- In line with Fibonacci theory, and assuming price will stage a short-term retracement, bears will likely consider 0.79018 as an entry point. Otherwise, and if price continues to break down, 0.78069 will be the next target
Sunset Market Commentary
Markets
UK eco data this week won’t alter the outcome of tomorrow’s Bank of England meeting. Labour market (yesterday) and inflation numbers (this morning) printed bang in line with consensus. The unemployment rate stabilized in the 3 months to July at 4.7% with job growth rising by 232k. Preliminary August payrolls (different statistical series) dropped by 8k. The labour market isn’t the central bank’s biggest worry though. Sticky inflation is. UK price growth accelerated to 0.3% M/M with the annual number stabilizing at a 3.8% Y/Y 18-month high, in line with the path set out by the BoE in August. The UK central bank expects price growth to peak at 4% Y/Y in September and to hold in the high 3.5%-4% range until year-end. Core inflation slowed from 3.8% Y/Y to 3.6% Y/Y with services inflation at 4.7% Y/Y from 5% Y/Y mainly because of lower, volatile, airfare prices. The central bank’s core services gauge probably ticked up from 4.9% Y/Y to 5% Y/Y and food inflation – important for shaping households’ inflation expectations – accelerated to 5.1% Y/Y. Economic developments suggest that the BoE will signal an end to its quarterly rate cutting pace in place since August of last year. UK money market fully discount a next rate cut by August of next year! Apart from a hawkish pause, attention will go to quantitative tightening plans for the October 2025-September 2026 period. Over the three past years, they ran down the asset purchase portfolio by £100bn each year (current holdings around £575bn) with active sales adding to the natural run-off. The median guesstimate for the next 12 months is a slowdown from £100bn to £72bn. With £49bn of gilts maturing, this would imply an increase in active sales from £13bn over the past 12 months. A shortening of the maturity of these sales is likely in order to avoid putting unwanted additional pressure on the vulnerable very long end of the UK yield curve.
The US central bank is expected to deliver a 25 bps rate cut tonight to 4%-4.25%, though the decision could face dissenting views in both directions. The bigger question is whether Powell and/or the updated quarterly Summary of Economic Projections signal the start of cutting cycle (2 more 25 bps rate cuts this year). Powell will have to walk a tight rope to keep market expectations in check. Median estimates for 2026 and 2027 will probably be closer to a neutral 3% than in June (3.5%-3.75 & 3.25%-3.5%) but the difference in opinion will be large. It’s back to navigating the stars under cloudy skies. We have the impression that US markets are willing to pick up any dovish signals tonight, adding to or accelerating 2026 rate cut bets. If the tone of Powell’s presser is in line with his Jackson Hole speech, they’ll see it as an all clear with US Treasuries ready to really in bull steepening fashion and the dollar vulnerable to the loss of interest rate support. Watch technical support in the US 2-yr (3.5%) and 10-yr (4%) yield.
News & Views
Bank Indonesia unexpectedly slashed the policy rate by 25 bps today to 4.75%. It brings cumulative easing over the past 12 months to 150 bps. The central bank will keep watching growth, inflation & the currency to check the room for further cuts but there’s little doubt that there is more to come. BI is in “all-out pro-growth” mode, governor Perry Warjiyo said. BI said today’s move aligns with the government’s efforts to boost the economy. President Prabowo is seeking to spur growth following protests over the cost of living with housing and village cooperative programs. The Finance Ministry and BI recently entered into a renewed “burden sharing” agreement in which the central bank helps to fund the project. That’s causing concern over central bank independence amid blurring lines between monetary authorities and the government. Recent reports of lawmakers considering rule changes to the central bank that include a lower bar for removing senior officials obviously aren’t helping. The Indonesian rupiah ended the day stronger at USD/INR 87.80. Last week’s record INR lows at 88.45 remain at very close range though.
Czechia’s central bank Deputy Governor Jan Frait said monetary policymakers shouldn’t stimulate the economy any further with more rate cuts, barring major economic shocks. Frait is particularly worried about core inflation (2.8% in August), which remained at a “less favorable level” compared to the headline outcome. The latter is driven by a decline in energy prices that “won’t last forever” while wages and services inflation keep on rising fast. Monetary policy according to Frait is no longer having a restrictive impact with the current 3.5% level of the policy rate hanging in the balance with the stronger exchange rate. The Czech koruna has appreciated in recent months to EUR/CZK 24.34. To Frait this is in line with fundamentals such as economic activity, balance of payments and favorable risk perceptions from investors.