
Sample Category Title
EUR/AUD Daily Outlook
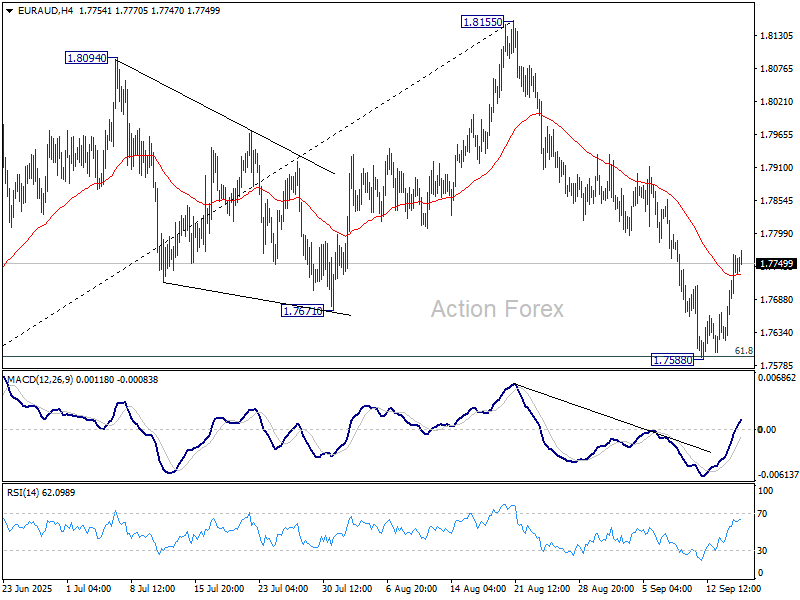
Daily Pivots: (S1) 1.7660; (P) 1.7714; (R1) 1.7803; More...
Intraday bias in EUR/AUD stays neutral for the moment, and more consolidations could be seen above 1.7588. Further decline is expected as long as 55 D EMA (now at 1.7808) holds. Corrective pattern from 1.8554 is in the third leg. Sustained trading below 61.8% retracement of 1.7245 to 1.8155 at 1.7593 will target 1.7245 support and possibly below. However, decisive break of the 55 D EMA will dampen this view, and bring stronger rally back to 1.8155 resistance instead.
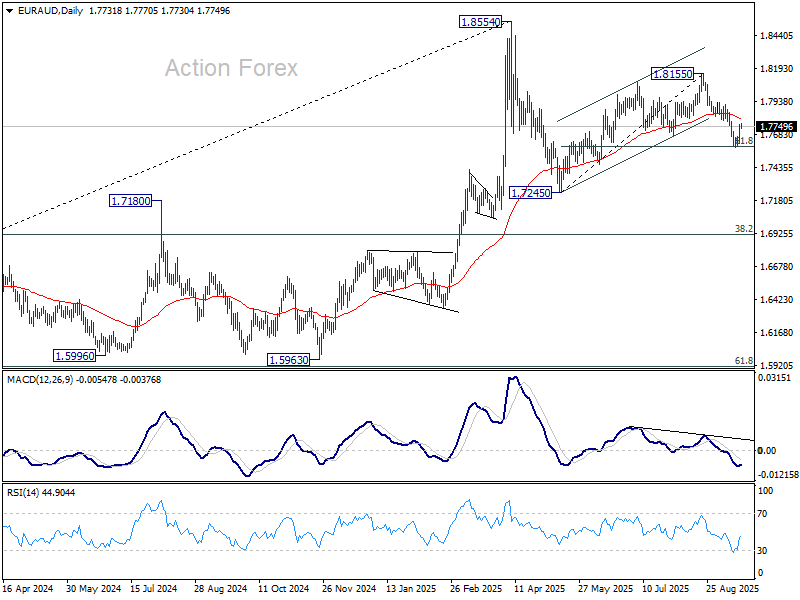
In the bigger picture, price actions from 1.8554 medium term top are seen as a corrective pattern. Deeper fall could be seen as the pattern extends, but downside should be contained by 38.2% retracement of 1.4281 (2022 low) to 1.8554 at 1.6922 to bring rebound. Uptrend from 1.4281 is expected to resume at a later stage.
EUR/CHF Daily Outlook
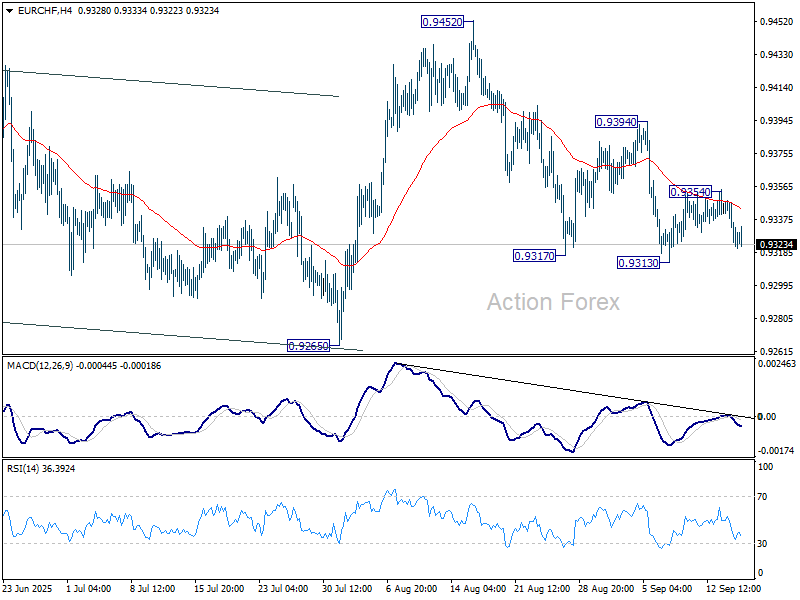
Daily Pivots: (S1) 0.9317; (P) 0.9334; (R1) 0.9344; More...
Intraday bias in EUR/CHF remains neutral as range trading continues above 0.9313. Further decline is expected with 0.9394 resistance intact. On the downside, break of 0.9313 will resume the fall from 0.9452 to retest 0.9218 low. On the upside, break of 0.9394 will bring stronger rally towards 0.9452 resistance instead.
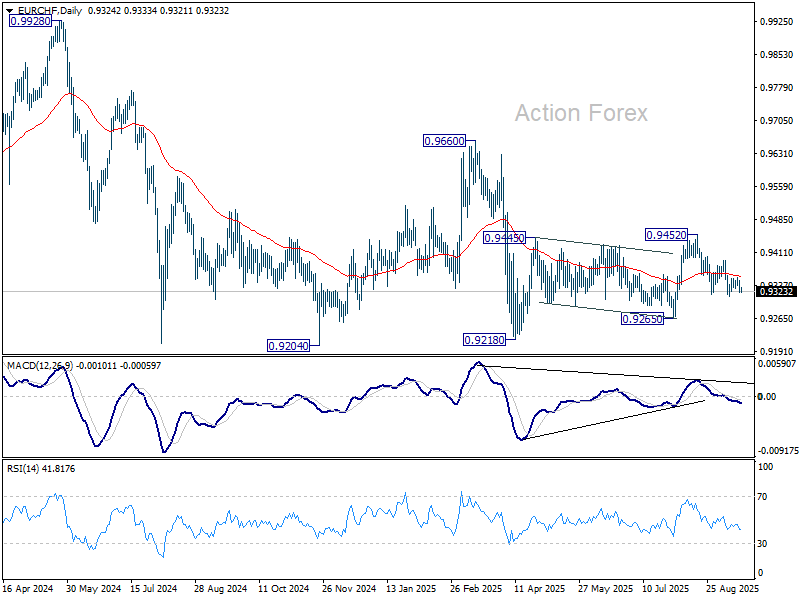
In the bigger picture, the down trend from 0.9204 (2018 high) might still be in progress considering that EUR/CHF is staying well inside the long term falling channel. However, with bullish convergence condition in W MACD, downside potential should be limited in case of another fall. Instead, firm break of 0.9660 resistance will be an important sign of medium term bullish trend reversal.
The Most Uncertain, Strangest and Politically-Influenced FOMC Meeting in Years
Markets
It’s showtime. A weak July payrolls report and Fed Chair Powell’s speech in Jackson Hole set the stage for a re-start of the Fed’s normalization cycle tonight. Powell acknowledged that risks around the Fed’s dual mandate were shifting from upward inflation risks to downward employment risks. The US labour market is some kind of optical illusion where a marked slowdown in both the supply and demand of workers keep the unemployment rate in balance. This curious equilibrium could be easily distorted if employers switch from labour hoarding to implementing job cuts. Weakness in labour demand also limits the likelihood of a virtuous price-wage spiral should US tariffs in the end have a more profound effect on prices than what currently showed in the data. Powell’s framing was less dramatic than a year ago when the Fed turned to a jumbo rate cut (50 bps). While a dissenting vote in favour of such action is possible and even likely (Waller, Miran?), the US central bank is expected to stick with a regular 25 bps rate cut to 4%-4.25%. The bigger question is whether Powell and/or the updated quarterly Summary of Economic Projections signal the start of cutting cycle (2 more 25 bps rate cuts this year). Back in June, the median estimate suggested two rate cuts during 2025. Recent comments point to quite some diverging views among FOMC members. Powell will have to walk a tight rope to keep market expectations in check. Median estimates for 2026 and 2027 will probably be closer to a neutral 3% than in June (3.5%-3.75 & 3.25%-3.5%) but the difference in opinion will be large. It’s back to navigating the stars under cloudy skies. The most uncertain, strangest and politically-influenced FOMC meeting in years makes it hard to offer guidance for the market reaction. We have the impression that US markets are willing to pick up any dovish signals tonight, adding or accelerating 2026 rate cut bets. If the tone of Powell’s presser is in line with his Jackson Hole speech, they’ll see it as an all clear. The US 2-yr and 10-yr yield (real rate suffering) are at risk of losing technical/psychologic support at respectively 3.5% and 4%. The dollar was already in dire straits earlier this week with EUR/USD yesterday closing above the 1.1829 YtD top. First 1.20+ levels since June 2021 could be in the making. Our medium-term target still stands at 1.2349 (2021 top). The trade-weighted dollar yesterday closed just above the YtD bottom (96.63 vs 96.38).
UK August inflation numbers printed in line with consensus this morning. Headline CPI accelerated to 0.3% M/M to remain steady (and sticky) at 3.8% Y/Y. Core CPI and services CPI printed at 3.6% Y/Y (from 3.8% Y/Y) and 4.7% Y/Y (from 5% Y/Y) respectively. Today’s number won’t alter the picture for the Bank of England which meets tomorrow. GBP trades unchanged after EUR/GBP yesterday followed EUR/USD’s move higher, from 0.8650 to 0.8695.
News & Views
Indonesia’s Economic Minister Hartarto confirmed to Reuters today that the EU and Indonesia have finalized a trade agreement that will be signed on September 23. Yesterday, the Financial Times already reported that the EU trade Commissioner Maros Sefcovic will travel to Indonesia to sign the agreement. The process to reach an agreement was accelerated by US President Trump’s tariff policy that affected both countries. Indonesian officials indicated that the agreement will give Indonesia zero tariffs for 80% of its exports and the removal of non-tariff barriers. At the same time, the EU will get lower tariffs for its industrial and agriculture products to the country. Bilateral trade between the two countries amounted to about $30bn last year.
Both Japanese exports (-0.1% Y/Y) and imports (-5.2% Y/Y) fell in value terms compared with August of last year. For exports it was the fourth consecutive monthly decline. Japan posted a trade deficit of JPY 242.5bn (about $1.7bn). Exports to the US declined by 13.8% compared to the same month last year as trade flows adapted to new trade tariffs imposed by the US. Exports of auto’s declined by -28.4%. The trade surplus between Japan and the US dropped to JPY 324bn, a decline of about 50% compared to the same month last year and the lowest level in one year and a half. Exports to China dropped by 0.5%. Exports to Europe rose 5.5%.
USD/CAD Daily Outlook
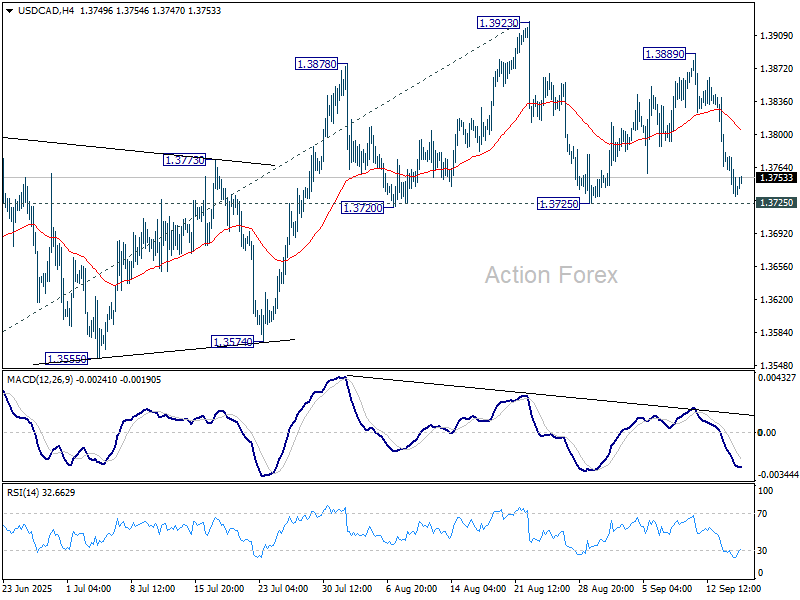
Daily Pivots: (S1) 1.3721; (P) 1.3752; (R1) 1.3770; More...
Intraday bias in USD/CAD remains neutral for the moment. On the downside, firm break of 1.3725 support will complete a head and shoulder top (ls: 1.3878, h: 1.3923, rs: 1.3889). That would indicate that corrective rebound from 1.3538 has already completed, and turn near term outlook bearish. Deeper fall should then be seen to 1.3574 support. On the upside, however, break of 1.3923 will resume the rebound towards 1.4014 cluster resistance.
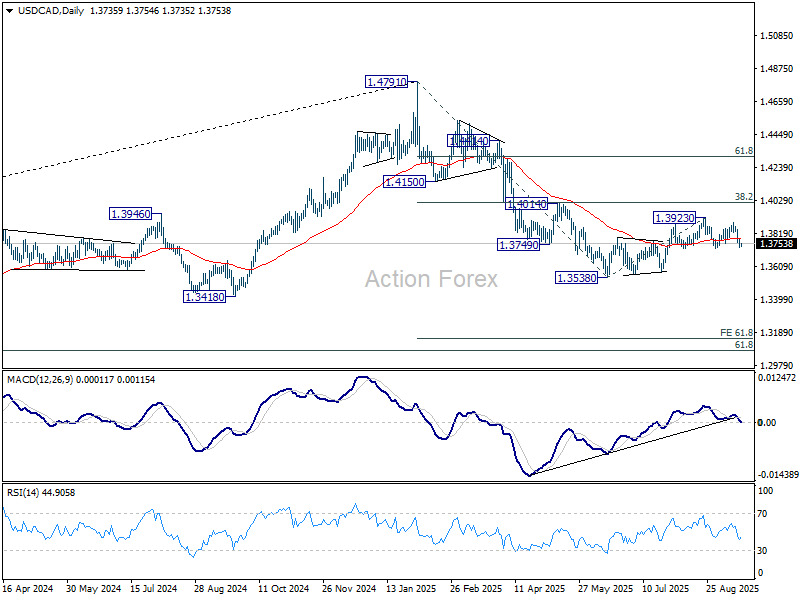
In the bigger picture, price actions from 1.4791 medium term top could either be a correction to rise from 1.2005 (2021 low), or trend reversal. In either case, further decline is expected as long as 1.4014 cluster resistance (38.2% retracement of 1.4791 to 1.3538 at 1.4017) holds. Next target is 61.8% retracement of 1.2005 (2021 low) to 1.4791 at 1.3069.
AUD/USD Daily Report
Daily Pivots: (S1) 0.6668; (P) 0.6678; (R1) 0.6696; More...
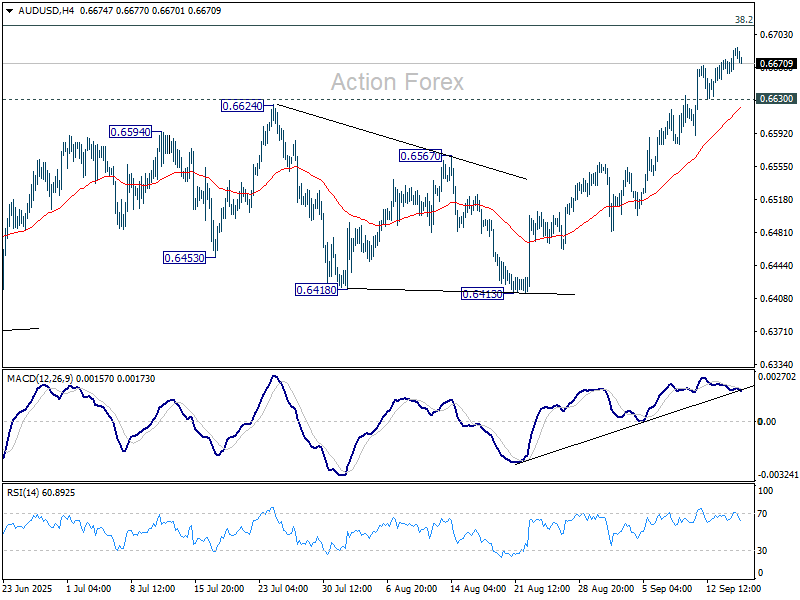
AUD/USD is losing some momentum as seen in 4H MACD, but there is no clear sign of topping yet. Intraday bias stays mildly on the upside. Current rally from 0.5913 should target 0.6713 fibonacci level. Firm break there will carry larger bullish implications. On the downside, below 0.6630 minor support will turn bias neutral and bring consolidations first, before staging another rise.
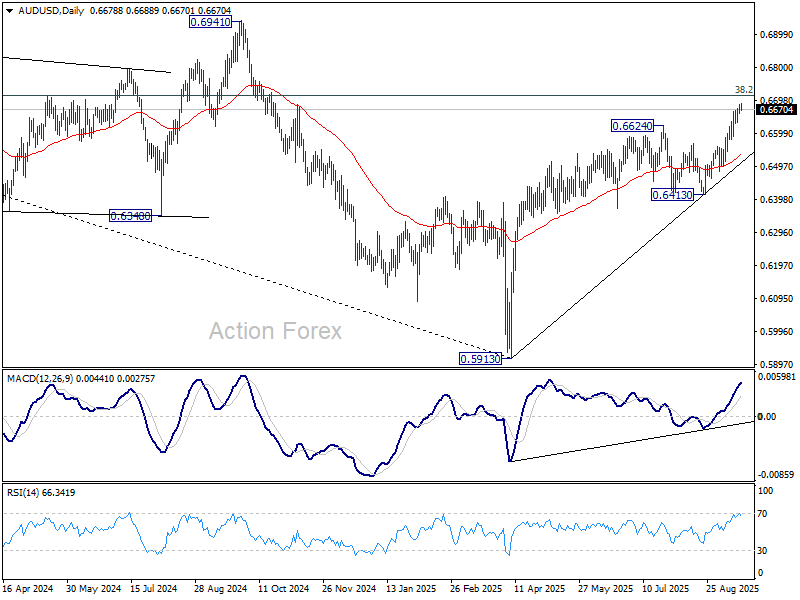
In the bigger picture, there is no clear sign that down trend from 0.8006 (2021 high) has completed. Rebound from 0.5913 is seen as a corrective move. While stronger rally cannot be ruled out, outlook will remain bearish as long as 38.2% retracement of 0.8006 to 0.5913 at 0.6713 holds. Nevertheless, considering bullish convergence condition in W MACD, sustained break of 0.6713 will be a strong sign of bullish trend reversal, and path the way to 0.6941 structural resistance for confirmation.
EUR/USD Daily Outlook
Daily Pivots: (S1) 1.1790; (P) 1.1834; (R1) 1.1911; More...
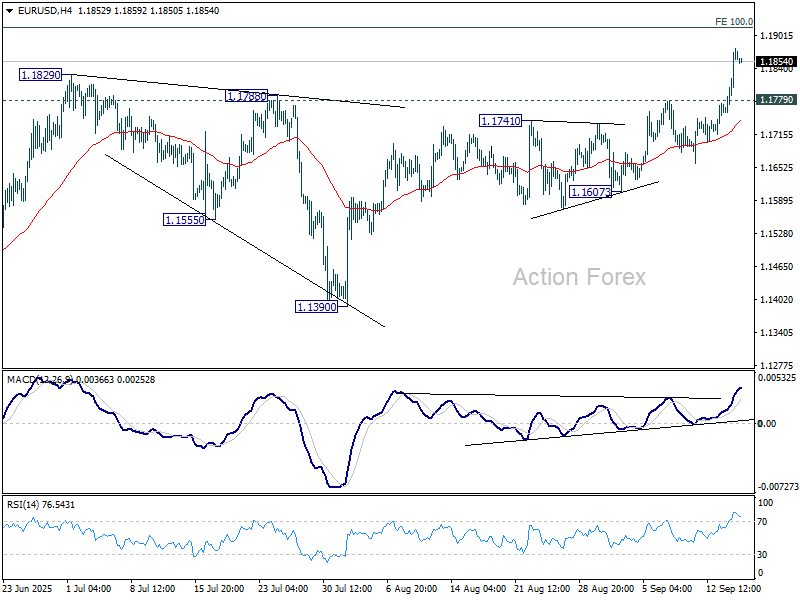
EUR/USD's break of 1.1829 confirms resumption of larger uptrend. Intraday bias stays on the upside for 1.1916 projection, and then 1.2 psychological level. On the downside, below 1.1779 minor support will turn intraday bias neutral again first.
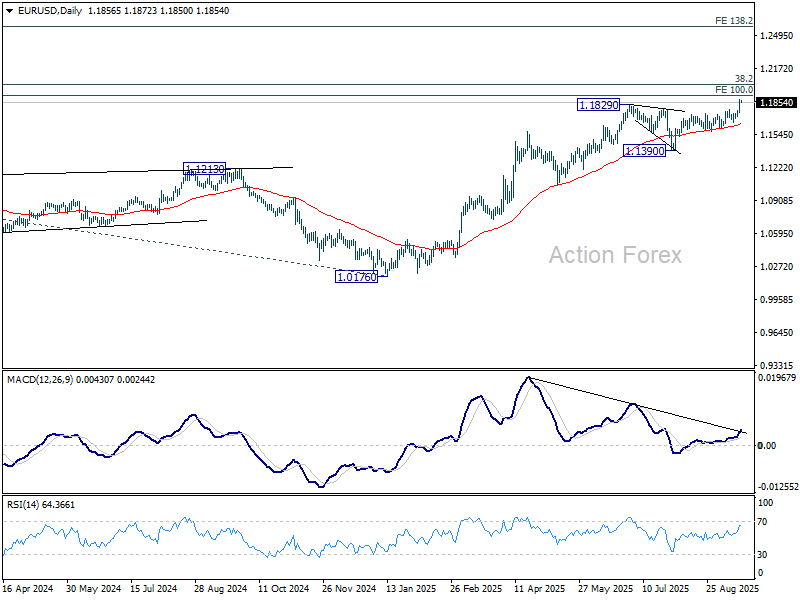
In the bigger picture, rise from 0.9534 (2022 low) long term bottom could be correcting the multi-decade downtrend or the start of a long term up trend. In either case, further rise should be seen to 100% projection of 0.9534 to 1.1274 from 1.0176 at 1.1916. Sustained break of 1.2 psychological level will carry larger bullish implications. Next target is 138.2% projection at 1.2581. This will remain the favored case as long as 55 W EMA (now at 1.1215) holds.
GBP/USD Daily Outlook
Daily Pivots: (S1) 1.3604; (P) 1.3638; (R1) 1.3680; More...
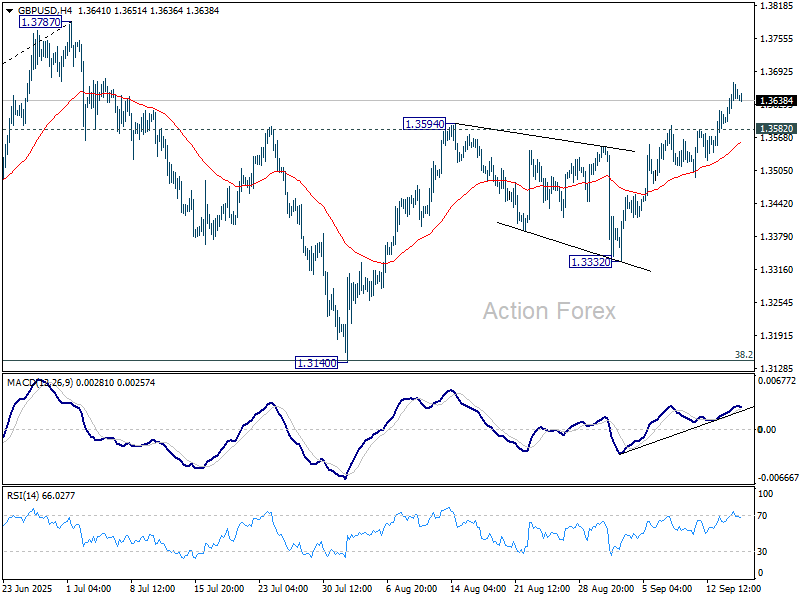
Intraday bias in GBP/USD remains on the upside at this point. Rise from 1.3140 is in progress and should target a retest on 1.3787 high. Decisive break there will resume larger up trend to 1.4004 projection level. On the downside, below 1.3582 minor support will turn intraday bias neutral first.
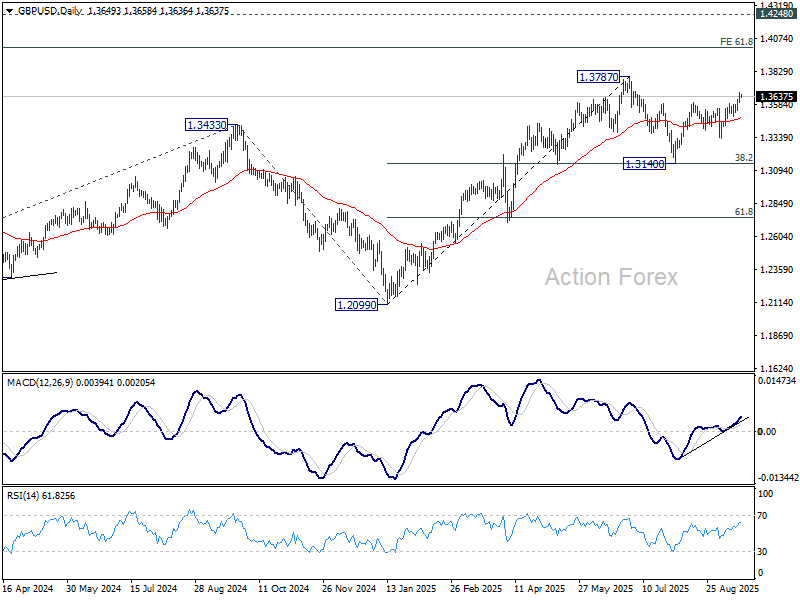
In the bigger picture, up trend from 1.3051 (2022 low) is in progress. Next medium term target is 61.8% projection of 1.0351 to 1.3433 from 1.2099 at 1.4004. Outlook will now stay bullish as long as 55 W EMA (now at 1.3151) holds, even in case of deep pullback.
USD/JPY Daily Outlook
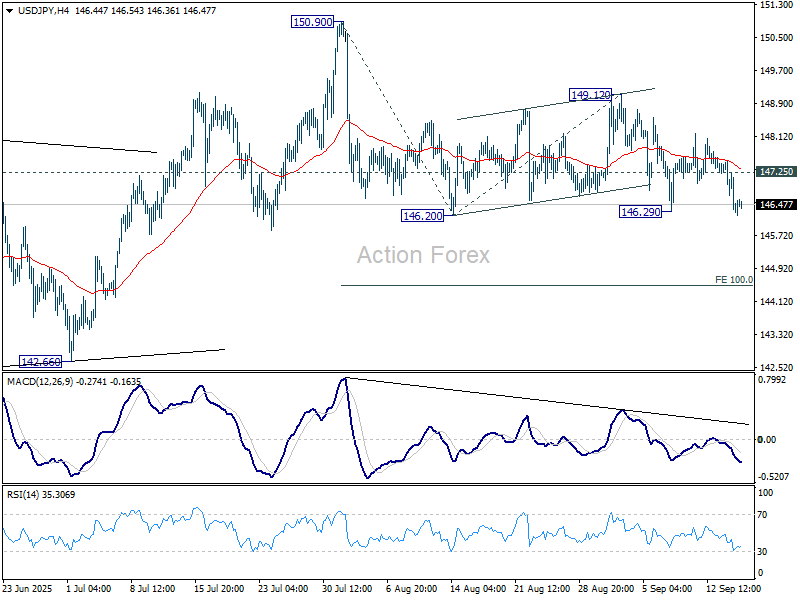
Daily Pivots: (S1) 145.98; (P) 146.76; (R1) 147.24; More...
Intraday bias in USD/JPY is back on the downside with breach of 146.29 support. Sustained trading below 146.29 will solidify the case that whole rebound from 139.87 has completed with three waves up to 150.90. Deeper decline should then be seen to 100% projection of 150.90 to 146.20 from 149.12 at 144.42. On the upside, above 147.25 minor resistance will turn intraday bias neutral again.
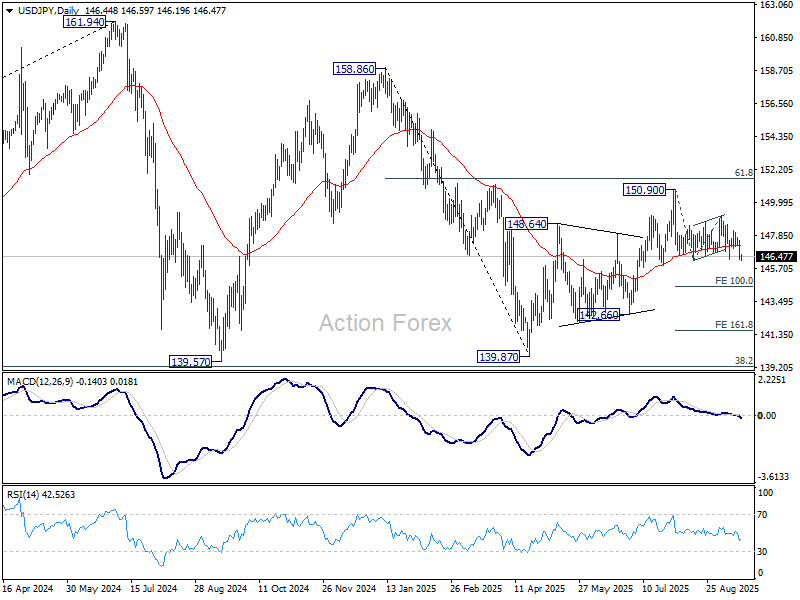
In the bigger picture, price actions from 161.94 (2024 high) are seen as a corrective pattern to rise from 102.58 (2021 low). Decisive break of 61.8% retracement of 158.86 to 139.87 at 151.22 will argue that it has already completed with three waves at 139.87. Larger up trend might then be ready to resume through 161.94 high. In case the corrective pattern extends with another fall, strong support is expected from 38.2% retracement of 102.58 to 161.94 at 139.26 to bring rebound.
EURUSD Elliott Wave Outlook: Bullish Impulse Structure Signals Further Gains
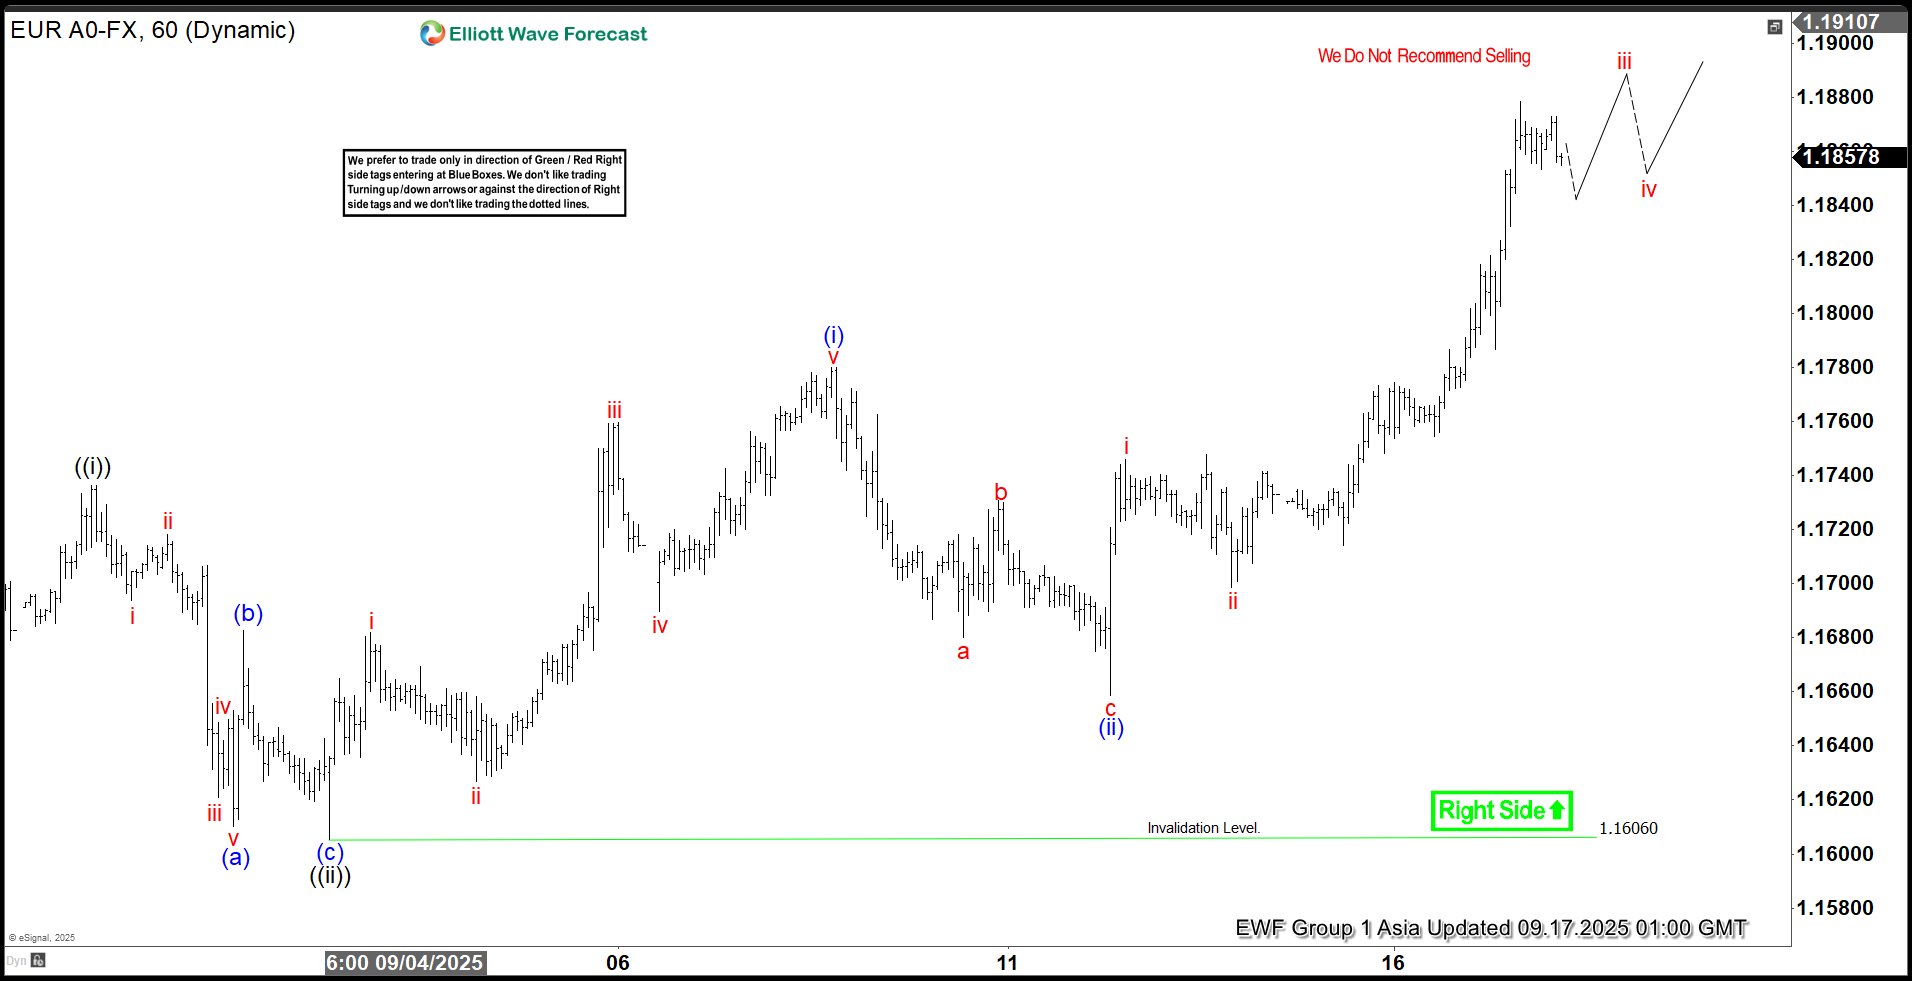
The short-term Elliott Wave analysis for EURUSD indicates an ongoing impulsive cycle that began on August 27. From that low, the pair has been advancing in a nested impulse structure. Wave ((i)) concluded at 1.1736, followed by a corrective pullback in wave ((ii)), which bottomed at 1.1605. The internal structure of wave ((ii)) unfolded as a zigzag pattern. Specifically, wave (a) declined to 1.161, wave (b) rallied to 1.1682, and wave (c) completed the correction at 1.1606, finalizing wave ((ii)) in the higher degree.
The pair has since resumed its upward trajectory within wave ((iii)). From the wave ((ii)) low, wave i peaked at 1.1682, with a subsequent dip in wave ii ending at 1.1627. Wave iii surged to 1.1759, followed by a wave iv pullback to 1.1689. The advance in wave v reached 1.178, completing wave (i) in the higher degree. A corrective wave (ii) followed, forming a zigzag that ended at 1.1658. The pair then resumed its ascent in wave (iii), with wave i reaching 1.1746 and wave ii correcting to 1.1698. In the near term, as long as the pivot low at 1.1606 holds, any dips should find support in a 3, 7, or 11 swing, signaling further upside potential.
EURUSD – 60 Minute Elliott Wave Technical Chart:
EURUSD – Elliott Wave Technical Video:
https://www.youtube.com/watch?v=iY-dpYYKT2g
FOMC Meeting Takes the Spotlight as Markets Anticipate a Cut
In focus today
Today's main event will be the FOMC meeting, where we expect a 25bp rate cut. The cut is fully priced in, and markets have even speculated about the slim chance for a larger 50bp move. We will pay close attention to the Fed's updated rate projections, which could offer key insight into the Fed's preferred pace of easing over coming months - we still forecast only gradual cuts once per quarter.
The Bank of Canada is also expected to cut rates by 25bp to 2.50%.
In the euro area, the final HICP inflation print for August is expected to confirm the flash release, that showed headline inflation at 2.1% y/y and core inflation at 2.3% y/y.
In Sweden, the Labour Force Survey for August is published. The LFS unemployment rate is always volatile and especially so this year, due to higher-than-normal flows between active and inactive job seekers.
Ahead of tomorrow's Bank of England meeting, UK CPI data for August is released today. Core inflation was 3.8% in July and largely price pressures remain too high. PMI indices suggest price pressures remained elevated in August. Regardless, we expect Bank of England to stay on hold tomorrow.
Economic and market news
What happened overnight
In the US, President Trump announced a possible TikTok deal with China, which includes transfer of majority ownership to US owners. Trump extended the deadline for shutting down the app to 16 December, while the details are finalized.
In Japan, exports continued to decline as US tariffs weigh on the economy. August exports declined slightly by 0.1% y/y (cons: -1.9%) and imports declined by 5.2% y/y (cons: -4.2%). Notably, exports to the US declined by 13.8% y/y following last month's decline of 10.1%. The Japanese trade balance stayed in the negatives, albeit declined less than expected to JPY -242.5bn (cons: JPY 513.6bn) from JPY -117.5bn in July.
What happened yesterday
In Germany, the EU Commission approved Germany's substantial budget increase, despite it breaching the EU's fiscal rules. This marks a significant victory for Berlin and clears the way for notable investments in defence and infrastructure. Officials stated that Berlin's surge in public spending is temporary and does not pose a threat to its fiscal stability. The budget for 2026 now needs to be passed in parliament where the government has a majority. We expect the government to pass the draft budget in parliament, which should boost German GDP growth to 1.3% y/y in 2026 from 0.3% y/y in 2025.
The ZEW index for September shows increasing divergence between current growth and future expectations. The current situation assessment fell more than expected to -76.4 (cons: -73.6) from -68.6. This is the lowest level since May. In contrast, the expectations component for the economy rose unexpectedly to 37.3 (cons: 25.0) from 34.7. We will likely have to await the effects from fiscal easing to kick in before growth picks up as the private sector remains cautious.
In the Middle East, Israel launched a large ground assault on Gaza city. Bombardments have intensified as Israeli Defence Minister Israel Katz said, "Gaza is burning". The assault is in stark defiance of the European leaders who have threatened with sanctions. US President Trump continues to support Israel and invited Israeli Prime Minister Netanyahu to the White House in two weeks.
In the US, August retail sales came in stronger than expected and showed control group sales (the 'core' measure) growing 0.7% m/m SA (cons: 0.4%). Healthy wage growth appears to still be supporting consumption and consumer demand is still looking very healthy. Examining the details, particularly online sales grew strongly in August, which could reflect consumers' 'front-loading' purchases ahead of upcoming tariff-related price hikes.
In the UK, payrolls declined by 8K in August, while job creation was revised a bit higher over the recent months. Unemployment rate remained unchanged at 4.7% in July and wage growth with private sector ex-bonus declined slightly to 4.7% 3M/YoY from 4.8%. The data highlights the recent labour market cooling, albeit only gradually. In our perspective, more disinflation is needed to justify BoE cutting rates by more than market pricing.
Equities: Equities traded mostly lower yesterday. Europe underperformed the US, with Stoxx 600 -0.6% and S&P 500 -0.1%. This marked a reversal from recent sessions, as defensives outperformed while financials lagged. Tesla's rally extended, with the stock up 20% over the past five sessions on expectations of a sales rebound. Futures are flat this morning as markets await tonight's Fed decision.
FI and FX: EUR/USD pushed through 1.18 and reached a new four-year high, despite stronger-than-expected US retail sales, and the recent bout of dollar weakness is more likely a reflection of the positioning ahead of tonight's FOMC. Global yields showed more restraint, with yields declining somewhat across the curve led by the front end. USD/JPY slid to the lower end of the recent months' trading range around 146. In scandies, USD/NOK and USD/SEK both continued to descend into new lows, whereas the EUR-crosses saw minor upticks in line with general euro performance.