Sample Category Title
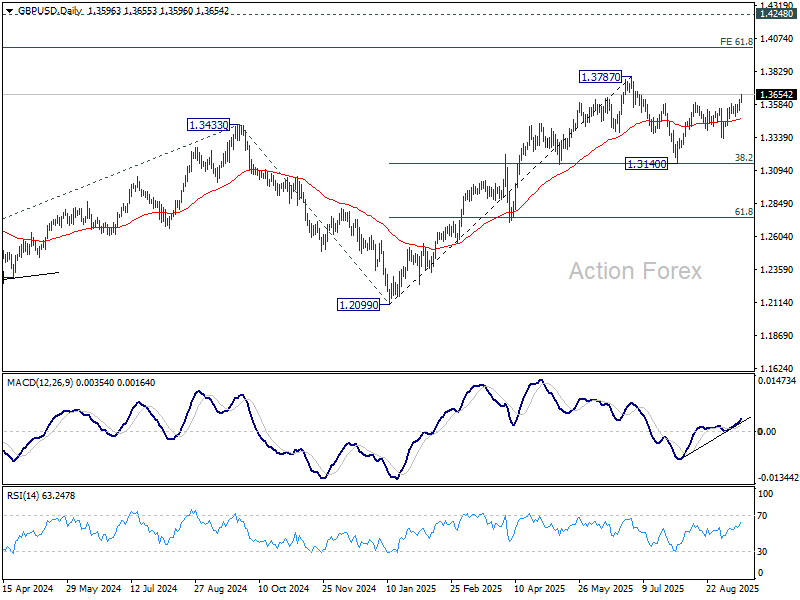
GBP/USD Mid-Day Outlook
Daily Pivots: (S1) 1.3555; (P) 1.3588; (R1) 1.3629; More...
GBP/USD's rally from 1.3140 is still in progress and intraday bias remains on the upside for retesting 1.3787 high. Decisive break there will resume larger up trend to 1.4004 projection level. On the downside, below 1.3582 minor support will turn intraday bias neutral first.
In the bigger picture, up trend from 1.3051 (2022 low) is in progress. Next medium term target is 61.8% projection of 1.0351 to 1.3433 from 1.2099 at 1.4004. Outlook will now stay bullish as long as 55 W EMA (now at 1.3151) holds, even in case of deep pullback.
Inflation Ticks Higher But Falls Short of Expectations Opening Door for Bank of Canada
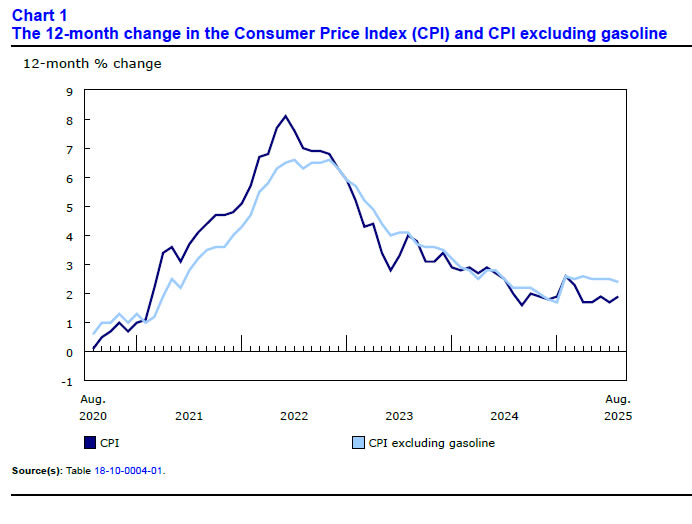
Headline CPI inflation for August came in at 1.9% year-on-year (y/y), below expectations for a 2.0% y/y print. August's reading was up from 1.7% in July.
Gasoline prices provided a smaller drag to the headline, down 12.7% y/y from -16.1% last month. On a monthly basis, prices rose 1.5% as higher refiner margins offset lower crude prices.
Prices for cellular services also fell at a slower pace (-1.2%) compared with July (-6.6%) as fewer back-to-school sales were available. Providing an offset was a steeper contraction in travel services (-3.8% y/y in August), with lower demand for destinations in the U.S. being cited by Statistics Canada as a contributor.
The Bank of Canada's (BoC) CPI-trim measure dipped to 3.0% y/y (3.1% in July), while the CPI-median index was unchanged at 3.1% y/y. The CPI excluding food and energy ticked down to 2.4% y/y from 2.5% the month prior and the CPI excluding the eight most volatile components and indirect taxes (CPIX) was unchanged at 2.6% y/y. On a seasonally adjusted monthly basis the CPIX (+0.19% from 0.06%), CPI ex. food and energy (0.13% from 0.07%) and CPI Median (0.23% from 0.14%) all accelerated in August. The CPI trim was the outlier, moderating slightly to 0.19% m/m from 0.23% m/m in July.
Key Implications
Momentum in the right direction from inflation this month, as the expected lift from energy prices had a smaller impact than expected. Moreover, even though three of the core indexes moved higher on the month, the trend towards cooler prints remains favourable.
Looking forward, the Bank of Canada should have room to cut at its meeting tomorrow. The economy continues to show signs of waning momentum as the unemployment rate ticks higher and job losses accumulate. Moreover, the termination of many retaliatory tariffs will help provide some offset to price pressures. We maintain the view that the BoC will have room to deliver two cuts this year to support growth and keep inflation in the target range.
EUR/USD Mid-Day Outlook
Daily Pivots: (S1) 1.1728; (P) 1.1751; (R1) 1.1786; More...
Intraday bias in EUR/USD remains on the upside with immediate focus on 1.1829 high. Firm break there will resume larger up trend to 1.1916 projection level next. On the downside, below 1.1757 minor support will turn intraday bias neutral again first.

In the bigger picture, rise from 0.9534 (2022 low) long term bottom could be correcting the multi-decade downtrend or the start of a long term up trend. In either case, further rise should be seen to 100% projection of 0.9534 to 1.1274 from 1.0176 at 1.1916, and further to 1.2 psychological level. This will remain the favored case as long as 55 W EMA (now at 1.1215) holds.

Dollar Struggles Despite Strong US Retail Sales, EUR/USD Eyes Key 1.1829 Resistance
Dollar remained under pressure today even after U.S. retail sales came in stronger than expected. While the data trimmed expectations of back-to-back Fed cuts in October slightly, with odds dipping yet still holding near 78%, it did little to support the greenback. Markets appear more focused on front-running a dovish outcome from tomorrow’s FOMC decision as the two-day meeting gets underway.
Attention in FX markets is firmly on whether EUR/USD can decisively break through the 1.1829 resistance. Sustained move higher would reinforce the prevailing bearish tone for Dollar and could open room for further gains in European majors.
Overall in the forex markets, Swiss Franc led the pack today. Geopolitical concerns deepened after Romania reported a violation of its airspace by Russian drones, heightening risks of conflict spillover into NATO territory. US President Donald Trump sharpened his stance, directly calling Russia the aggressor in Ukraine—a shift that signals harder U.S. positioning toward Moscow.
Commodity-linked currencies lagged despite the broader risk-on mood. Aussie and Kiwi held steady but underperformed their European peers. The softer inflation print from Canada reinforced expectations of a BoC rate cut tomorrow, but Loonie’s resilience highlights that much of the easing story was already priced in.
In Europe, at the time of writing, FTSE is down -0.34%. DAX is down -0.66%. CAC is down -0.12%. UK 10-year yield is up 0.03 at 4.665. Germany 10-year yield is up 0.026 at 2.719. Earlier in Asia, Nikkei rose 0.30%. Hong Kong HSI fell -0.03%. China Shanghai SSE rose 0.04%. Singapore Strait Times fell -0.02%. Japan 10-year JGB yield rose 0.002 to 1.604.
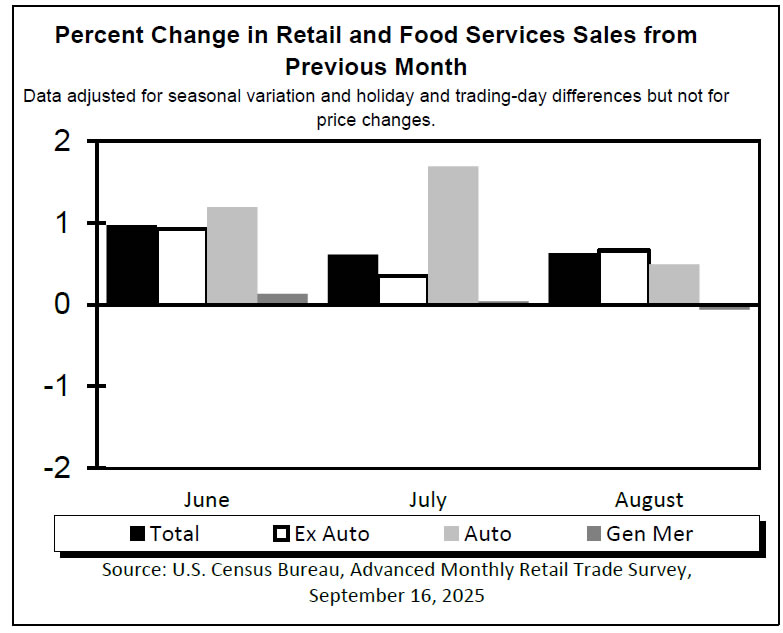
US retail sales rise 0.6% mom in August, beat forecasts with broad gains
U.S. retail sales surprised to the upside in August, rising 0.6% mom to USD 732.0B, well ahead of expectations for a 0.2% mom increase. Core categories also posted robust results, with sales excluding autos up 0.7% mom to USD 592.3B and sales excluding gasoline up 0.6% mom to USD 680.3B. Sales excluding both autos and gasoline gained 0.7% mom to USD 540.1B, pointing to broad-based consumer strength.
The latest figures confirm resilience in household spending despite high borrowing costs and moderating labor market conditions. Over the June–August period, total retail sales rose 4.5% yoy, extending steady growth and highlighting the consumer’s role as a key driver of U.S. activity.
Canada CPI edges higher to 1.9% in August, core measures ease
Canada’s headline CPI rose to 1.9% yoy in August, up from 1.7% yoy in July but slightly below market expectations of 2.0% yoy. The increase was largely due to a smaller year-on-year drop in gasoline prices, which fell -12.7% yoy in August compared with -16.1% yoy in July. Excluding gasoline, inflation rose 2.4% yoy, moderating slightly from the consistent 2.5% yoy pace of recent months.
Underlying price pressures showed further signs of cooling. CPI median measure held steady at 3.1% yoy, while the CPI trimmed eased from 3.1% yoy to 3.0% yoy, both matching expectations. CPI common measure slowed to 2.5% yoy, undershooting forecasts of 2.6% and marking a softening in broad-based inflation.
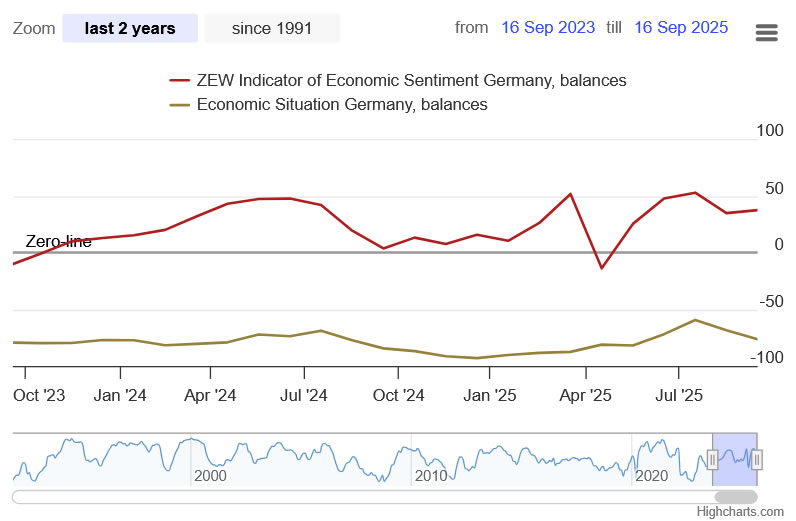
German ZEW sentiment improves, outlook brighter for exports despite weak base
Germany’s ZEW Economic Sentiment index rose more than expected in September, climbing from 34.7 to 37.3 against forecasts of 25.0. The improvement highlights growing optimism among financial market experts, particularly toward export-oriented sectors. However, Current Situation index deteriorated further from -68.6 to -76.4, missing expectations of -65.0.
For the Eurozone, ZEW sentiment index also improved, rising from 25.1 to 26.1, ahead of consensus at 20.3. Current Situation measure edged higher by 2.4 points to -28.8.
ZEW President Achim Wambach noted that while the sentiment indicator has stabilized, “the economic situation has worsened” and significant risks remain. He cited uncertainty over U.S. tariff policy and Germany’s upcoming “autumn of reforms.” Outlooks have improved for autos, chemicals, pharmaceuticals, and metals, but sentiment for these sectors remains in negative territory, showing recovery prospects are fragile.
Eurozone industrial output rises 0.3% mom, energy drag offsets goods gains
Eurozone industrial production rose 0.3% mom in July, missing expectations of a 0.5% mom gain. Output was supported by intermediate goods (+0.5%), capital goods (+1.3%), and consumer goods, with durable and non-durable production up 1.1% and 1.5% respectively. However, a sharp -2.9% decline in energy output capped overall growth.
Across the wider EU, industrial production increased 0.2% mom on the month. Croatia led gains with a 2.6% rise, followed by Hungary and Slovenia at 2.1% each, while steep drops were recorded in Estonia (-5.5%), Malta (-4.7%), and Sweden (-3.9%).
UK job losses continue, pay growth still strong
UK labor market data for August showed further signs of strain, with payrolled employment falling by -8k on the month, extending a steady decline since the peak in Q3 2024. Claimant count rose by 17.4k, less than expected 20.3k. Median monthly pay rose 6.6% yoy, up from July’s 6.0%, underlining persistent wage pressures.
In the three months to July, unemployment rate held steady at 4.7%, in line with forecasts. Average earnings excluding bonuses eased slightly from 5.0% to 4.8%, while including bonuses ticked higher from 4.6% to 4.7%. Overall, the figures show employment losses are continuing, but wage growth remains firm enough to keep the BoE cautious on policy.
RBA’s Hunter: Inflation near target, monitoring consumer strength
RBA Assistant Governor Sarah Hunter said today the central bank is “close to getting inflation to target,” with risks around the outlook now appearing "balanced". She emphasized that monetary policy works with a delay and must remain forward looking.
Hunter also noted that household spending has “picked up a bit,” with consumption showing signs of improvement and the broader position “beginning to turn over.” She added the RBA is “very closely monitoring” the underlying strength of consumer demand as it seeks to keep the economy near full employment.
July’s CPI outcome was partly affected by timing of rebates, she explained, while core inflation appears broadly in line with forecasts.
EUR/USD Mid-Day Outlook
Daily Pivots: (S1) 1.1728; (P) 1.1751; (R1) 1.1786; More...
Intraday bias in EUR/USD remains on the upside with immediate focus on 1.1829 high. Firm break there will resume larger up trend to 1.1916 projection level next. On the downside, below 1.1757 minor support will turn intraday bias neutral again first.
In the bigger picture, rise from 0.9534 (2022 low) long term bottom could be correcting the multi-decade downtrend or the start of a long term up trend. In either case, further rise should be seen to 100% projection of 0.9534 to 1.1274 from 1.0176 at 1.1916, and further to 1.2 psychological level. This will remain the favored case as long as 55 W EMA (now at 1.1215) holds.
US retail sales rise 0.6% mom in August, beat forecasts with broad gains
U.S. retail sales surprised to the upside in August, rising 0.6% mom to USD 732.0B, well ahead of expectations for a 0.2% mom increase. Core categories also posted robust results, with sales excluding autos up 0.7% mom to USD 592.3B and sales excluding gasoline up 0.6% mom to USD 680.3B. Sales excluding both autos and gasoline gained 0.7% mom to USD 540.1B, pointing to broad-based consumer strength.
The latest figures confirm resilience in household spending despite high borrowing costs and moderating labor market conditions. Over the June–August period, total retail sales rose 4.5% yoy, extending steady growth and highlighting the consumer’s role as a key driver of U.S. activity.
Canada CPI edges higher to 1.9% in August, core measures ease
Canada’s headline CPI rose to 1.9% yoy in August, up from 1.7% yoy in July but slightly below market expectations of 2.0% yoy. The increase was largely due to a smaller year-on-year drop in gasoline prices, which fell -12.7% yoy in August compared with -16.1% yoy in July. Excluding gasoline, inflation rose 2.4% yoy, moderating slightly from the consistent 2.5% yoy pace of recent months.
Underlying price pressures showed further signs of cooling. CPI median measure held steady at 3.1% yoy, while the CPI trimmed eased from 3.1% yoy to 3.0% yoy, both matching expectations. CPI common measure slowed to 2.5% yoy, undershooting forecasts of 2.6% and marking a softening in broad-based inflation.
UK Labour Market Cooling, But GBPUSD Set to Rise
The UK labour market is cooling, but not collapsing, allowing focus to remain on rising inflation. The Bank of England’s task remains to time the rate cut correctly so as not to allow the economy to cool excessively.
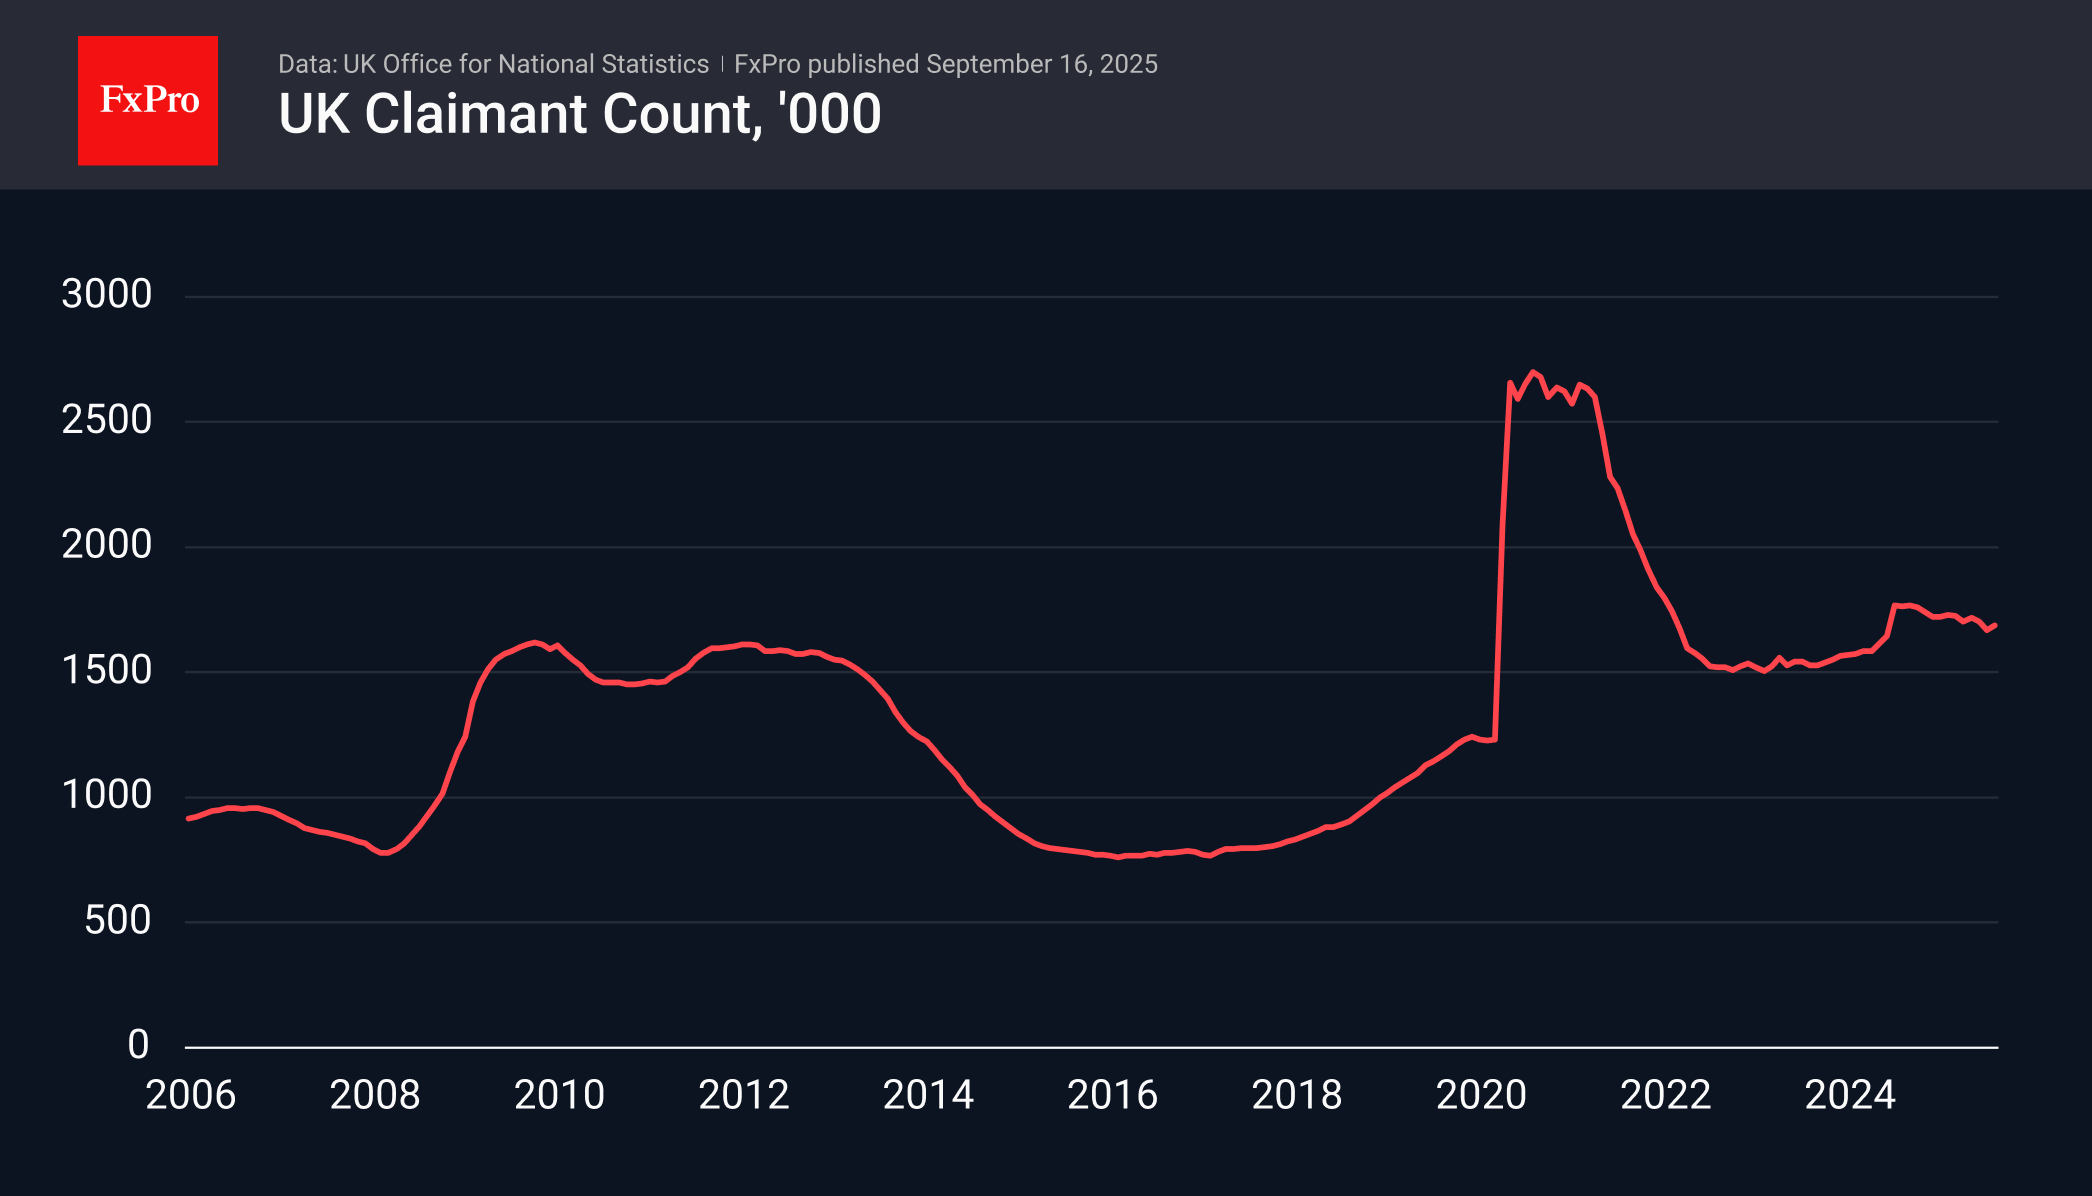
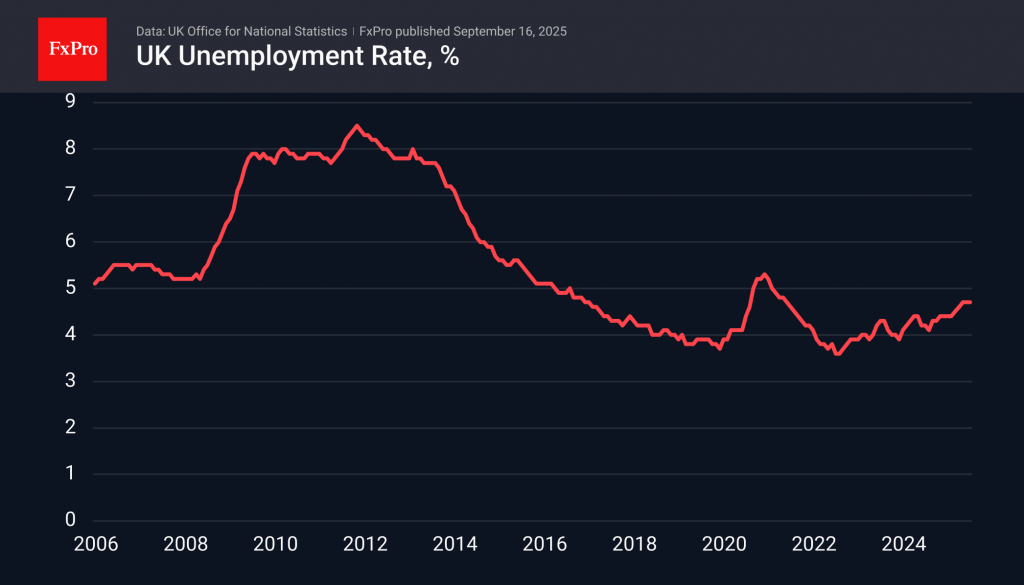
The number of claimant claims rose by 17,400 in August, slightly above the average expectation of 15,300, but following declines of 33,300 and 15,500 in the previous two months. Another indicator, the change in the number of unemployed over the last three months, showed an impressive increase of 232,000. Unemployment has remained at 4.7% for the last three months, but it is significantly higher than the 4.1% recorded in August 2024. In such conditions, the gradual decline in the number of benefit recipients appears to reflect a decrease in the number of people eligible for this type of payment, rather than an increase in employment.
Earnings growth also continues to decline. In May-July, earnings with bonuses were 4.7% higher than a year earlier, continuing the downward trend since the beginning of the year. Excluding bonuses, earnings growth was at its lowest in more than three years, reflecting both a cooling in the labour market and a slowdown in import inflation.
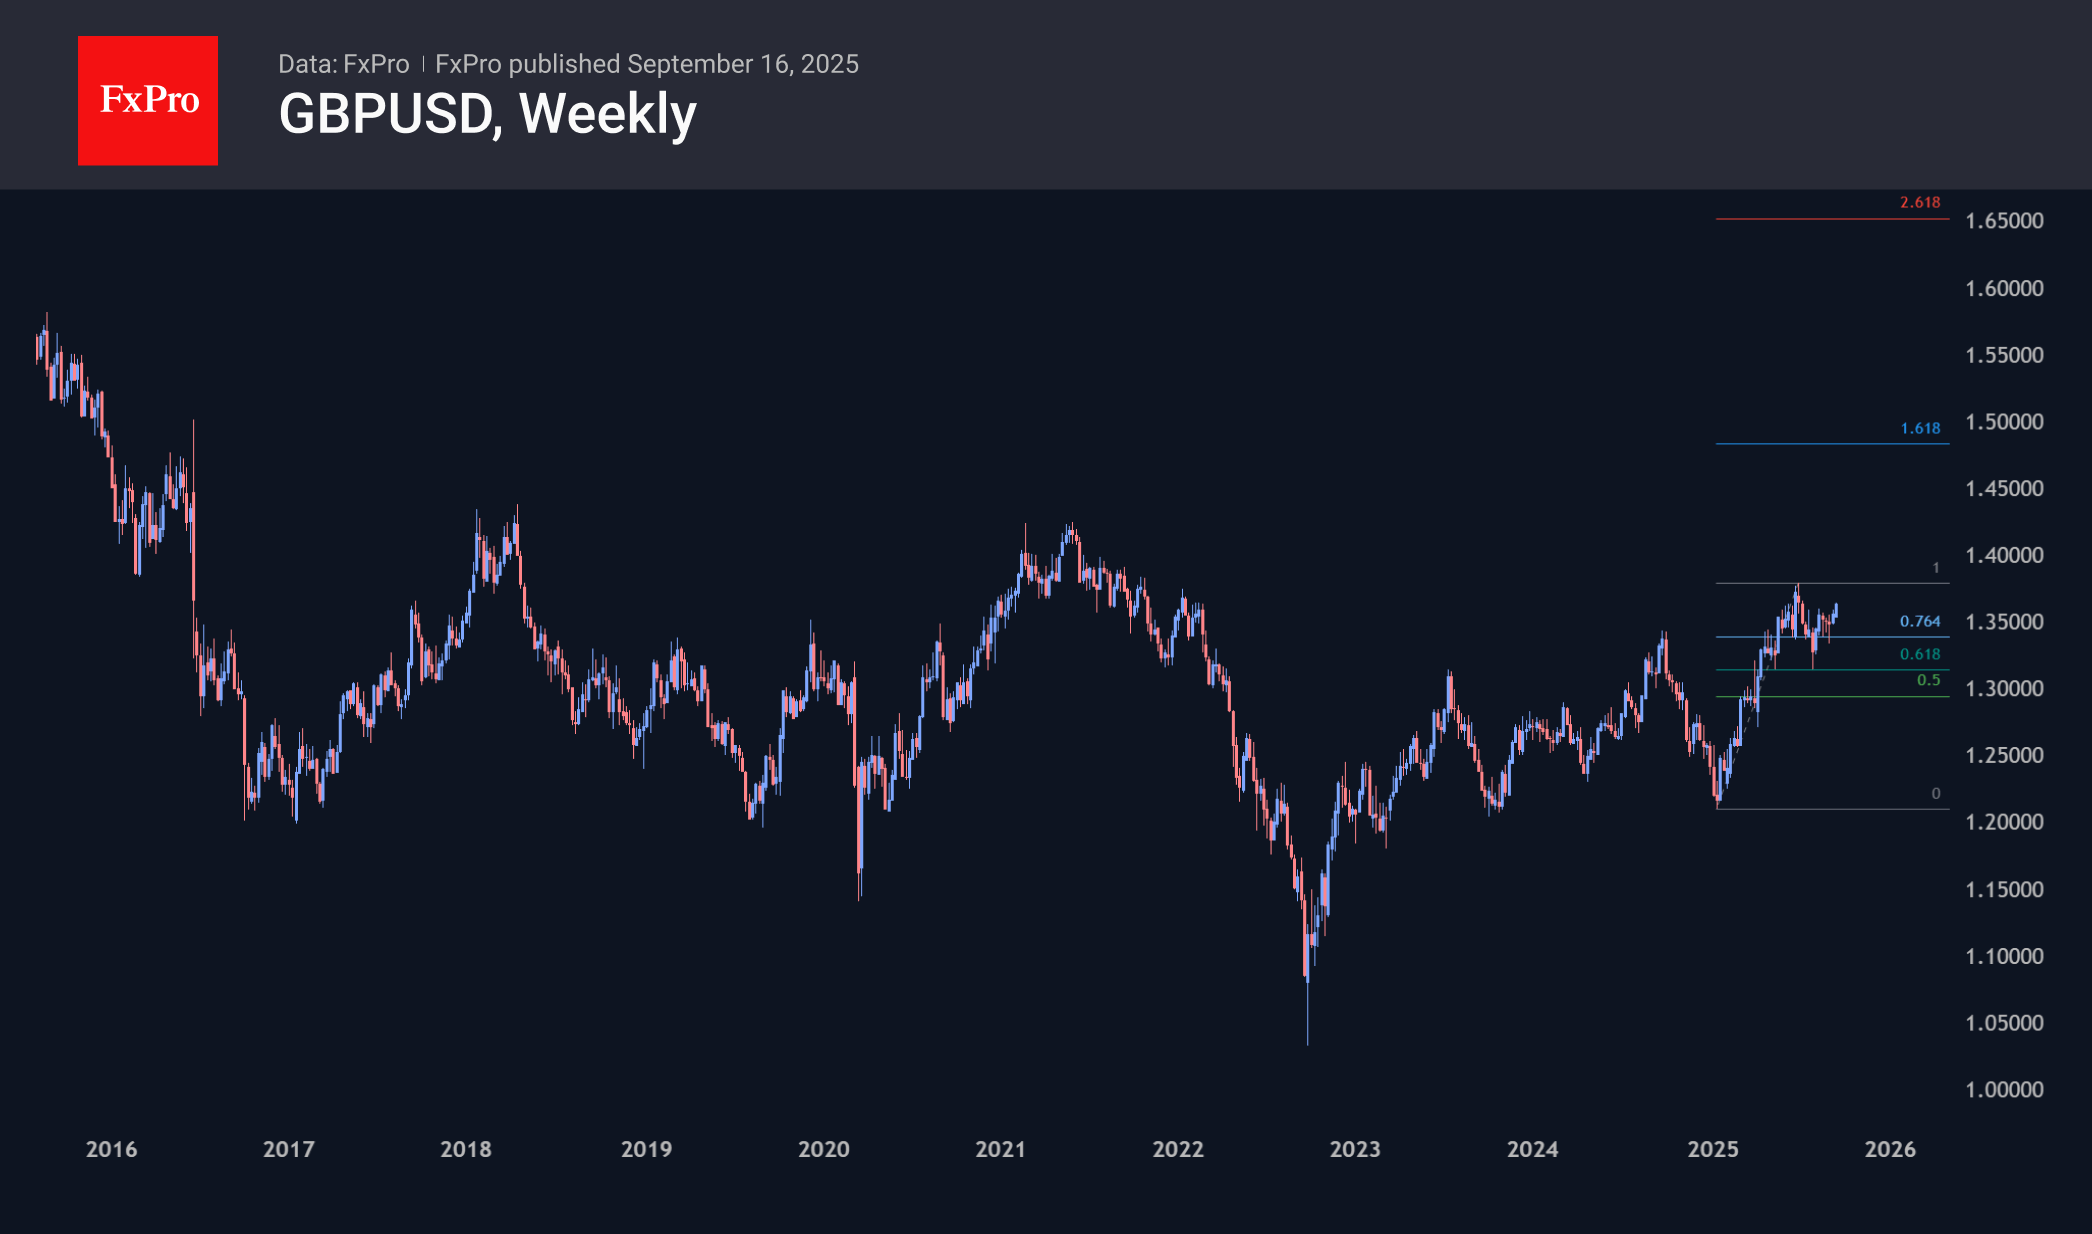
On Tuesday, the GBPUSD pair exceeded 1.3640, approaching the 4-year highs recorded in early July. The strengthening is largely due to the weakness of the dollar amid growing expectations of a Fed rate cut in the coming quarters. Breaking through 1.38 will end the corrective pullback, opening the way to 1.48, near which the 161.8% Fibonacci extension levels and the levels prior to the Brexit referendum promises at the end of 2015 are located.
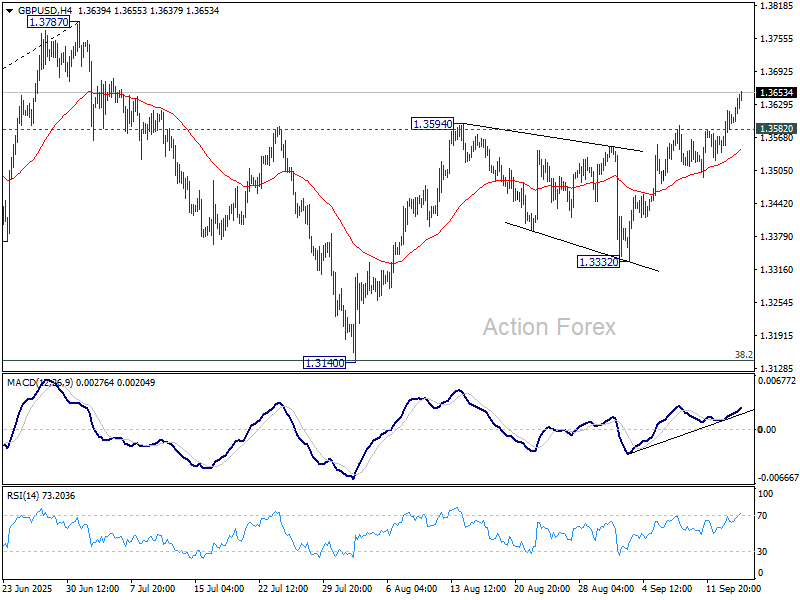
GBP/USD Technical: Sterling Rallied to a New 4-Week High, Eyeing Next Resistance at 1.3715/3750 as FOMC Looms
The price actions of the sterling have staged the expected recovery against the US dollar, as the GBP/USD has rallied by 1.2% and almost hit the lower limit of our highlighted resistance zone of 1.3650/1.3680 (printed an intraday high of 1.3645 on Tuesday, 16 September 2025, at the time of writing).
Today’s stellar performance of the GBP/USD (+0.3% has also been reinforced by better-than-expected July’s employment change data for the UK, which came in at 232,000, above the consensus of 222,000, while the unemployment rate remained steady for the third consecutive month at 4.7%, in line with expectations.
Let’s now update the short-term (1 to 3 days) trajectory and key technical elements of the GBP/USD ahead of tomorrow’s FOMC monetary policy decision outcome and the release of the latest Fed economic projections (dot plot).
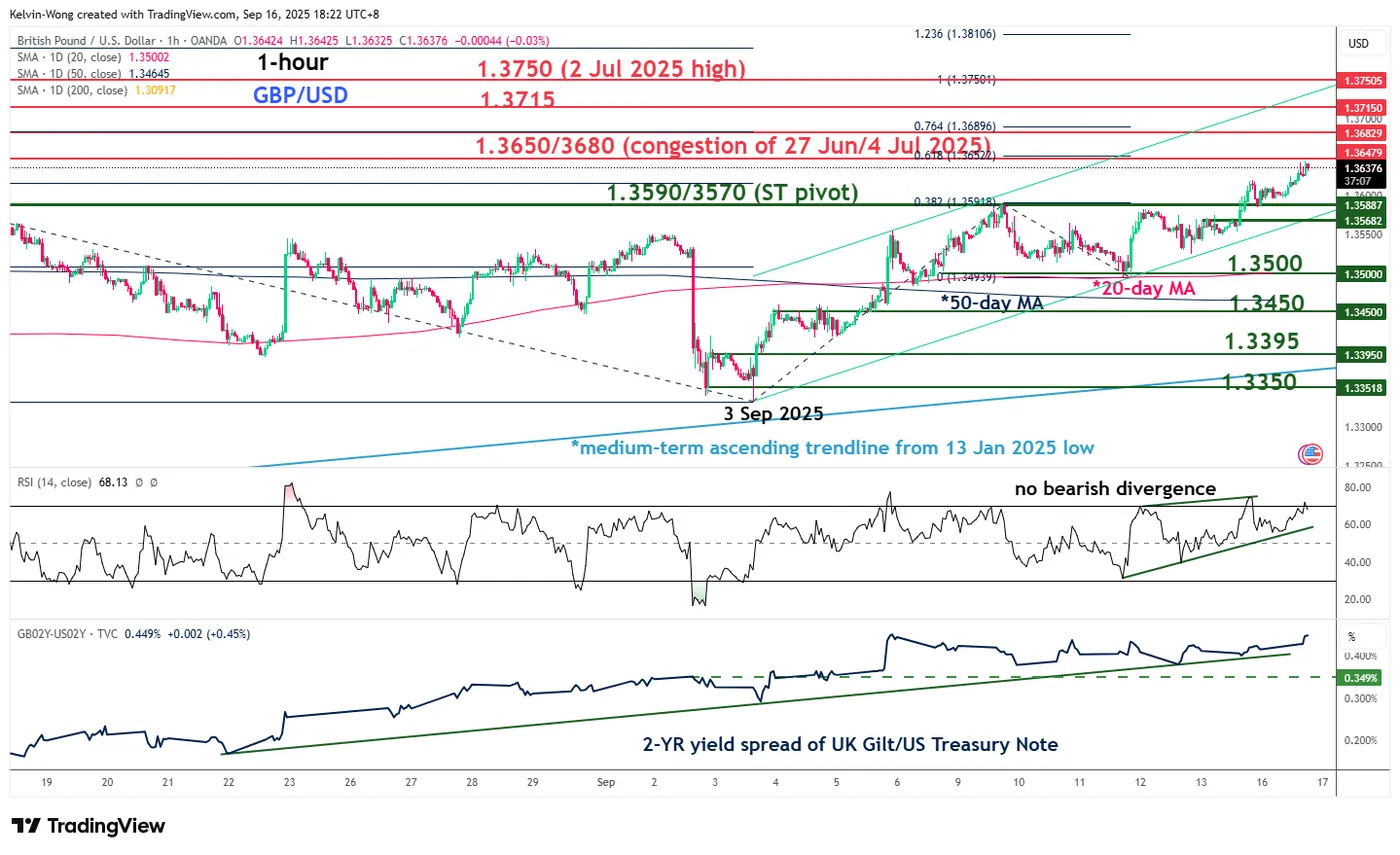
Fig. 1: GBP/USD minor trend as of 16 Sep 2025 (Source: TradingView)
Preferred trend bias (1-3 days)
A new minor bullish impulsive up move sequence is likely to have kicked off for the GBP/USD from its 3 September 2025 minor bullish reversal low of 1.3333 on the onset of the intraday spike up of the 30-year UK gilt yield over fiscal policy fears.
Maintain bullish bias above a tightened short-term pivotal support of 1.3590/1.3570 on the GBP/USD, with the next intermediate resistances to come in at 1.3715 and 1.3750 (also a Fibonacci extension).
Key elements
- The latest price actions of the GBP/USD since 3 September 2025 have evolved into a minor ascending channel, with its upper boundary now standing at around 1.3750.
- The GBP/USD has traded above its 20-day and 50-day moving averages since 5 September 2025, which reinforces the potential ongoing minor bullish impulsive up move sequence.
- The hourly RSI momentum indicator of the GBP/USD has continued to evolve in a bullish momentum condition as it manages to hold above its ascending support.
- The 2-year yield spread premium between the UK gilt and US Treasury note has continued to expand (inched higher) since the 3 September 2025 level of 0.29% to a current level of 0.45% at the time of writing.
- These observations indicate that short-term UK gilts remain relatively more attractive than US Treasuries due to their yield premium, creating a positive feedback loop that supports further strength in the GBP/USD.
Alternative trend bias (1 to 3 days)
A break below 1.3570 key short-term support in GBP/USD will negate the bullish tone for a deeper minor corrective decline to expose the next intermediate supports at 1.3500 (also the 20-day moving average) and 1.3450 (also the 50-day moving average)
Canadian Dollar Calm Ahead of Inflation Data
The Canadian dollar is steady on Tuesday, after starting the week with gains of 0.48% against the US dollar. In the European session, USD/CAD is trading at 1.3765, down 0.09% on the day. It's a busy mid-week for Canadian events, with the August inflation report later today and the Bank of Canada decision on Wednesday.
Canada's CPI expected to climb to 2%
Headline CPI is expected to rise to 2% in August, up from 1.7% in July. Two key core inflation indicators are projected to post an average of 3.05% unchanged from July.
The Bank of Canada is widely expected to lower rates at Wednesday's meeting, after holding rates for three consecutive meetings. The markets are expecting a quarter-point reduction which would lower the policy rate to 2.75%, its lowest level since July 2022.
The economy is sending out distress signals. GDP in the second quarter contracted by 1.6% and the labor market shed 100 thousand jobs in July and August. The unemployment rate rose to 7.1% from 6.9%, a three-year high.
The weak data strongly supports the case for a rate cut but underlying inflation is well above the BoC's 2% target, which is likely the reason that the central bank has held off from lowering rates. With the labor market deteriorating, the BoC will likely respond with a rate cut in order to stop the bleeding. Underlying inflation remains higher than the BoC wants to see, but barring a huge increase in inflation, a rate cut appears a done deal.
The BoC remains concerned about the US-Canada trade war, which has created a lot of uncertainty with regard to the direction of growth and inflation. However, with the announcement in August that Canada would remove counter-tariffs on US goods covered by the Canada-US-Mexico ageement, the BoC is likely to be more comfortable lowering rates.
USD/CAD Technical
- USD has dropped below support at 1.3772 and is testing 1.3766. Below, there is support at 1.3757
- There is resistance at 1.3781 and 1.3787
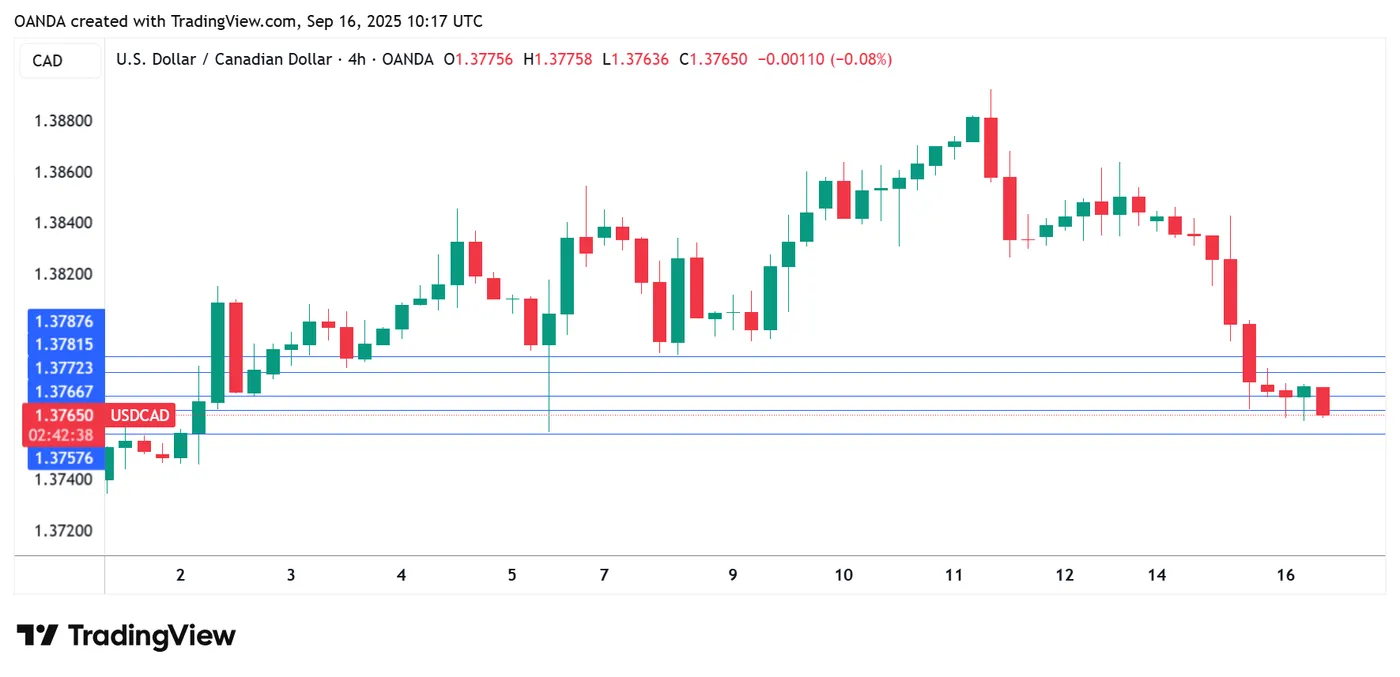
USDCAD 4-Hour Chart, September 16, 2025
German ZEW sentiment improves, outlook brighter for exports despite weak base
Germany’s ZEW Economic Sentiment index rose more than expected in September, climbing from 34.7 to 37.3 against forecasts of 25.0. The improvement highlights growing optimism among financial market experts, particularly toward export-oriented sectors. However, Current Situation index deteriorated further from -68.6 to -76.4, missing expectations of -65.0.
For the Eurozone, ZEW sentiment index also improved, rising from 25.1 to 26.1, ahead of consensus at 20.3. Current Situation measure edged higher by 2.4 points to -28.8.
ZEW President Achim Wambach noted that while the sentiment indicator has stabilized, “the economic situation has worsened” and significant risks remain. He cited uncertainty over U.S. tariff policy and Germany’s upcoming “autumn of reforms.” Outlooks have improved for autos, chemicals, pharmaceuticals, and metals, but sentiment for these sectors remains in negative territory, showing recovery prospects are fragile.