
Sample Category Title
ZEW Survey, US Retail Sales, and UK Labour Market in Focus
In focus today
In Germany, focus turns to the ZEW survey for August. Following great improvements in the first half of the year, the indicator took a hit last month with a decline in both the assessment of the current situation and expectations for growth. For today's data, consensus is looking for a further decline in both the assessment of the current situation and expectations to a four-month low.
In the afternoon, US retail sales and industrial production data is due for release. Retail sales will provide markets with the first hard data evidence of how consumer demand has evolved in August amid persistent tariff concerns. We expect to see cooling, but still relatively stable consumption growth.
The UK labour market report is released. The last report revealed a solid upward revision in payrolls data, which has raised the bar for further rate cuts. The labour market remains on a cooling trend, though, and despite the improvement in August, PMI indices suggest a continued weakness.
Economic and market news
What happened overnight
In the US, Lisa Cook is set to remain a Federal Reserve governor, following a ruling by a US appeals court. This means that Cook will be attending the FOMC meeting on Wednesday for which markets are pricing a 25bp cut. At the same time Stephen Miran, President Trump's pick for Federal Reserve governor was confirmed in a 48-47 vote in the Senate.
In the trade war, South Korea and the US have yet to finalize a trade deal as the two are caught in the details. In addition to the 25% tariff from the US, the Japanese deal signed last week adds to the pressure with Japanese auto manufacturers facing a 15% tariff vs. South Korean auto manufacturers facing a 25% tariff. While the USD 350bn investment fund in the US from South Korea is presumably at the centre of the difficulties, senior South Korean officials have said that the country is not in a position to make this investment due to the relatively small size FX market. The Koreans are concerned that a significant increase in dollar demand would depress the won.
What happened yesterday
In the US, President Trump sounded optimistic on US-China talks on Truth Social, while also announcing talks on Friday with Chinese President Xi. Recently, the US has again been threatening to ban TikTok if China does not drop demands for easier tariffs and tech restrictions. Trump also called for US companies to switch from quarterly reporting to semi-annual reporting, in an attempt to reduce compliance burdens and allow managers to focus on running their companies.
In the Ukraine war, tensions continue to build in Europe, as Poland neutralised another drone that was flying above the presidential palace. Russia's Zapad-2025 military drills in Belarus have also drawn attention. Surprisingly, two US military officers attended the drills - the first such visit in years. Poland has responded to the drills by deploying 40,000 troops to its border with Belarus.
Equities: Equities were marginally higher on Monday. Europe opened with substantial gains, but these faded once US markets opened. The S&P 500 eventually closed up 0.5%, while Stoxx 600 gained 0.4%. Once again, this was a Magnificent 7 market, with Alphabet and Tesla rising 4% despite little news. In Europe, it was more of a cyclical rotation, with consumer discretionary and banks leading the gains. In both regions, defensives sold off. The recent cyclical rebound marks a positive trend shift compared with the defensive rally seen in late August. Futures are little changed this morning.
FI and FX: A quiet start to the week with risk assets performing well, US and European rate curves bull flattening and the USD trading on the backfoot. Scandies picked up where they left off last week, this time with the SEK leading the way. Also, CAD and GBP had solid sessions, posting gains vs both EUR and the USD.
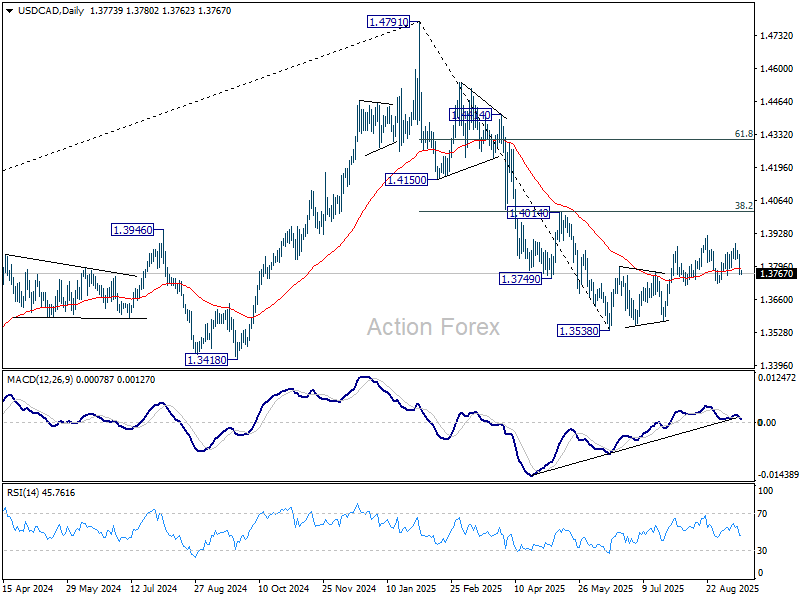
USD/CAD Daily Outlook
Daily Pivots: (S1) 1.3748; (P) 1.3797; (R1) 1.3828; More...
USD/CAD drops notably today but stays above 1.3725 support. Intraday bias remains neutral at this point. On the downside, firm break of 1.3725 support will complete a head and shoulder top (ls: 1.3878, h: 1.3923, rs: 1.3889). That would indicate that corrective rebound from 1.3538 has already completed, and turn near term outlook bearish. Deeper fall should then be seen to 1.3574 support. On the upside, however, break of 1.3923 will resume the rebound towards 1.4014 cluster resistance.
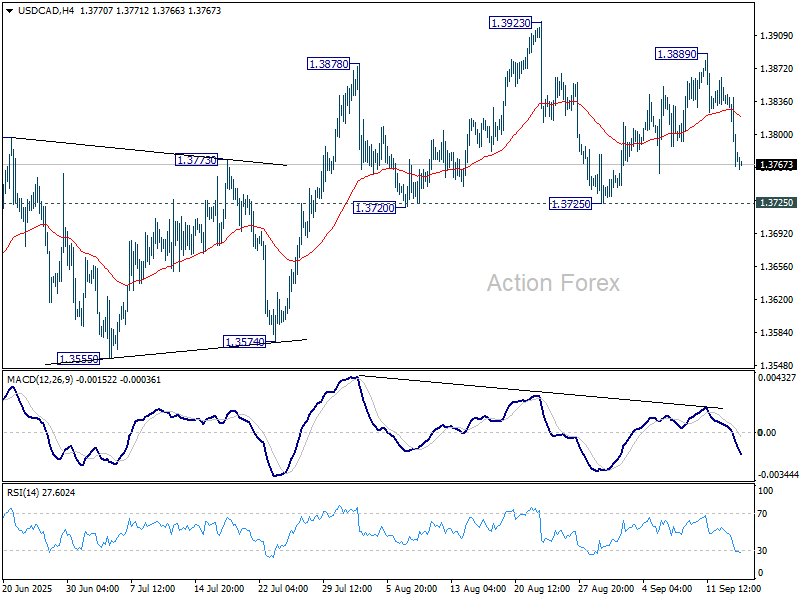
In the bigger picture, price actions from 1.4791 medium term top could either be a correction to rise from 1.2005 (2021 low), or trend reversal. In either case, further decline is expected as long as 1.4014 cluster resistance (38.2% retracement of 1.4791 to 1.3538 at 1.4017) holds. Next target is 61.8% retracement of 1.2005 (2021 low) to 1.4791 at 1.3069.
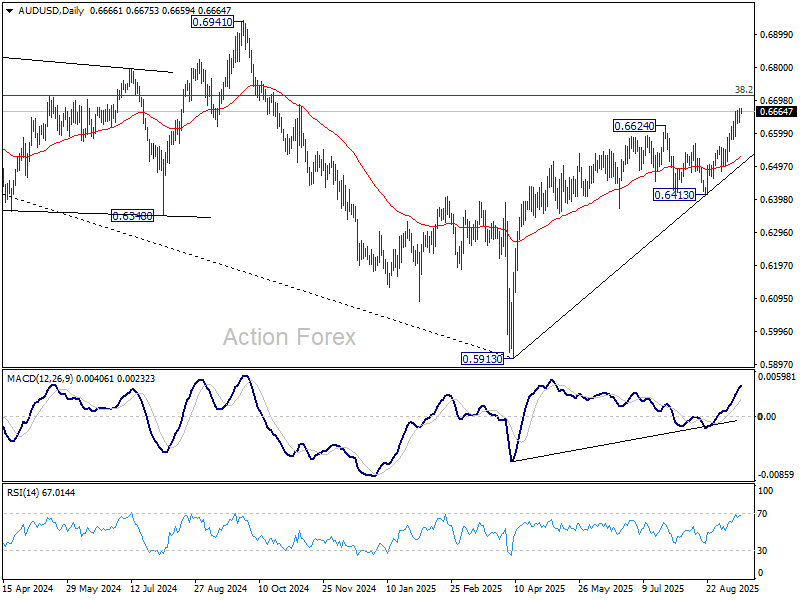
AUD/USD Daily Report
Daily Pivots: (S1) 0.6648; (P) 0.6661; (R1) 0.6684; More...
Intraday bias in AUD/USD remains mildly on the upside. Current rally from 0.5913 should target 0.6713 fibonacci level. Firm break there will carry larger bullish implications. On the downside, below 0.6630 minor support will turn bias neutral and bring consolidations first, before staging another rise.
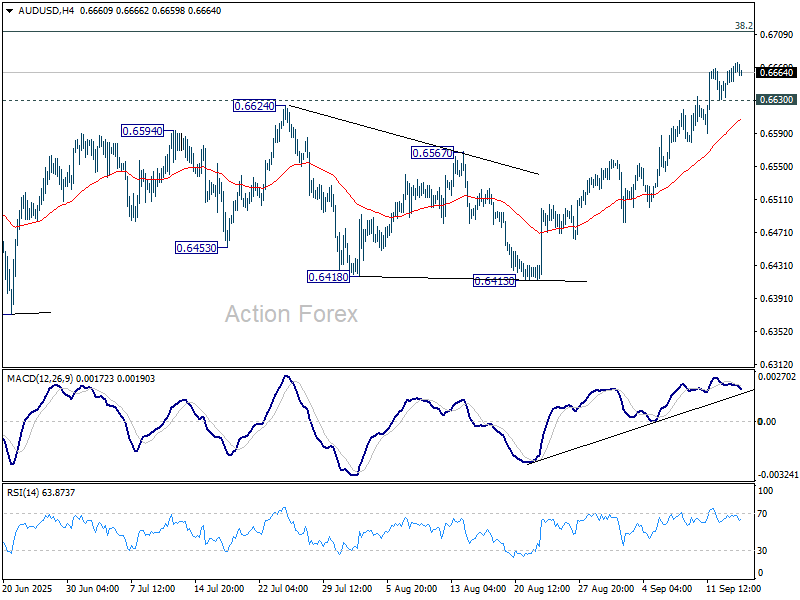
In the bigger picture, there is no clear sign that down trend from 0.8006 (2021 high) has completed. Rebound from 0.5913 is seen as a corrective move. While stronger rally cannot be ruled out, outlook will remain bearish as long as 38.2% retracement of 0.8006 to 0.5913 at 0.6713 holds. Nevertheless, considering bullish convergence condition in W MACD, sustained break of 0.6713 will be a strong sign of bullish trend reversal, and path the way to 0.6941 structural resistance for confirmation.
USD/JPY Daily Outlook
Daily Pivots: (S1) 147.15; (P) 147.48; (R1) 147.73; More...
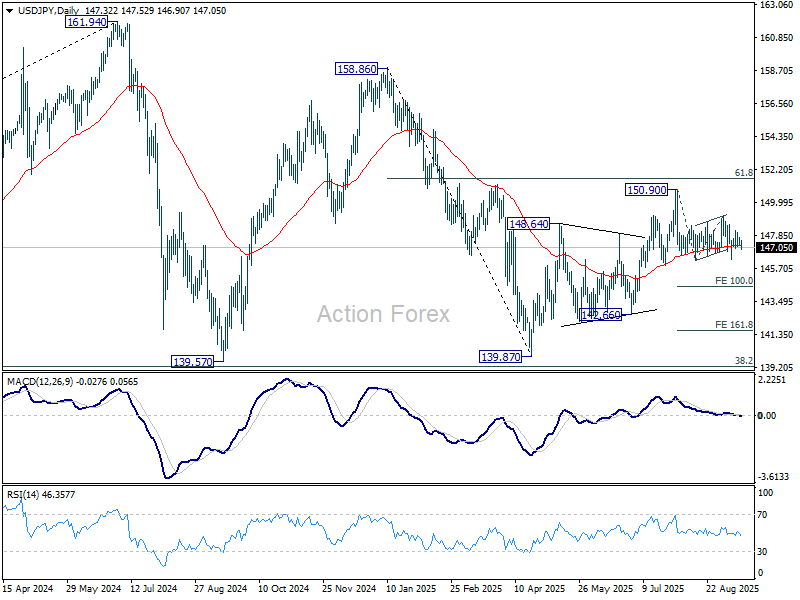
Outlook in USD/JPY is unchanged and intraday bias stays neutral. More consolidations could be seen first. Further fall is in favor as long as 149.12 resistance holds. Firm break of 146.29 will solidify the case that whole rebound from 139.87 has completed with three waves up to 150.90. Deeper decline should then be seen to 100% projection of 150.90 to 146.20 from 149.12 at 144.42.
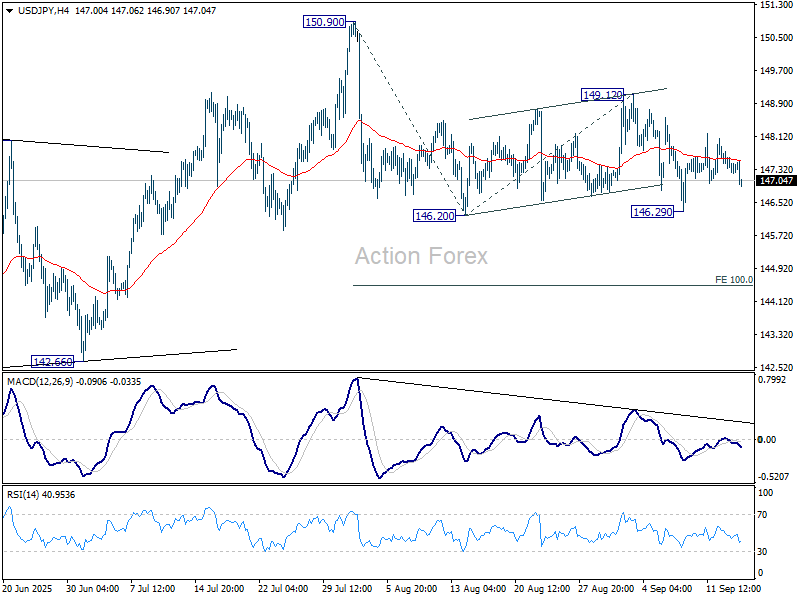
In the bigger picture, price actions from 161.94 (2024 high) are seen as a corrective pattern to rise from 102.58 (2021 low). Decisive break of 61.8% retracement of 158.86 to 139.87 at 151.22 will argue that it has already completed with three waves at 139.87. Larger up trend might then be ready to resume through 161.94 high. In case the corrective pattern extends with another fall, strong support is expected from 38.2% retracement of 102.58 to 161.94 at 139.26 to bring rebound.
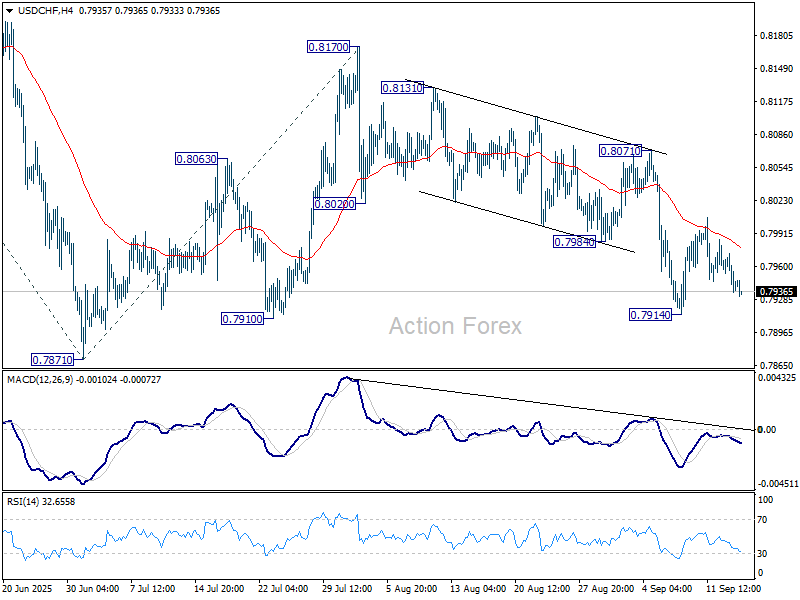
USD/CHF Daily Outlook
Daily Pivots: (S1) 0.7931; (P) 0.7953; (R1) 0.7968; More….
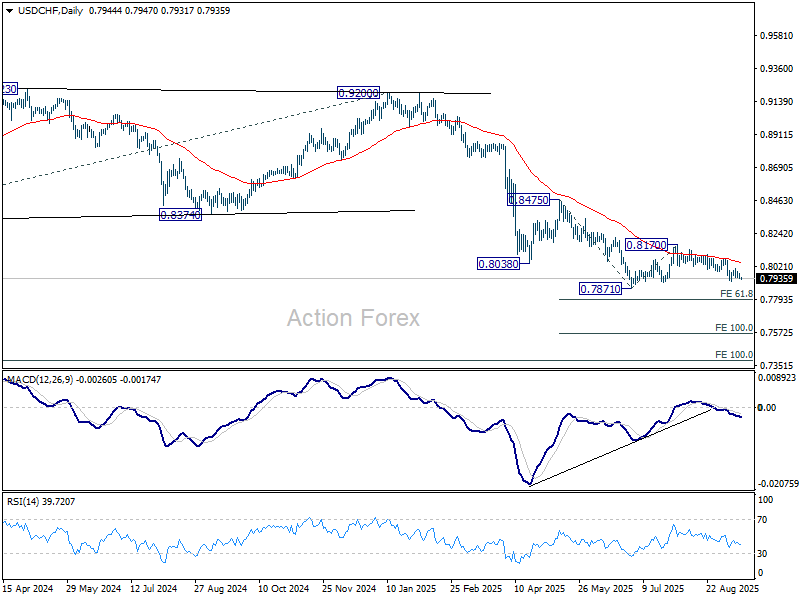
Intraday bias in USD/CHF stays neutral and more consolidations could be seen above 0.7914 support. But further rally is expected as long as 0.8071 resistance holds. Below 0.7914 will bring retest of 0.7871 low. Decisive break there will resume larger down trend to 61.8% projection of 0.8475 to 0.7871 from 0.8170 at 0.7797.
In the bigger picture, long term down trend from 1.0342 (2017 high) is still in progress. Next target is 100% projection of 1.0146 (2022 high) to 0.8332 from 0.9200 at 0.7382. In any case, outlook will stay bearish as long as 0.8332 support turned resistance holds.
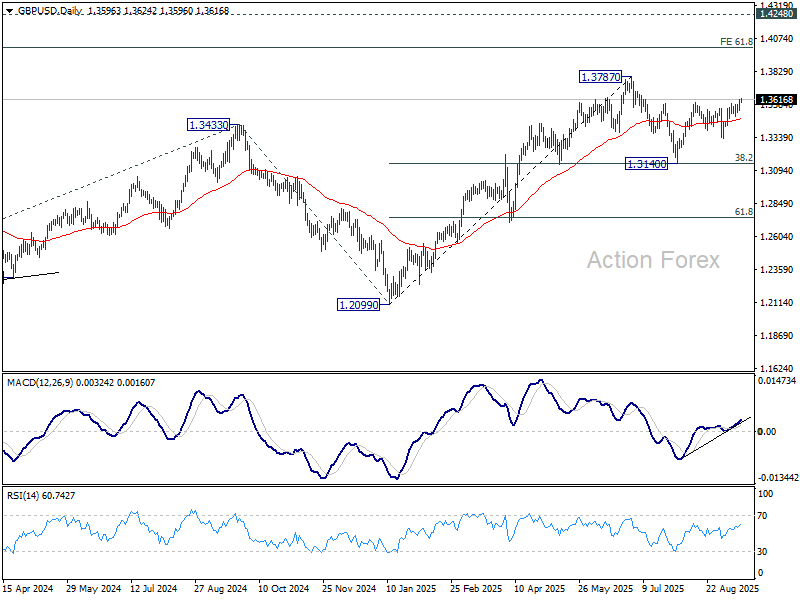
GBP/USD Daily Outlook
Daily Pivots: (S1) 1.3555; (P) 1.3588; (R1) 1.3629; More...
Intraday bias in GBP/USD remains on the upside for the moment. Rise from 1.3140 should continue to retest 1.3787 high. Decisive break there will resume larger up trend to 1.4004 projection level. On the downside, below 1.3523 support will turn intraday bias neutral again first.
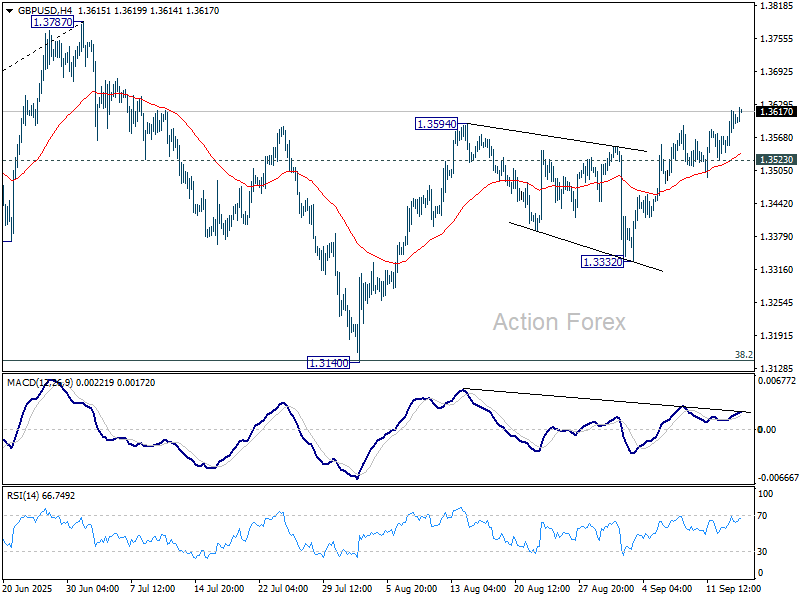
In the bigger picture, up trend from 1.3051 (2022 low) is in progress. Next medium term target is 61.8% projection of 1.0351 to 1.3433 from 1.2099 at 1.4004. Outlook will now stay bullish as long as 55 W EMA (now at 1.3151) holds, even in case of deep pullback.
EUR/USD Daily Outlook
Daily Pivots: (S1) 1.1728; (P) 1.1751; (R1) 1.1786; More...
Intraday bias in EUR/USD is back on the upside with breach of 1.1779 resistance. Rise from 1.1390 should extend to retest 1.1829 high. Firm break there will resume larger up trend to 1.1916 projection level next. On the downside, below 1.1715 minor support will turn intraday bias neutral again first.

In the bigger picture, rise from 0.9534 (2022 low) long term bottom could be correcting the multi-decade downtrend or the start of a long term up trend. In either case, further rise should be seen to 100% projection of 0.9534 to 1.1274 from 1.0176 at 1.1916. This will remain the favored case as long as 55 W EMA (now at 1.1215) holds.

Markets Rally as Fed Dovish Shift Seen Certain, TikTok Framework Struck
Risk appetite in the U.S. stayed strong overnight, with both S&P 500 and NASDAQ closing at fresh record highs. Traders leaned further into risk assets as confidence grew that the Federal Reserve will restart its easing cycle this week. Additional support came from news that Washington and Beijing had reached a “framework” agreement over TikTok, easing one source of bilateral tension.
The Fed narrative remains central. Markets are almost certain the FOMC will cut rates, a view reinforced by Monday’s confirmation of Trump nominee Stephen Miran to the Fed Board. His participation in this week’s meeting makes a rate cut even more certain.
At the same time, a U.S. appeals court ruled that Trump cannot remove Governor Lisa Cook before the decision. While that ensures her vote is also in play, it shouldn't deter Fed from the expected rate move.
Currency markets reflected the dovish Fed theme, with broad Dollar weakness persisting. The selloff helped propel Gold to a fresh record high too. Among majors, Aussie and Kiwi traded slightly softer, the Loonie showed surprise strength, and Yen found support. European currencies were mixed in the middle. Though positioning remains fluid heading into event-heavy sessions.
On the trade front, Treasury Secretary Scott Bessent announced that the U.S. and China had reached a “framework” agreement on TikTok, which could pave the way toward U.S.-controlled ownership of the platform. Chinese negotiator Li Chenggang confirmed the framework, though he urged Washington not to continue suppressing Chinese companies.
Looking ahead, the data calendar is busy. UK employment and Germany’s ZEW survey headline the European session, while Canada’s CPI and U.S. retail sales are the main attractions later in the day. UK jobs and Canadian inflation carry the most potential to move markets. But all eyes remain on the Fed, where policy direction will set the tone for global markets into year-end.
In Asia, at the time of writing, Nikkei is up 0.59%. Hong Kong HSI is up 0.08%. China Shanghai SSE is down -0.10%. Singapore Strait Times is down -0.07%. Japan 10-year JGB yield is flat at 1.603. Overnight, DOW rose 0.11%. S&P 500 rose 0.47%. NASDAQ rose 0.94%. 10-year yield fell -0.027 to 4.034.
RBA’s Hunter: Inflation near target, monitoring consumer strength
RBA Assistant Governor Sarah Hunter said today the central bank is “close to getting inflation to target,” with risks around the outlook now appearing "balanced". She emphasized that monetary policy works with a delay and must remain forward looking.
Hunter also noted that household spending has “picked up a bit,” with consumption showing signs of improvement and the broader position “beginning to turn over.” She added the RBA is “very closely monitoring” the underlying strength of consumer demand as it seeks to keep the economy near full employment.
July’s CPI outcome was partly affected by timing of rebates, she explained, while core inflation appears broadly in line with forecasts.
EUR/USD Daily Outlook
Daily Pivots: (S1) 1.1728; (P) 1.1751; (R1) 1.1786; More...
Intraday bias in EUR/USD is back on the upside with breach of 1.1779 resistance. Rise from 1.1390 should extend to retest 1.1829 high. Firm break there will resume larger up trend to 1.1916 projection level next. On the downside, below 1.1715 minor support will turn intraday bias neutral again first.
In the bigger picture, rise from 0.9534 (2022 low) long term bottom could be correcting the multi-decade downtrend or the start of a long term up trend. In either case, further rise should be seen to 100% projection of 0.9534 to 1.1274 from 1.0176 at 1.1916. This will remain the favored case as long as 55 W EMA (now at 1.1215) holds.
GBP/USD Price Action – Bulls In Control, More Gains Possible
Key Highlights
- GBP/USD extended gains and traded above 1.3550.
- It cleared a contracting triangle with resistance at 1.3575 on the 4-hour chart.
- EUR/USD might continue to rise if it clears the 1.1800 resistance.
- The UK Claimant count could change by 20.3K in Aug 2025.
GBP/USD Technical Analysis
The British Pound started a fresh increase above 1.3500 against the US Dollar. GBP/USD gained bullish momentum above 1.3550 before it faced some resistance.
Looking at the 4-hour chart, the pair remained supported and settled above the 1.3550 level, the 100 simple moving average (red, 4-hour), and the 200 simple moving average (green, 4-hour). If the bulls remain in action, there could be more gains.
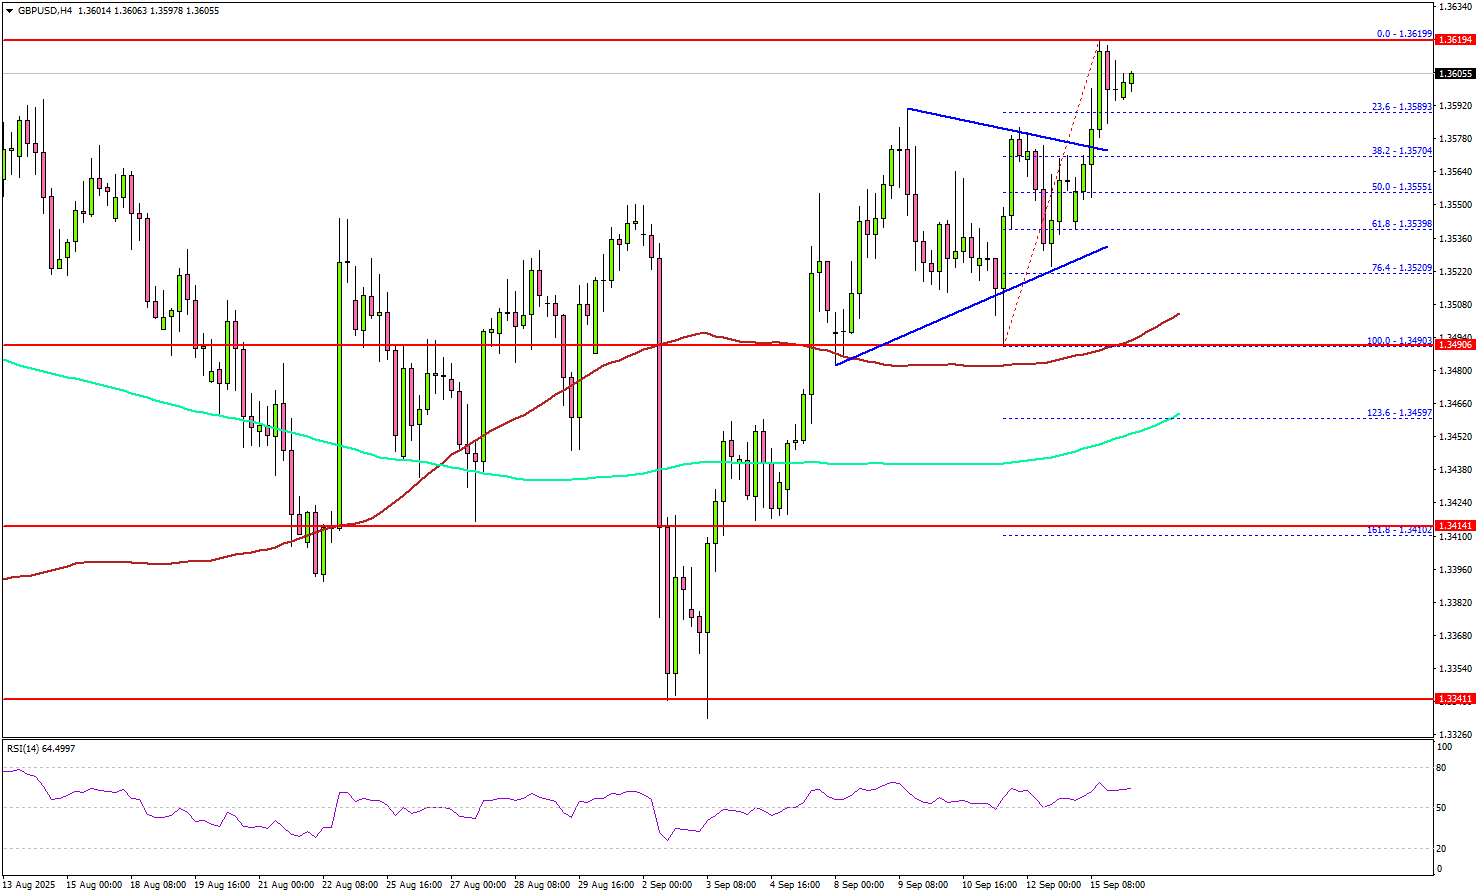
On the upside, the pair could face resistance near the 1.3620 level. The first major hurdle for the bulls could be 1.3650. A close above 1.3650 could set the pace for another increase.
In the stated case, the pair could rise toward 1.3800, above which the bulls could aim for a move toward 1.3840. Any more upsides could send the pair toward 1.3950.
On the downside, immediate support is 1.3570. The next key area of interest might be near the 1.3550 zone and the 50% Fib retracement level of the upward move from the 1.3490 swing low to the 1.3619 high.
The main support could be at 1.3500 and the 100 simple moving average (red, 4-hour). Any more losses might increase selling pressure and send GBP/USD toward 1.3440.
Looking at EUR/USD, the bulls remained in action, and they were able to push the price above the 1.1750 resistance zone.
Upcoming Key Economic Events:
- UK Claimant Count Change for Aug 2025 – Forecast 20.3K, versus -6.2K previous.
- UK ILO Unemployment Rate for July 2025 (3M) – Forecast 4.7%, versus 4.7% previous.
- US Retail Sales for August 2025 (MoM) – Forecast +0.3%, versus +0.5% previous.
RBA’s Hunter: Inflation near target, monitoring consumer strength
RBA Assistant Governor Sarah Hunter said today the central bank is “close to getting inflation to target,” with risks around the outlook now appearing "balanced". She emphasized that monetary policy works with a delay and must remain forward looking.
Hunter also noted that household spending has “picked up a bit,” with consumption showing signs of improvement and the broader position “beginning to turn over.” She added the RBA is “very closely monitoring” the underlying strength of consumer demand as it seeks to keep the economy near full employment.
July’s CPI outcome was partly affected by timing of rebates, she explained, while core inflation appears broadly in line with forecasts.