
Sample Category Title
Hang Seng Index Technical: Bullish Consolidation Above 26,200 on China Housing Recovery
The Hong Kong 33 CFD Index (a proxy of the Hang Seng Index futures) has staged the expected bullish breakout above its prior 4-week “Ascending Wedge” range resistance of 25,890 and hit the next intermediate resistance at 26,120, as highlighted in our prior report.
Thereafter, it extended its gains and scaled up to a 4-year high of 26,583 on 12 September 2025, a rally of 4.7% on the backdrop of a stronger Chinese yuan and robust bullish sentiment in China's Big Tech, such as Alibaba, Baidu, NetEase, and Semiconductor Manufacturing International Corp, riding on the tailwinds of China’s Artificial Intelligence (AI) self-reliance policy, with less usage of external semiconductor chips such as Nvidia’s H20.
Let’s now examine the latest related fundamental factors that have an impact on the Hong Kong 33 CFD Index
China’s home prices continued to decline at a slower pace
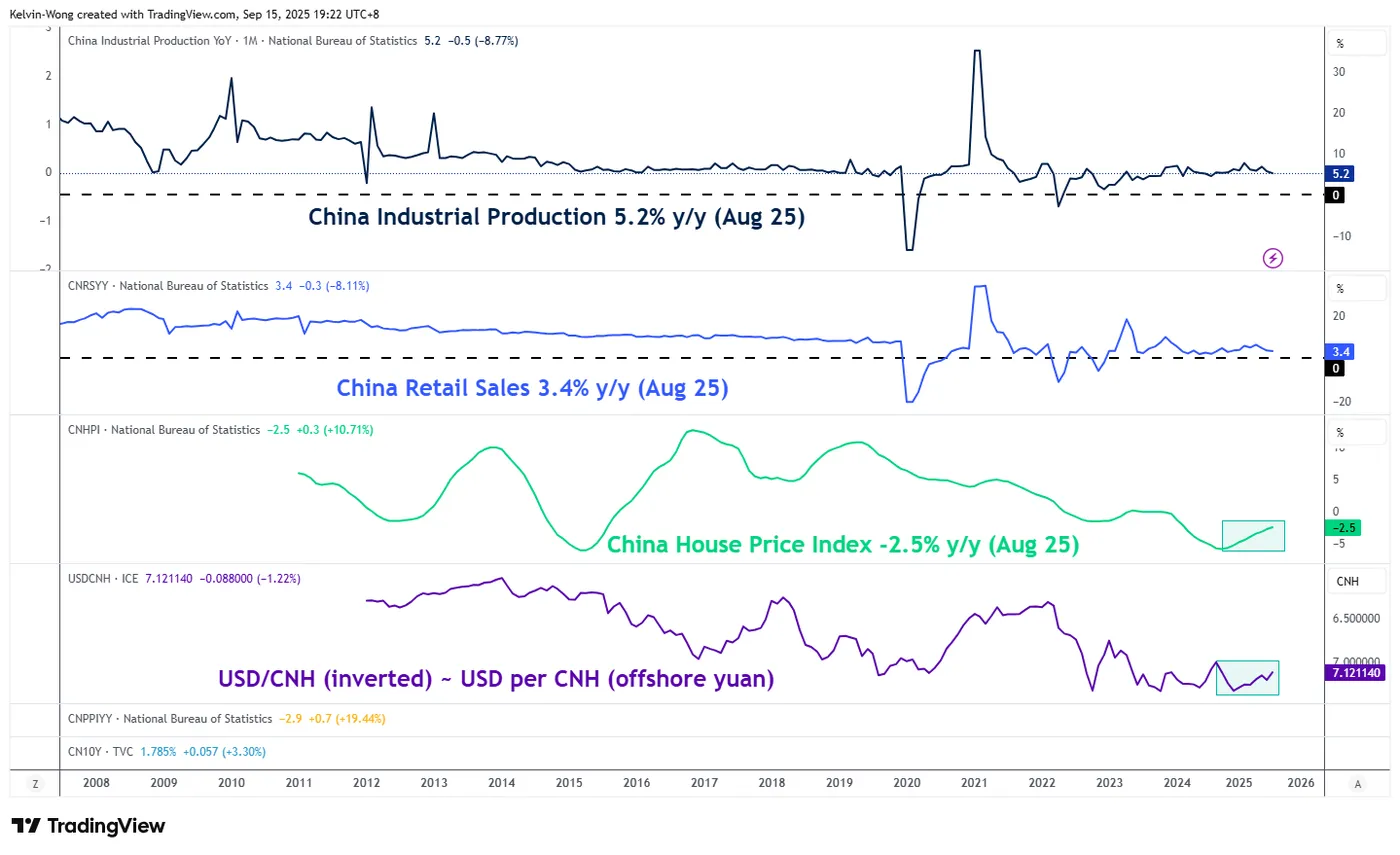
Fig. 1: China’s industrial production, retail sales, house price index for Aug 2025 (Source: MacroMicro)
Today’s release of China’s industrial production and retail sales for August, which came in below expectations, does not cause a negative material impact on the intraday movements of the China and Hong Kong stock markets, where China’s CSI 300 and Hong Kong’s Hang Seng Index closed higher by 0.2% each, respectively.
The “bullish relief” stemmed from signs of recovery in China’s housing market, a key factor in preventing an entrenched deflationary spiral. New home prices for August, released today, marked their 10th straight month of improvement since the 10-year low of -5.9% y/y recorded in October 2024.
China’s new home prices across 70 cities fell 2.5% y/y in August 2025, moderating from July’s 2.8% decline. This marks the slowest pace of contraction since March 2024 and helps ease concerns over a potential deflationary spiral in the Chinese economy (see Fig. 1).
Hence, a slower pace of decline in China’s new home prices, coupled with a firmer offshore Chinese yuan against the US dollar since April 2025, managed to trigger a positive feedback loop back into the Hong Kong 33 CFD Index.
Here comes the latest short-term (1 to 3 days) trajectory and key technical levels to watch on the Hong Kong 33 CFD Index
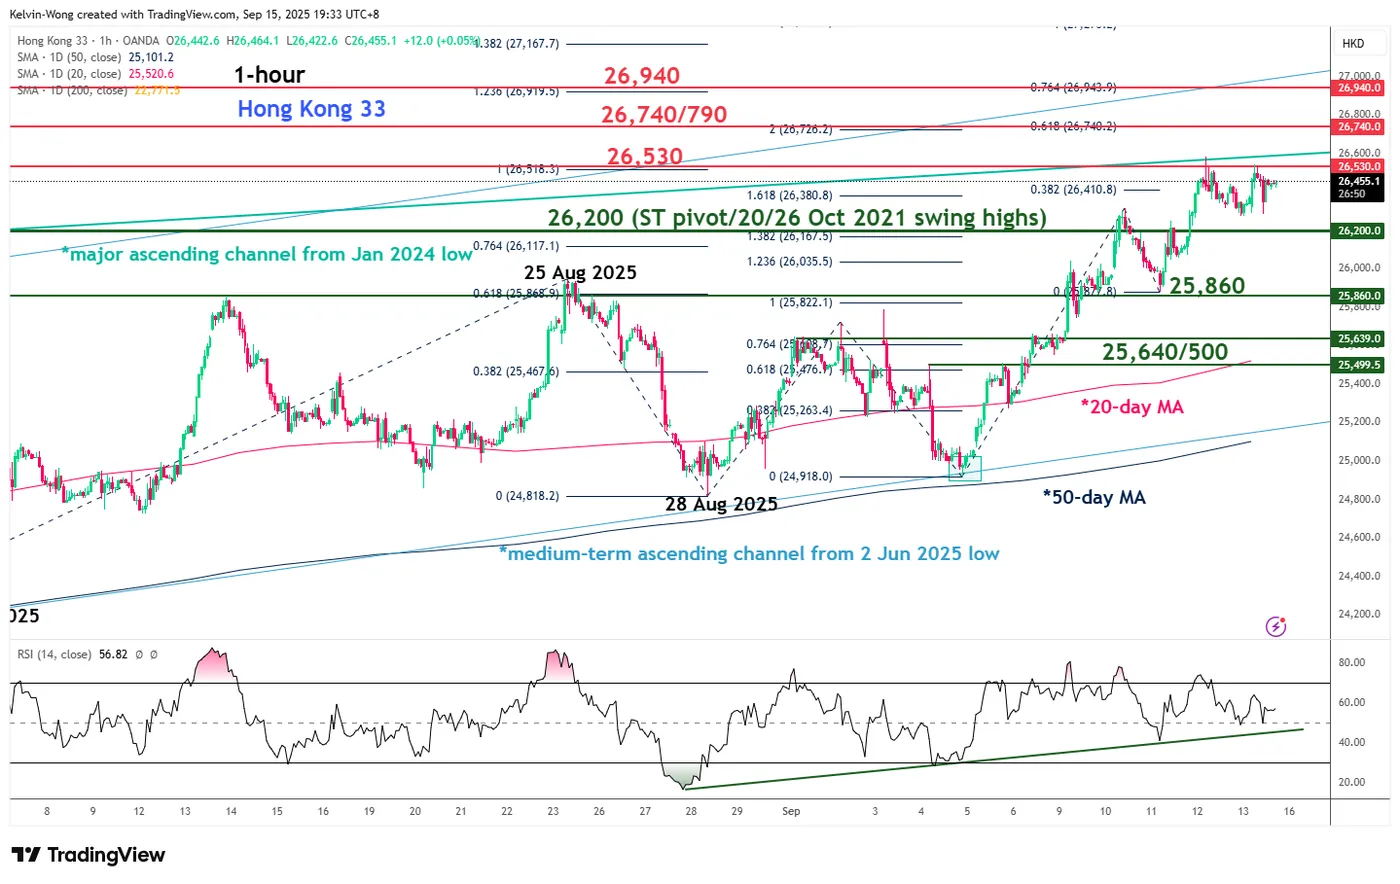
Fig. 2: Hong Kong 33 CFD Index minor trend as of 15 Sep 2025 (Source: TradingView)
Preferred trend bias (1-3 days)
Bullish consolidation above adjusted key short-term pivotal support at 26,200. The minor bullish impulsive up move sequence of the Hong Kong 33 CFD Index remains intact.
A clearance above 26,530 sees the next intermediate resistances coming in at 26,740/26,790 and 26,940 (also a Fibonacci extension cluster) (see Fig. 2).
Key elements
- The upper boundary of the medium-term ascending channel in place since 2 June 2025, now stands at 26,940.
- The 1-hour RSI momentum indicator remains above its ascending support at around the 50 level.
Alternative trend bias (1 to 3 days)
Failure to hold at the 26,200 key short-term support negates the bullish tone on the Hong Kong 33 CFD Index for a deeper minor corrective decline to materialise and retest the former “Ascending Triangle” range resistance, now turns medium-term pull-back support at 25,860.
USD/JPY Mid-Day Outlook
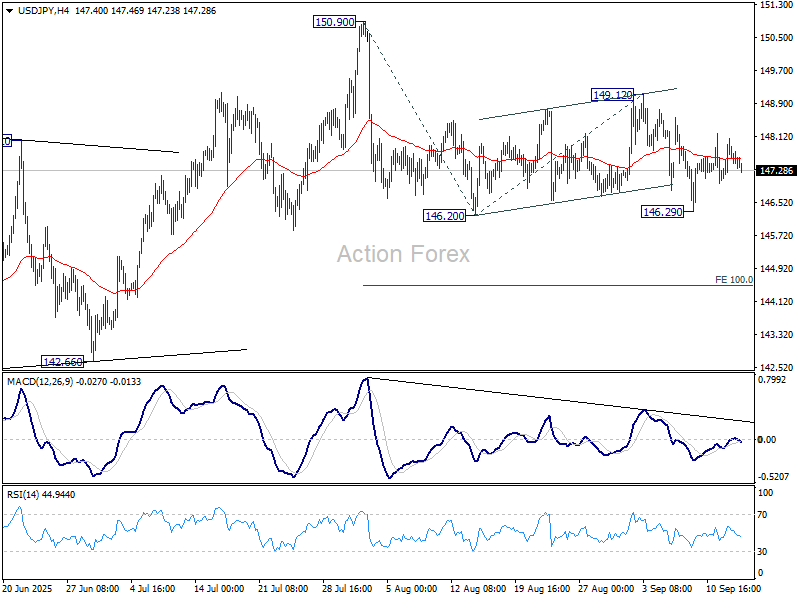
Daily Pivots: (S1) 146.75; (P) 147.47; (R1) 147.94; More...
Intraday bias in USD/JPY remains neutral and outlook is unchanged. More consolidations could be seen first. Further fall is in favor as long as 149.12 resistance holds. Firm break of 146.29 will solidify the case that whole rebound from 139.87 has completed with three waves up to 150.90. Deeper decline should then be seen to 100% projection of 150.90 to 146.20 from 149.12 at 144.42.
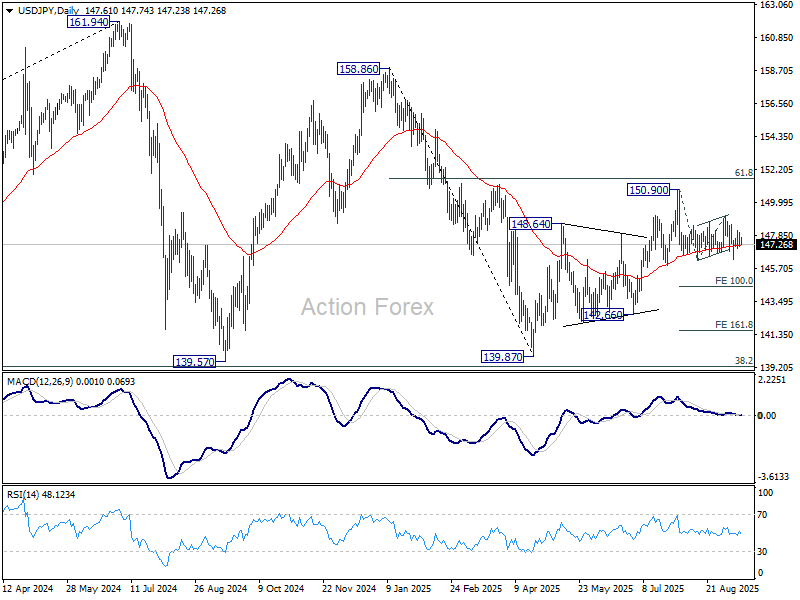
In the bigger picture, price actions from 161.94 (2024 high) are seen as a corrective pattern to rise from 102.58 (2021 low). Decisive break of 61.8% retracement of 158.86 to 139.87 at 151.22 will argue that it has already completed with three waves at 139.87. Larger up trend might then be ready to resume through 161.94 high. In case the corrective pattern extends with another fall, strong support is expected from 38.2% retracement of 102.58 to 161.94 at 139.26 to bring rebound.
USD/CHF Mid-Day Outlook
Daily Pivots: (S1) 0.7948; (P) 0.7967; (R1) 0.7983; More….
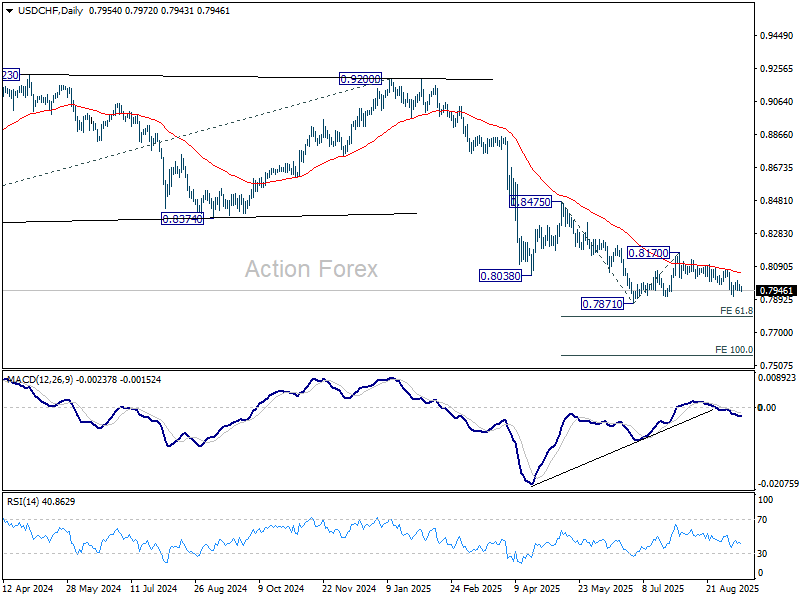
USD/CHF dips mildly today but stays above 0.7914 temporary low. Intraday bias remains neutral for the moment. Further fall is expected as long as 0.8071 resistance holds. Below 0.7914 will bring retest of 0.7871 low. Decisive break there will resume larger down trend to 61.8% projection of 0.8475 to 0.7871 from 0.8170 at 0.7797.
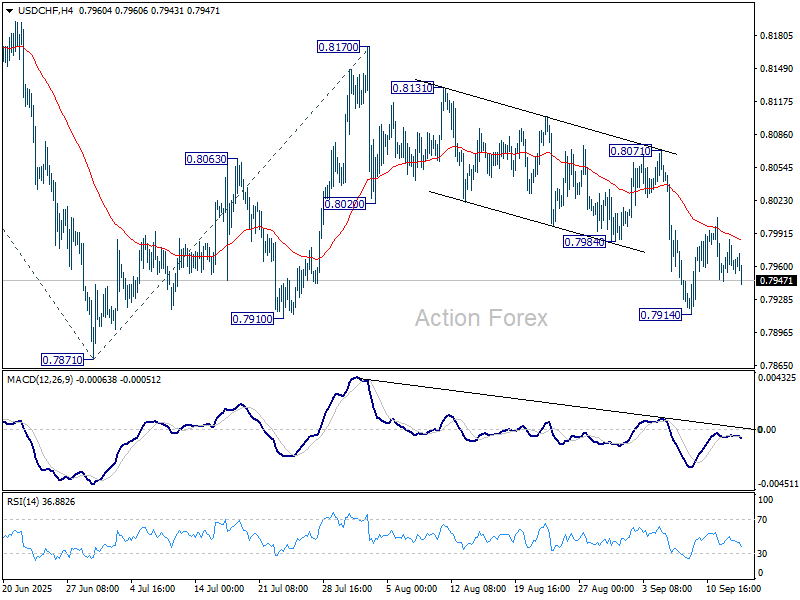
In the bigger picture, long term down trend from 1.0342 (2017 high) is still in progress. Next target is 100% projection of 1.0146 (2022 high) to 0.8332 from 0.9200 at 0.7382. In any case, outlook will stay bearish as long as 0.8332 support turned resistance holds.
EUR/USD Mid-Day Outlook
Daily Pivots: (S1) 1.1709; (P) 1.1728; (R1) 1.1756; More...
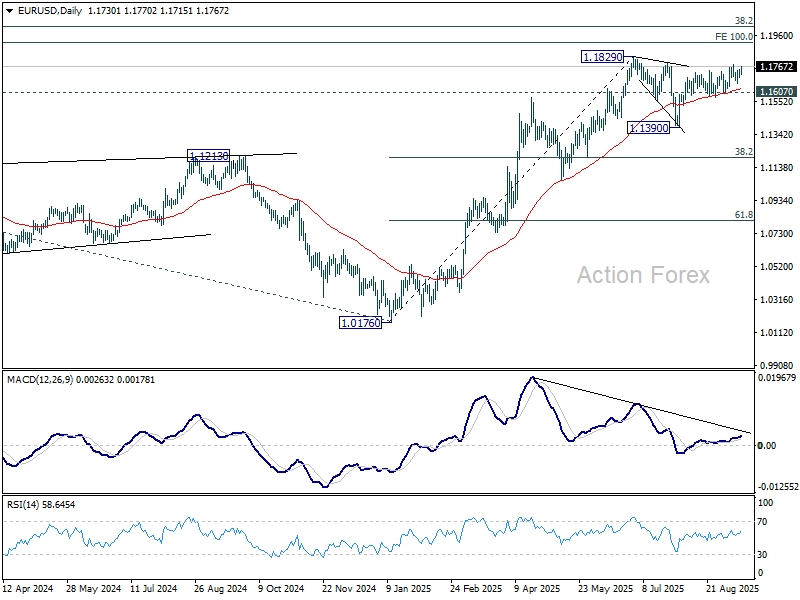
EUR/USD rebounded today but stays below 1.1779 temporary and intraday bias stays neutral. With 1.1607 support intact, further rise is expected. On the upside, above 1.1779 will target a retest of 1.1829 high. Firm break there will resume larger up trend to 1.1916 projection level next.
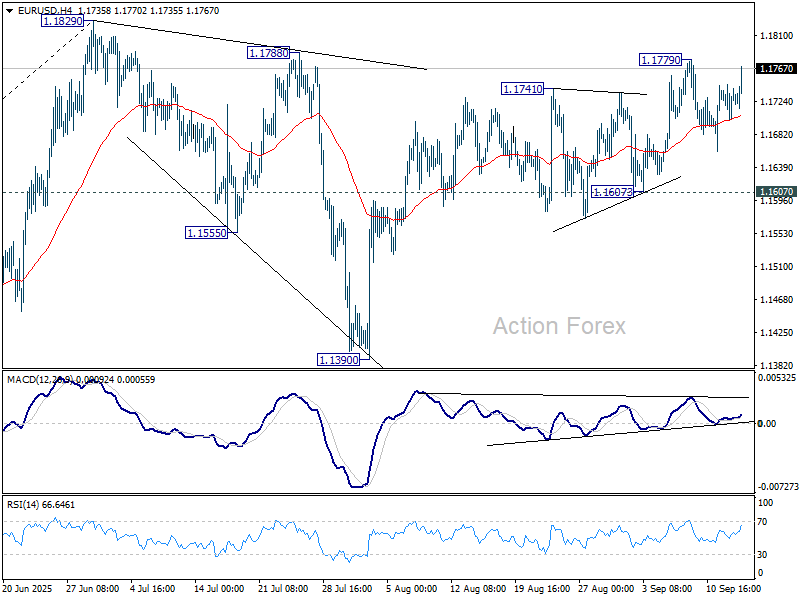
In the bigger picture, rise from 0.9534 (2022 low) long term bottom could be correcting the multi-decade downtrend or the start of a long term up trend. In either case, further rise should be seen to 100% projection of 0.9534 to 1.1274 from 1.0176 at 1.1916. This will remain the favored case as long as 55 W EMA (now at 1.1215) holds.
GBP/USD Mid-Day Outlook
Daily Pivots: (S1) 1.3530; (P) 1.3556; (R1) 1.3587; More...
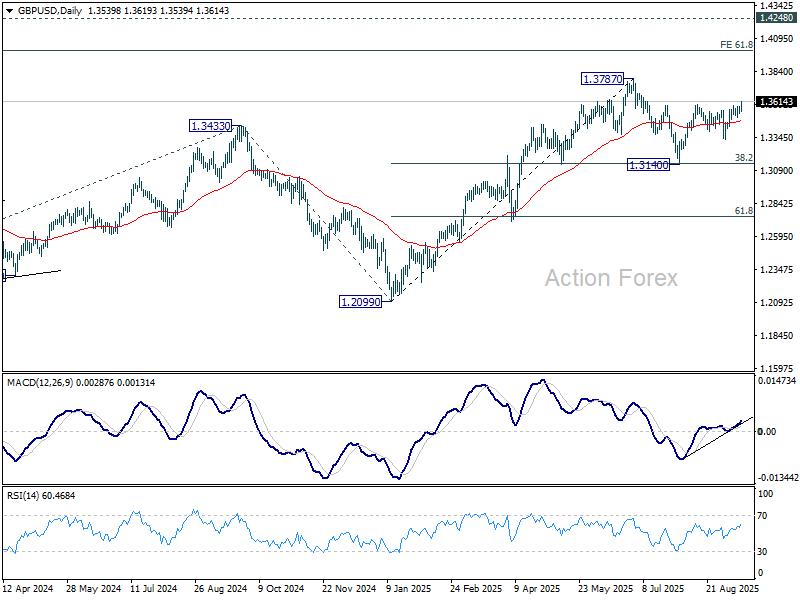
GBP/USD's rally from 1.3140 resumed by breaking through 1.3594 and intraday bias is back on the upside. Further rise should be seen to retest 1.3787 high. Decisive break there will resume larger up trend to 1.4004 projection level. On the downside, below 1.3523 support will turn intraday bias neutral again first.
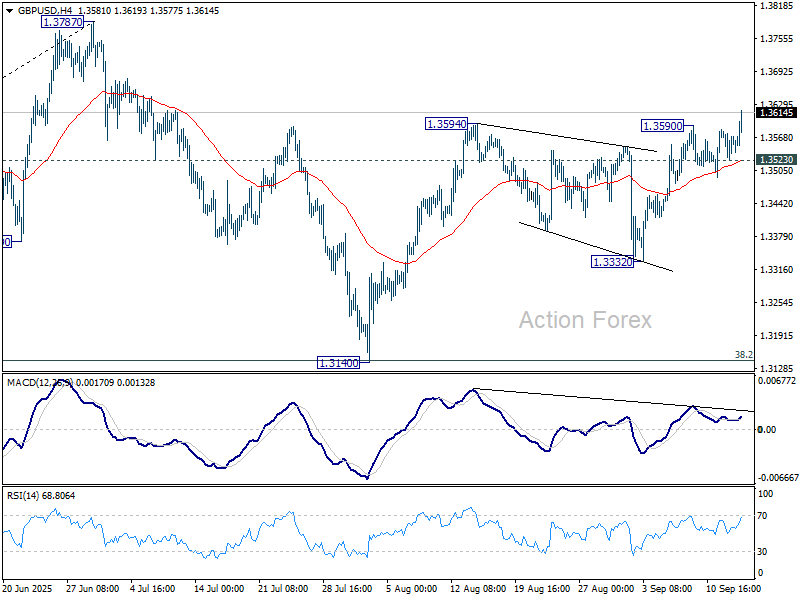
In the bigger picture, up trend from 1.3051 (2022 low) is in progress. Next medium term target is 61.8% projection of 1.0351 to 1.3433 from 1.2099 at 1.4004. Outlook will now stay bullish as long as 55 W EMA (now at 1.3151) holds, even in case of deep pullback.
Dollar Slump Resumes as Traders Bet on Dovish Fed, Euro Shrugs Off France Downgrade
Dollar’s broad-based selloff resumed today, with Sterling and the Euro leading gains. Investors are positioning ahead of this week’s pivotal FOMC meeting, where debate has intensified over whether the central bank could move more aggressively than expected. Dollar was the weakest major on the day, with the Kiwi also under pressure, while other currencies traded mixed.
Market chatter intensified after Societe Generale joined Standard Chartered in forecasting a 50bps Fed cut at this week’s meeting. That view contrasts with the futures market, which is pricing only around a 4% chance of such a jumbo move. More modestly, traders still see near certainty of consecutive 25bps cuts through year-end. Economists, however, broadly agree that the Fed has ground to make up, and that an aggressive easing cycle is firmly underway.
That theme is overshadowing regional developments in Europe, where Fitch downgraded France’s sovereign rating to AA- last Friday. The move, prompted by a rising debt burden, had little impact on sentiment as the Euro shrugged off the news and extended gains.
On the trade front, U.S.–China negotiations entered a second day in Spain, with Treasury Secretary Scott Bessent noting “good progress” on technical details and saying the sides were close to an agreement on TikTok. But he stressed Washington would not sacrifice national security for the sake of a social media app. Chinese officials, for their part, offered little detail.
Yet, tensions flared as Beijing launched a preliminary anti-monopoly probe into U.S. chipmaker Nvidia and denounced Trump’s push for the EU to impose secondary tariffs on China over Russian oil. China’s Commerce Ministry called the request “unilateral bullying” and vowed to take “any necessary measure” to defend its interests.
In Europe, at the time of writing, FTSE is up 0.03%. DAX is up 0.59%. CAC is up 1.35%. UK 10-year yield is down -0.032 at 4.644. Germany 10-year yield is down -0.012 at 2.704. Earlier in Asia, Nikkei rose 0.89%. Hong Kong HSI rose 0.22%. China Shanghai SSE fell -0.26%. Singapore Strait Times fell -0.13%. Japan 10-year JGB yield closed flat at 1.602.
ECB’s Schnabel: Rates in a good place, policy should keep steady hand
ECB Executive Board member Isabel Schnabel said today that interest rates are “in a good place” as inflation stabilizes near the 2% target and the Eurozone economy shows resilience at full employment. She cited strong household and corporate balance sheets, reduced uncertainty, and fiscal expansion as key supports to domestic demand, offsetting the drag from weaker net exports.
Schnabel downplayed concerns over Chinese export dumping, noting little evidence so far, and argued that the inflationary pass-through from a stronger Euro is likely to remain "limited".
In her view, "upside risks to inflation dominate", with tariffs, sticky services and food prices, and expansionary fiscal policy among the potential drivers.
Given these conditions, Schnabel said monetary policy should “keep a steady hand,” tolerating moderate deviations from target while guarding against persistent upside risks.
Eurozone posts EUR 12.4B trade surplus, EU faces export weakness to US, China
Eurozone trade data were stable in July, with exports edging up 0.4% yoy to EUR 251.5B while imports rose 3.1% yoy to EUR 239.1B. That produced a EUR 12.4B surplus. Intra-Eurozone trade grew 1.9% yoy to EUR 226.1B. The numbers reflect the bloc’s continued reliance on internal demand to cushion against weaker global flows.
The EU as a whole painted a softer picture, with exports down -0.5% yoy to EUR 227.7B against imports up 1.2% yoy to EUR 215.6B. The resulting EUR 12.1B surplus was still positive but underscored the relative drag from external markets. Intra-EU trade proved firmer, rising 2.9% yoy to EUR 349.2B.
Bilateral trends showed notable divergences. EU exports to the US fell -4.4% yoy and to China -6.6% yoy, underscoring pressure from global trade frictions. By contrast, exports to the UK rose 2.9% yoy and to Switzerland surged 9.4% yoy. On the import side, flows to the EU from the US jumped 10.7% yoy, from China rose 3.9% yoy, from Switzerland 6.8% yoy, and from the UK a modest 0.6% yoy.
NZ services PMI slumps to 47.5, 18th month contraction
New Zealand’s services sector deteriorated further in August, with BusinessNZ Performance of Services Index slipping from 48.9 to 47.5, well below the long-run average of 52.9. The reading also marks the 18th consecutive month of contraction. Both
Activity/Sales (46.2) and New Orders/Business (47.8) weakened, suggesting demand remains fragile. Employment improved slightly to 48.3 but remains in contraction territory, reflecting businesses’ reluctance to expand payrolls in the face of subdued activity.
The survey showed 59.6% of respondents made negative comments in August, an increase from July but still less pessimistic than June’s tally. Firms cited multiple pressures, including high interest rates, sticky inflation, and the cost-of-living squeeze eroding household spending. Rising operating costs, seasonal slowdowns, supply chain disruptions, and uncertainty over government policy also weighed on sentiment.
China industrial output, retail sales miss forecasts, fixed asset investment slumps
China’s economy slowed in August, with key indicators falling short of expectations. Industrial output grew 5.2% yoy, down from 5.7% yoy in July and short of forecasts for 5.8% yoy, marking its weakest pace since August 2024. Retail sales also slowed, rising just 3.4% yoy versus 3.7% yoy previously and expectations of 3.8% yoy, signaling soft household demand despite ongoing government measures to support spending.
Investment activity showed the sharpest loss of momentum. Year-to-date fixed asset investment rose only 0.5%, far weaker than consensus 1.4% and July’s 1.6%. The drag came primarily from the property sector, where real estate investment plunged -12.9% in the first eight months. Excluding real estate, investment rose 4.2%.
The National Bureau of Statistics highlighted “many unstable and uncertain factors” in the global environment and warned that the economy still faces “multiple risks and challenges.” It urged stronger policy implementation to stabilize employment, businesses, and expectations, but the latest figures suggest momentum remains fragile, with property weakness continuing to weigh heavily on growth prospects.
GBP/USD Mid-Day Outlook
Daily Pivots: (S1) 1.3530; (P) 1.3556; (R1) 1.3587; More...
GBP/USD's rally from 1.3140 resumed by breaking through 1.3594 and intraday bias is back on the upside. Further rise should be seen to retest 1.3787 high. Decisive break there will resume larger up trend to 1.4004 projection level. On the downside, below 1.3523 support will turn intraday bias neutral again first.
In the bigger picture, up trend from 1.3051 (2022 low) is in progress. Next medium term target is 61.8% projection of 1.0351 to 1.3433 from 1.2099 at 1.4004. Outlook will now stay bullish as long as 55 W EMA (now at 1.3151) holds, even in case of deep pullback.
ECB’s Schnabel: Rates in a good place, policy should keep steady hand
ECB Executive Board member Isabel Schnabel said today that interest rates are “in a good place” as inflation stabilizes near the 2% target and the Eurozone economy shows resilience at full employment. She cited strong household and corporate balance sheets, reduced uncertainty, and fiscal expansion as key supports to domestic demand, offsetting the drag from weaker net exports.
Schnabel downplayed concerns over Chinese export dumping, noting little evidence so far, and argued that the inflationary pass-through from a stronger Euro is likely to remain "limited".
In her view, "upside risks to inflation dominate", with tariffs, sticky services and food prices, and expansionary fiscal policy among the potential drivers.
Given these conditions, Schnabel said monetary policy should “keep a steady hand,” tolerating moderate deviations from target while guarding against persistent upside risks.
Will Gold Sell the Fed News?
- Gold holds steady near its all-time high as data favors a rate cut.
- Another bounce likely but caution warranted as overbought signals emerge.
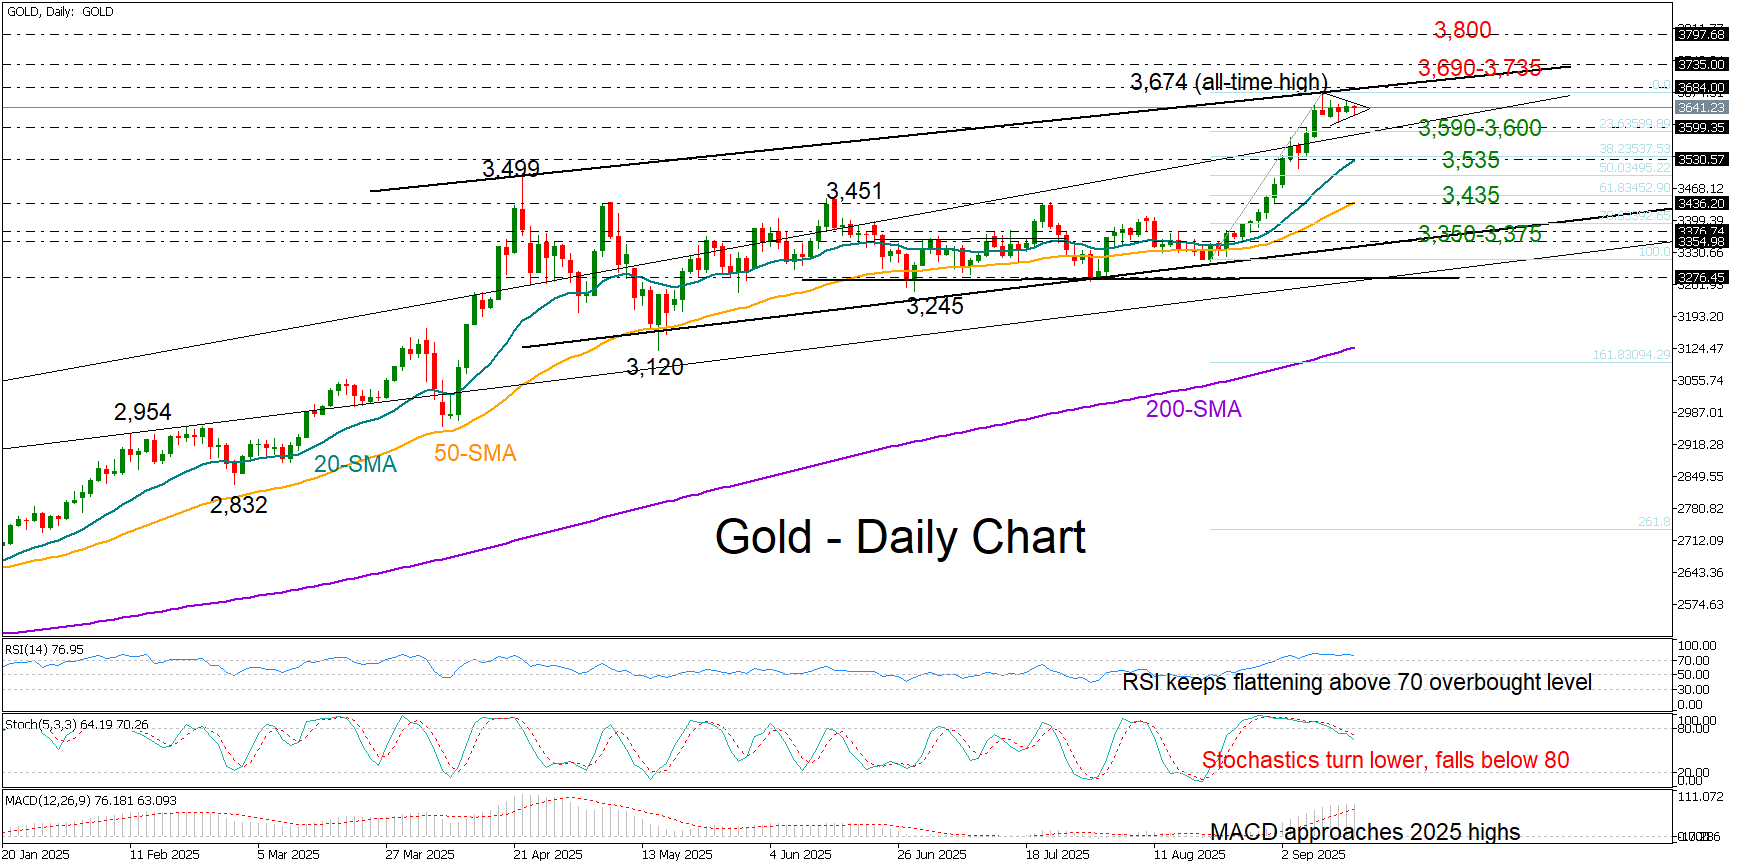
Gold started the week with quiet sideways action, hovering just below its all-time high of 3,674, reached last Tuesday. U.S. CPI inflation figures held steady at elevated levels last week, in line with expectations, but initial jobless claims surged to their highest level in two years, with President Trump placing his bets for a bold rate cut during an interview on his way to Washington on Sunday.
Whether the Fed will surprise investors with a double 50bps reduction on Wednesday remains uncertain, as futures markets still assign low odds. A more aggressive cut, accompanied by dovish guidance signaling further back-to-back easing, could ignite the next bullish cycle in the precious metal, bringing the 3,690–3,735 zone into play. The 3,800 round number could follow, and a breakout there might pave the way toward the psychological 3,900 level and eventually the all-important 4,000 mark.
The tiny candlesticks that emerged after the almost vertical rally could be just a pause in the uptrend, though there are some concerns that the path higher could become rocky as overbought signals are still in place. The latter increases speculation that investors may engage in profit-taking and sell the Fed news near fresh record highs. Should prices slip below 3,590–3,600, the 20-day simple moving average (SMA) at 3,530 and the 3,500 support level could step in. Failure to hold there could deepen the sell-off toward the 50-day SMA at 3,435, which also coincides with the upper band of the previous sideways range.
In summary, gold’s short horizontal consolidation could evolve into a fresh bullish wave, potentially challenging the 3,690–3,735 area. Yet, whether the bulls can sustain a steeper rally remains to be seen. Alternatively, a close below 3,590–3,600 could hand control back to the bears.
AUD/USD: Bulls Hold Grip, Fed Expected to Provide Fresh Positive Signal
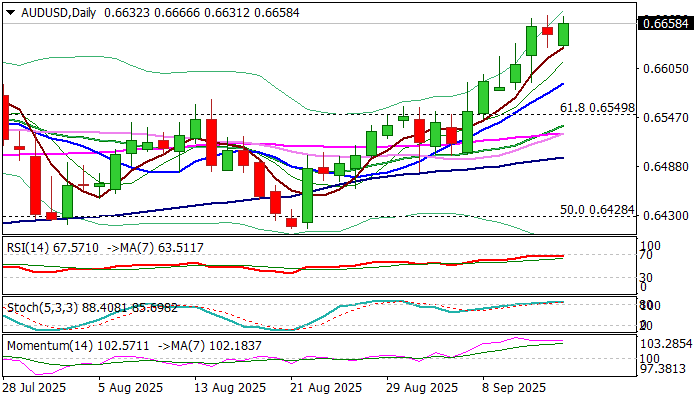
AUDUSD keeps firm tone and trades just under new 2025 high (0.6668) on Monday, in attempts to extend last week’s 1.4% advance (the biggest weekly gain since the third week of June).
Aussie dollar enjoyed strong support from weaker US dollar, anticipating Fed’s 25 basis points rate cut this week, with markets focusing on comments from Fed chief Powell which could provide more details about the central bank’s actions in coming months.
Bulls may accelerate if Fed keeps firm dovish stance, as markets started to speculate about possible 50 basis points cut and see potential for total cuts of 1% by early 2026.
Immediate barrier lays at 0.6675 (falling 200WMA), followed by 0.6700 (round figure / Fibo 76.4% of 0.6942/0.5914), violation of which to expose peaks of July/Aug 2024 at 0.6798 and 0.6823 respectively.
Technical picture on daily chart is firmly bullish, with the latest positive signal on formation of 20/55DMA bull-cross, additionally underpinning the action.
However, bulls may stay on hold for some time as daily stochastic is overbought and markets slowed the pace ahead of key decisions and signals from Fed.
Daily higher base at 0.6630 (lows on today / last Friday) and July 24 peak (0.6625) mark immediate supports, followed by rising 10DMA (0.6587) which should keep the downside protected.
Res: 0.6675; 0.6700; 0.6798; 0.6823.
Sup: 0.6625; 0.6600; 0.6587; 0.6650.
Crypto Market Hesitant to Rewrite Highs Until FOMC
Market Overview
The crypto market cap reached $4.09 trillion over the weekend, approaching the peak levels set a month earlier. The initial impetus came from positive dynamics in the US stock market on Friday, thanks to technology sector stocks. However, retail traders used the moment to take profits in BTC and major altcoins, except for Solana, which went down on Monday. As a result, the market level fell back to $4.05 trillion.
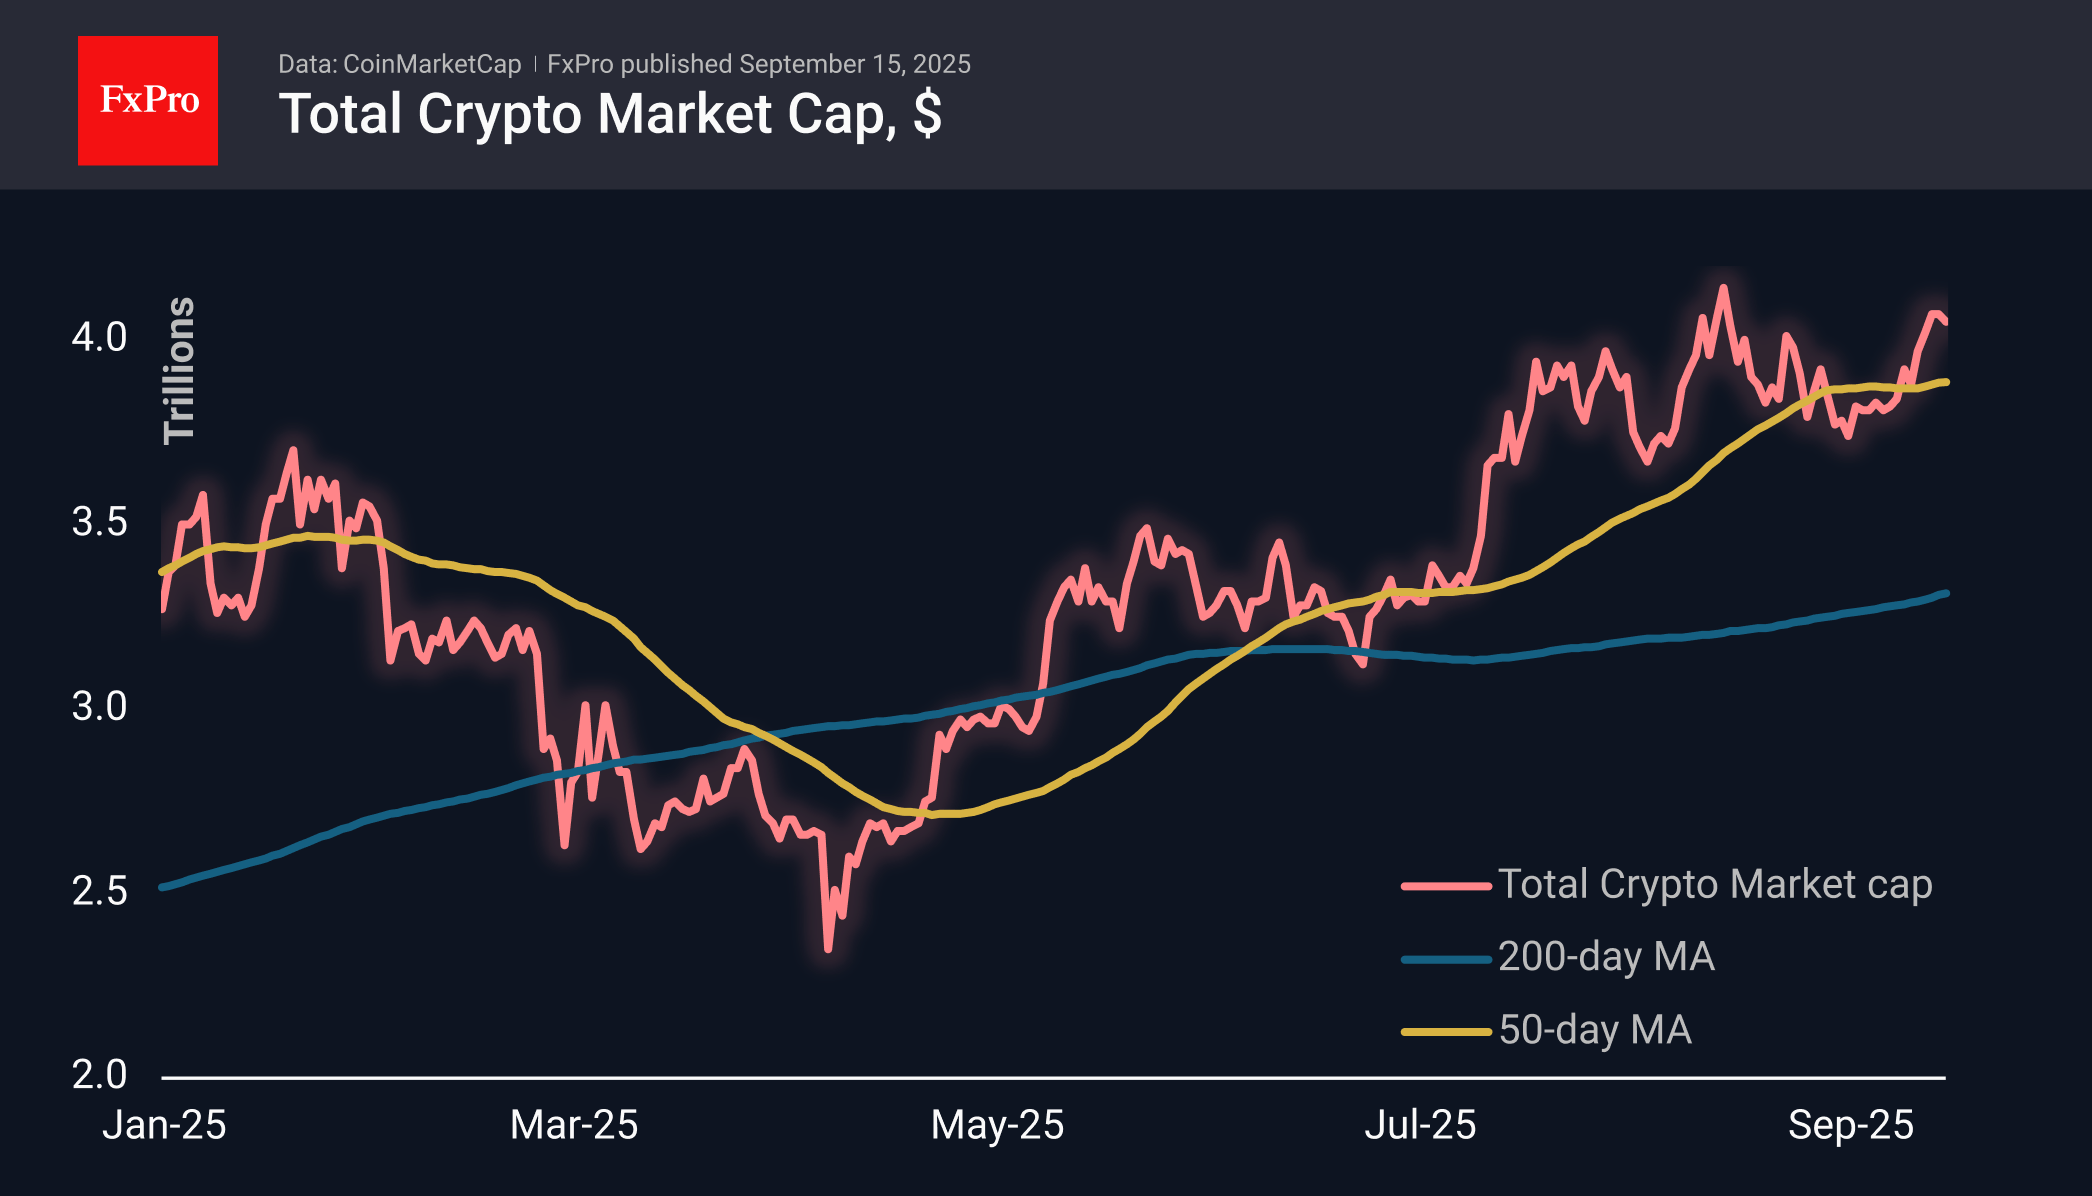
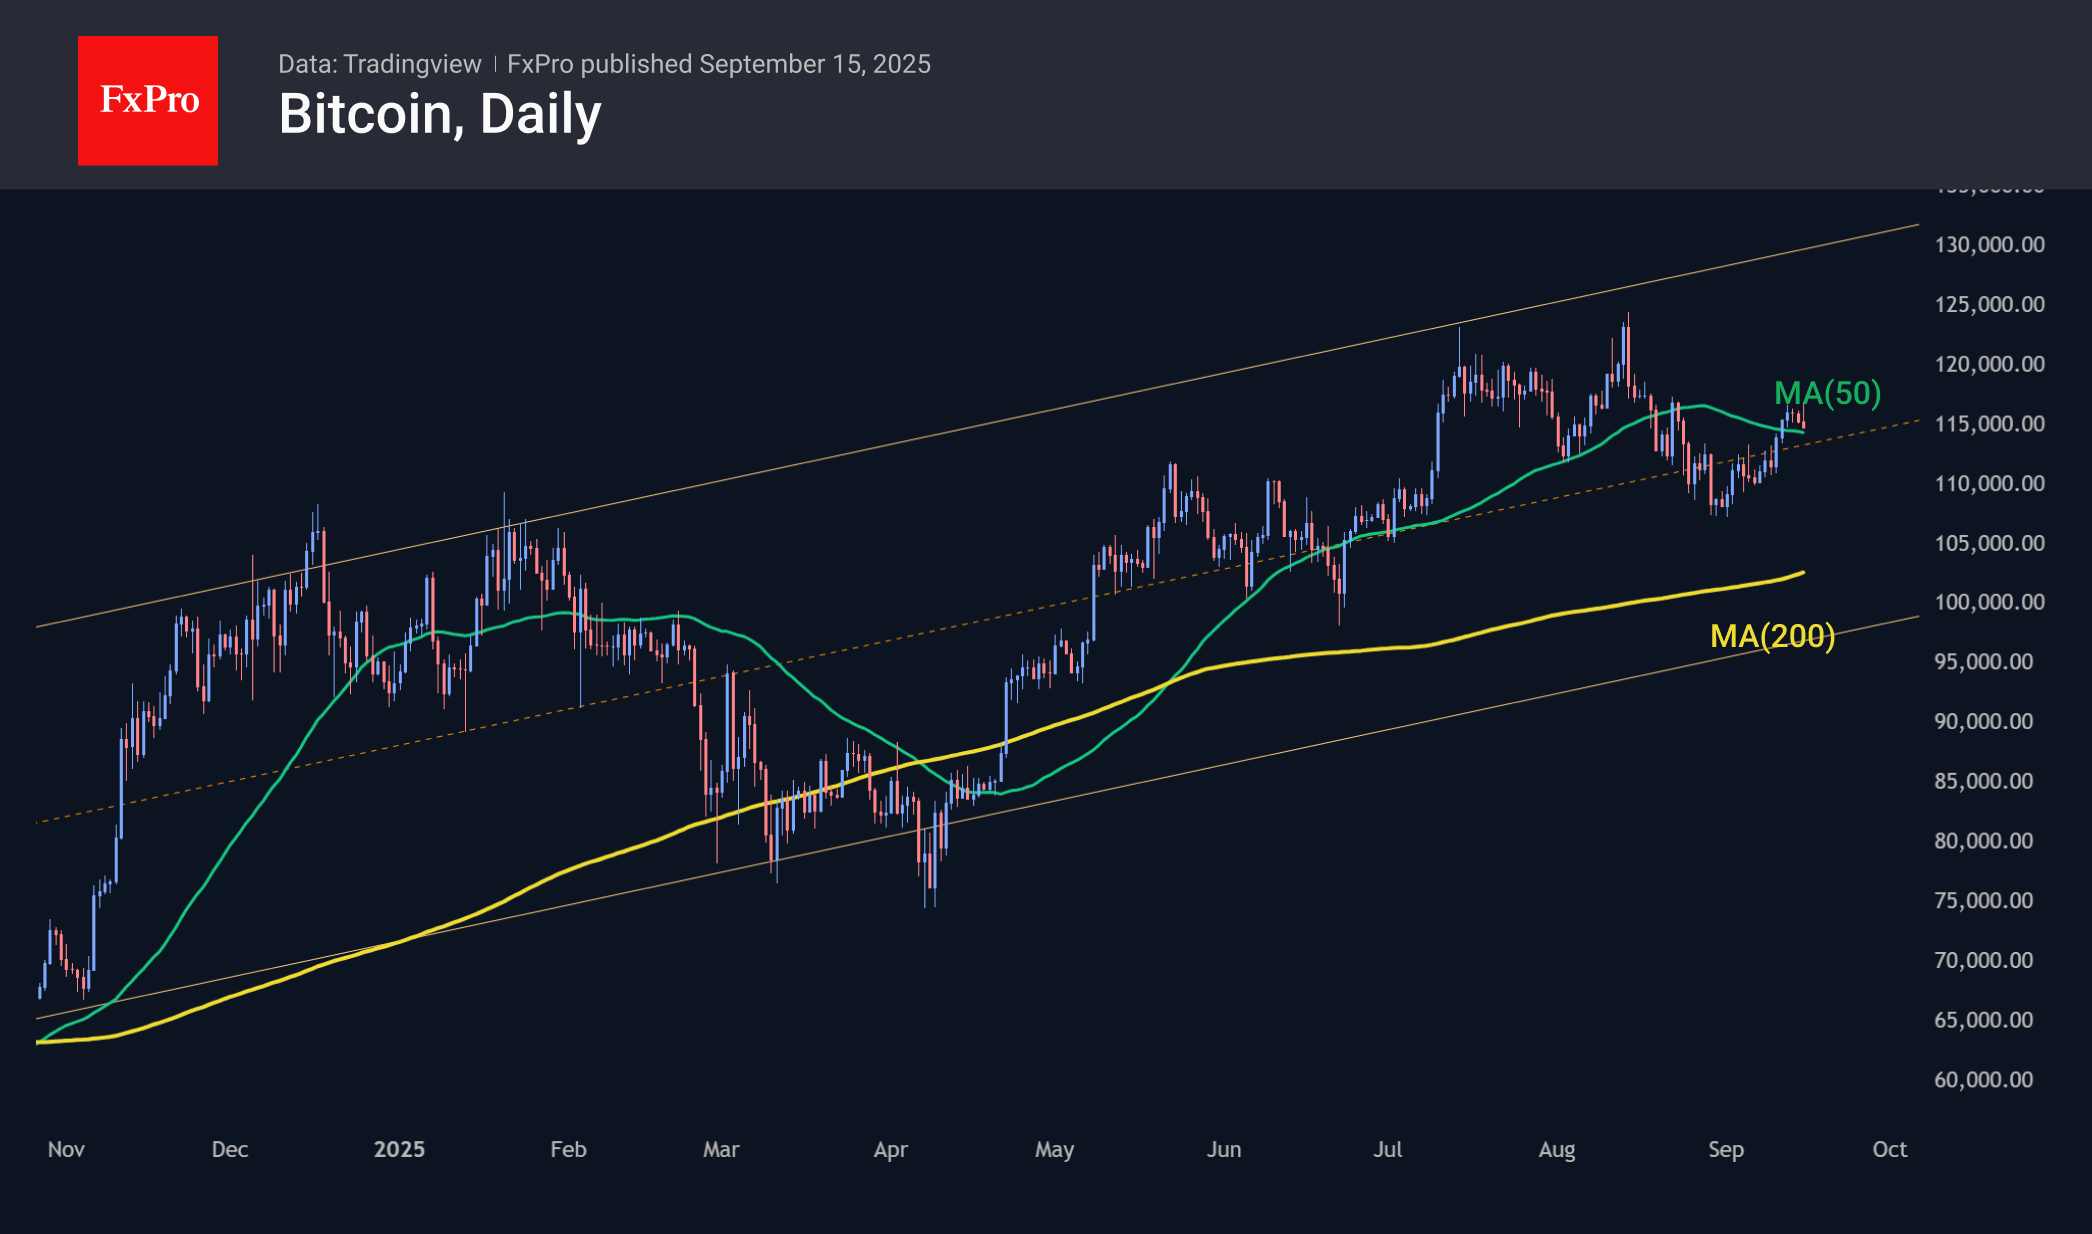
Bitcoin ran into resistance at $116K, but the sell-off is drying up as it approaches $114K, turning the 50-day moving average back into a support line. It seems that Bitcoin has found a temporary balance until the FOMC meeting results are announced. A quarter-point cut is already clearly priced in, but the driver will be the tone of comments regarding the Fed’s future actions. A willingness to further cut rates in the foreseeable future could inspire BTC to march toward new all-time highs.
News Background
According to SoSoValue, net weekly inflows into spot BTC ETFs jumped nearly 10-fold to $2.34 billion, the highest since mid-July. Total inflows since the approval of Bitcoin ETFs in January 2024 have increased to $56.83 billion. On Wednesday, the indicator recouped all of the previous week’s losses.
Inflows into spot Ethereum ETFs in the US resumed last week, amounting to $637.7 million, offsetting 80% of the previous week’s outflows. The cumulative net inflow since the ETF’s launch in July 2024 has grown to $13.36 billion.
Investors should give up hope of quick profits from their investments in the first cryptocurrency, said BitMEX founder Arthur Hayes. In his opinion, Bitcoin was created to protect against inflation, not to make a profit here and now.
The US SEC has postponed its decision on applications from BlackRock, Fidelity, and Franklin Templeton, which wanted to add a staking feature to their spot Ethereum ETFs until the end of October or November.
According to Galaxy Digital CEO Mike Novogratz, the crypto industry has entered the “Solana season.” A key factor was Forward Industries’ launch of the largest SOL treasury, worth $1.6 billion. Against this background, Galaxy Digital purchased 2.31 million SOL worth $536 million for its reserves.
The Winklevoss brothers’ Gemini crypto exchange raised $425 million during its IPO. The event caused a stir among investors, creating more than 20 times oversubscription for the shares.
Tether introduced the USAT stablecoin for the US market. It is backed by dollars and fully compliant with US regulations. The stablecoin will use Tether’s Hadron RWA platform technology.