
Sample Category Title
USD/JPY Declines: Yen Gains Safe-Haven Appeal
The USD/JPY pair fell for a second consecutive session on Tuesday, with the Japanese yen strengthening to around 147.19 JPY per US dollar. The move reflects broad-based USD weakness and growing expectations of imminent Federal Reserve rate cuts.
Markets are now pricing in a 25-basis-point cut from the Fed this week, with a total of 67 basis points’ easing anticipated through the remainder of the year. These expectations are reinforced by recent data pointing to a cooling labour market and moderating inflation.
The Bank of Japan is also set to meet this week and is widely expected to hold rates steady at 0.5%. Meanwhile, policymakers will need to evaluate the potential impact of US tariff policies on Japan’s export-dependent economy.
Upcoming economic releases are likely to show continued softness: both exports and imports are forecast to remain weak, while core CPI is expected to slow to 2.7% – the lowest level since November 2024.
Amid elevated global volatility, the yen is demonstrating relative strength, underscoring its role as a safe-haven asset.
Technical Analysis: USD/JPY
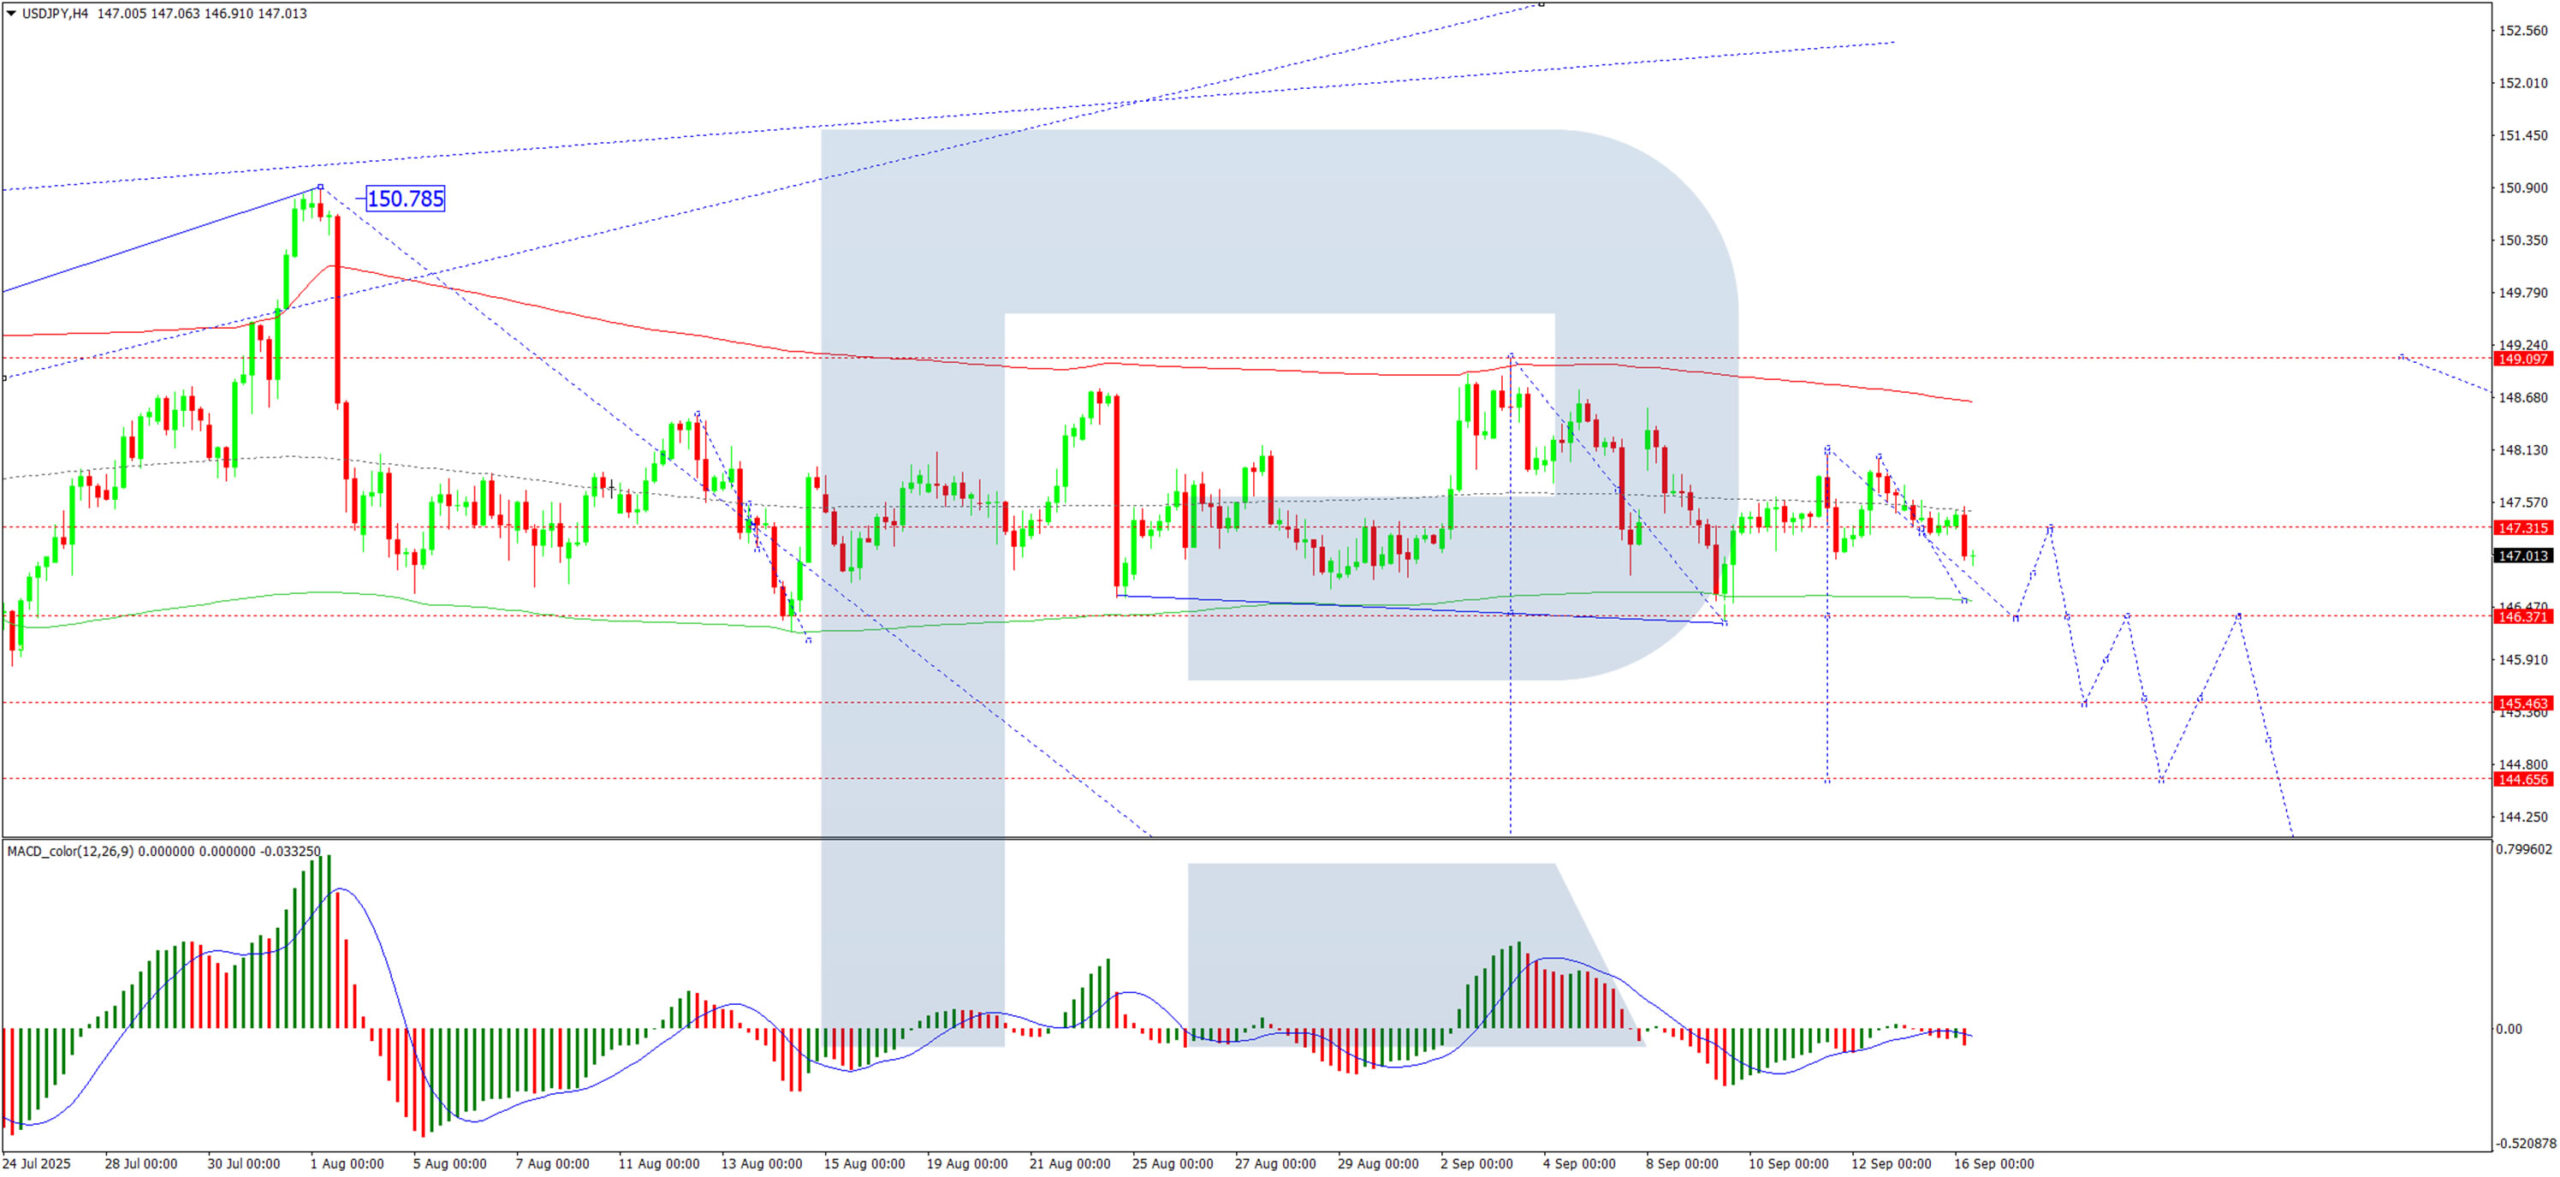
H4 Chart:
On the H4 chart, USD/JPY continues to trade within a consolidation range centred around 147.33 JPY, with recent extensions towards 148.14 JPY on the upside and 146.90 JPY on the downside. A further decline towards 146.30 JPY is possible. Should this level be reached, a corrective bounce towards 147.33 JPY may occur before another leg down towards 145.30 JPY. The MACD indicator supports this bearish outlook, with its signal line positioned below zero and pointing firmly downward.
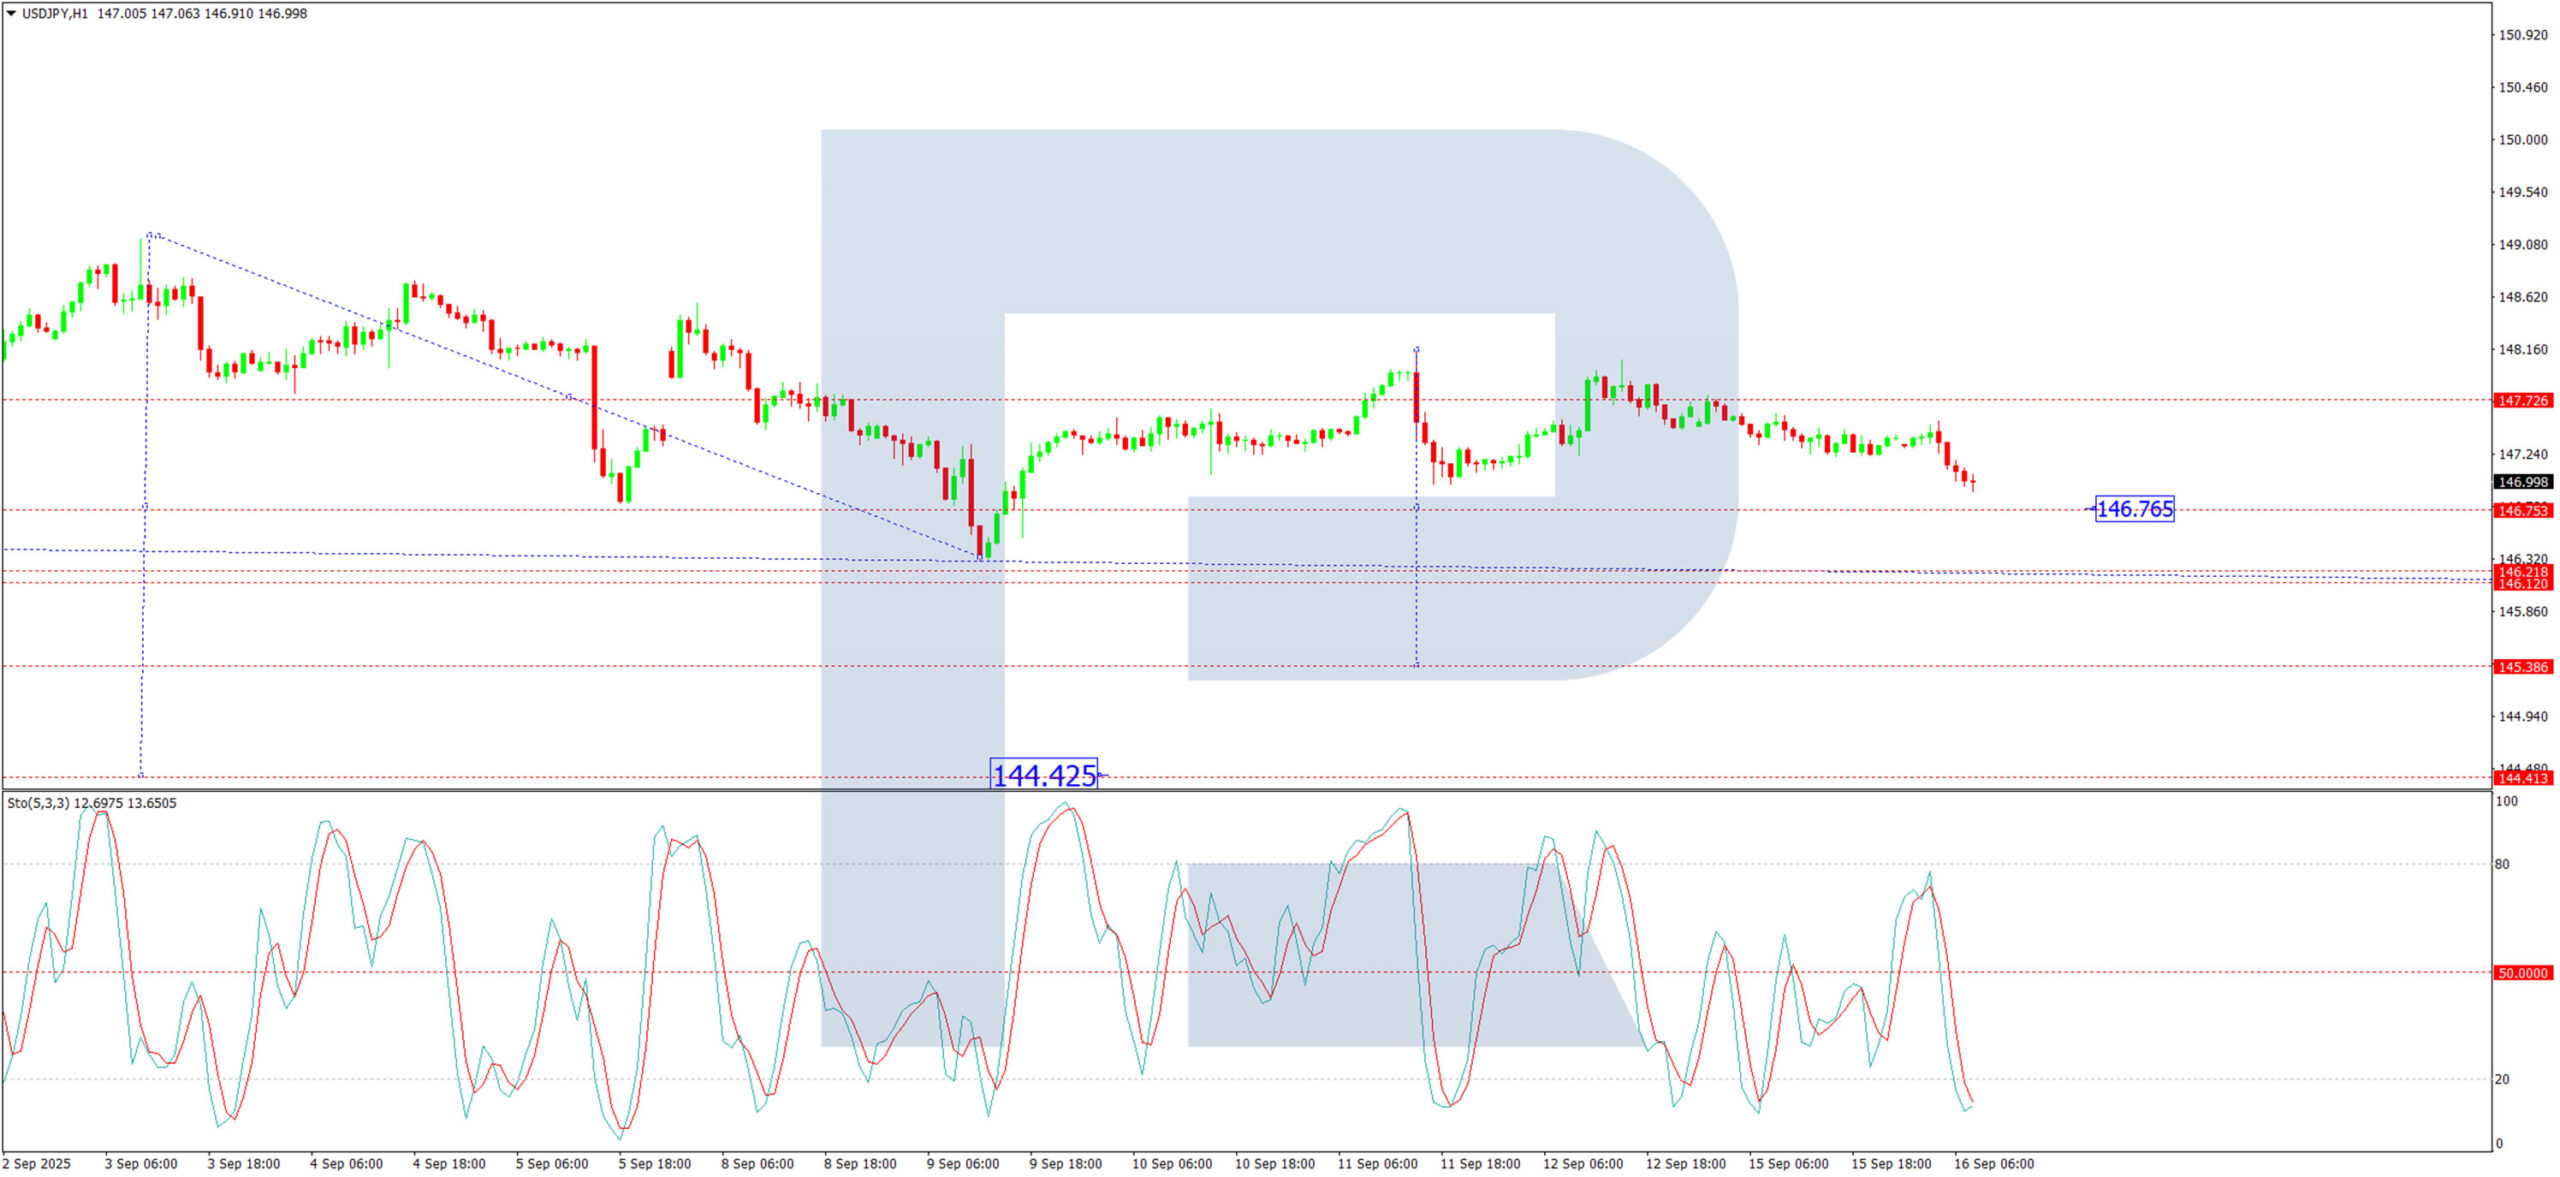
H1 Chart:
On the H1 chart, the pair is following a clear downward move structure towards 146.76 JPY. The market has broken below its recent consolidation range, confirming the bearish momentum. Further declines towards 146.76 JPY are expected, with an extension towards 144.44 JPY likely. The Stochastic oscillator aligns with this view, as its signal line remains below 50 and is trending downward towards 20, reflecting strengthening selling pressure.
Conclusion
The yen is strengthening amid broad USD softness and safe-haven demand, with all eyes on this week’s Fed and BoJ meetings. While the BoJ is likely to remain on hold, the Fed’s dovish shift could further weigh on USD/JPY in the near term. Technically, the pair exhibits clear bearish momentum, with key support levels in focus. A break below 146.30 JPY may accelerate the decline towards deeper supports.
GBP/USD Rate at 2-Month High
As the GBP/USD chart shows, the pair is trading this morning above 1.3620 – its highest level since the beginning of July.
The bullish sentiment is driven by the divergence in central bank policies:
→ United States: Traders are betting on an interest rate cut, supported by President Trump. The Federal Reserve will announce its decision tomorrow at 21:00 GMT+3, and the market expects a reduction of at least 0.25%, from 4.25%–4.50% to 4.00%–4.25%.
→ United Kingdom: Traders anticipate the rate will remain at 4.00%. The Bank of England will announce its decision on Thursday at 14:00 GMT+3.
Although the rates of the two central banks are comparable, the situation differs: in the UK, inflation is more persistent and rate cuts are seen as risky, while in the US, President Trump is exerting pressure on the Fed’s leadership.
An additional boost for the pound comes from a wave of investment optimism linked to US President Donald Trump’s state visit to the UK. According to media reports, agreements worth around $10 billion are expected to be announced during the visit.
GBP/USD Technical Analysis
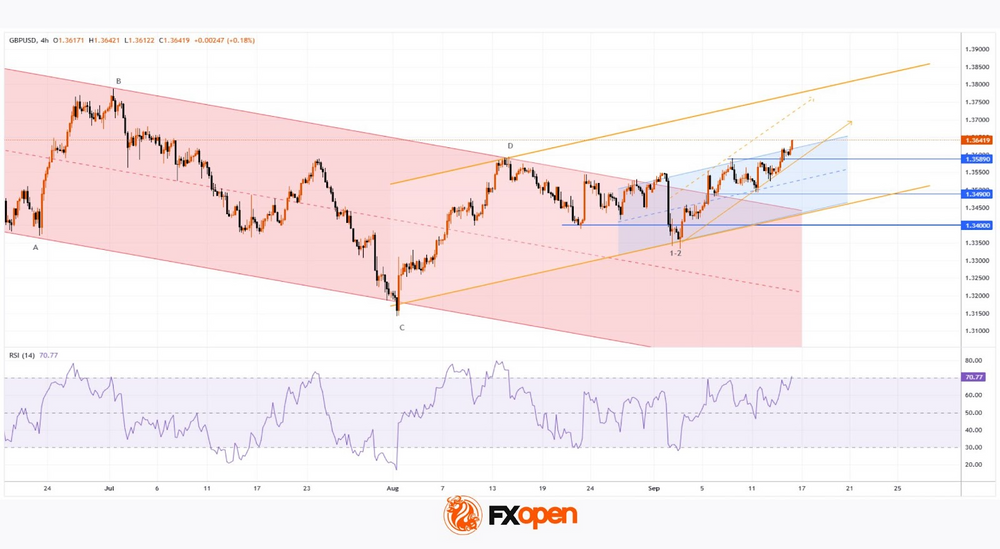
Looking at the price movements earlier this month, we noted lower highs and lower lows forming a bearish A→B→C→D structure. We also assumed that:
→ bulls could rely on support at the psychological level of 1.3400;
→ but if bearish pressure intensified, GBP/USD could fall towards the median of the descending channel.
Since then, the situation has changed considerably: bears failed to consolidate below 1.3400, and after a bullish double bottom pattern (1–2) formed, the price surged upwards.
At the same time, the GBP/USD chart highlights key signs of strong demand:
→ the descending (red) channel has been broken, and the bearish A→B→C→D structure is no longer relevant;
→ higher highs and higher lows confirm buyer dominance – providing grounds to outline a rising (blue) channel.
On the other hand, the RSI indicator is close to overbought territory, which suggests a possible pullback.
Potential support levels:
→ 1.34900: the breakout point where bulls started their advance;
→ 1.35890: a level that lost its resistance role this week;
→ the upper boundary and median of the blue ascending channel.
Taking all this into account, we could assume that in the near term, bulls may aim to lift GBP/USD towards the upper boundary of the yellow channel. It is also possible that news from the Fed and the Bank of England will aid them on this path.
Trade over 50 forex markets 24 hours a day with FXOpen. Take advantage of low commissions, deep liquidity, and spreads from 0.0 pips. Open your FXOpen account now or learn more about trading forex with FXOpen.
This article represents the opinion of the Companies operating under the FXOpen brand only. It is not to be construed as an offer, solicitation, or recommendation with respect to products and services provided by the Companies operating under the FXOpen brand, nor is it to be considered financial advice.
UK Labour Market Data Print Close to Consensus
Markets
US Treasuries made one move yesterday, gaining slightly ground on a weak September Empire Manufacturing survey (-8.7 from 11.9 vs 5 expected). Traded volumes were low with US yields eventually losing 2 bps to 3 bps with the belly of the curve outperforming the wings. Wednesday’s FOMC decision numbs trading. The US Senate confirmed US President Trump’s economic adviser Miran in time to vote while a US appeals court ruled that Fed governor Cook can’t be fired before the Fed meeting. So both will have their say on the eventual outcome. A 25 bps rate cut is the expected outcome, but Fed Chair Powell won’t be able to avoid dissenting views. From a market point of view, guidance for the remainder of this year and for 2026 will be key as the Fed gets stuck between its dual mandate with both unemployment and inflation on the rise. We side with market consensus for this year (75 bps cumulative), but build in some caution for next year as it’s really anyone’s guess at the moment on how things will play out both on the labour market and the inflation front. The bar from a Fed point of view seems lower to respond to a further deterioration of the labour market than to sticky price pressure. US (money) markets therefore are unlikely to give up to idea of returning to or even slightly below a neutral 3% somewhere next year.
Relative calm on the bond market supported overall risk sentiment with European indices rallying up to 1% and daily changes in the US varying between +0.1% (Dow) and +0.95% (Nasdaq). EUR/USD moved from the 1.1720 area towards (and above this morning) 1.1760. Smaller, less liquid, currencies all profited from yesterday’s market setting with the Hungarian forint for example closing below EUR/HUF 390 for the first time since July of last year.
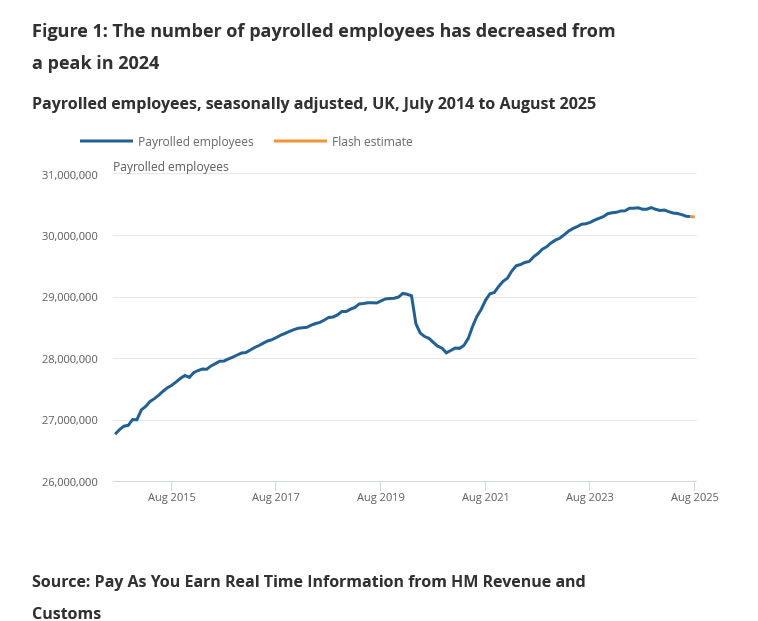
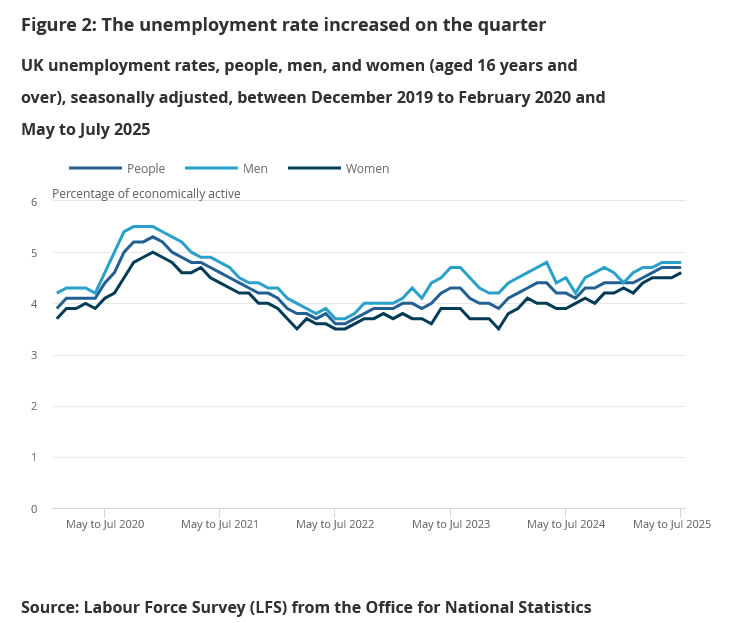
UK labour market data printed close to consensus this morning. Wage growth remains sticky at 4.7% with the unemployment rate stabilizing at 4.7% as well. Job growth was solid in July (232k 3M/3M) with August payrolls showing marginal job losses (-8k). Tomorrow’s CPI data have more market moving potential with the BoE – who meets later this week – warning for a run-up towards 4% Y/Y in September. Today’s eco calendar contains US retail sales, but the approaching FOMC meeting again serves as a “blocking condition” to trigger a big market response.
News & Views
The Bank of France (BdF) published new quarterly economic forecasts yesterday. In the current context of national political uncertainty, the projections are based on unchanged fiscal assumptions compared to the June forecast. These include a budget deficit of 5.4% this year and primary structural adjustments of 0.6% of GDP next year and 0.4% in 2027. However, BdF warns that less fiscal consolidation won’t lead to additional growth as it prolongs fiscal uncertainty. The BdF slightly upwardly revised 2025 growth from 0.6% to 0.7% due to a better carry-over from H1 growth and a better expected economic performance in Q3 (+0.3%). Growth is still seen picking up in 2026 (0.9%) and 2027 (1.1%), but at a slower pace compared to the June projections (-0.1%). The slower growth expectation for next year and 2027 is amongst other attributed to a more uncertain domestic business environment and less favorable assumptions concerning the international environment. Growth remains underpinned by stronger household consumption and a recovery in private investment. The contribution of foreign trade to growth is expected to be virtually nil over these two years.
RBA assistant governor Hunt said that the RBA is pretty close to getting inflation back to the midpoint of its 2-3% target range. At the same time Hunter assesses that the economy remains near full employment. In this context, he concludes that the RBA is ‘monitoring’ and that it hopes to ‘keep things where they are today’. Monthly CPI figures will be published next week. Q2 headline inflation was 0.7% Q/Q and 2.1% Y/Y, but the trimmed mean core measure still stood at 2.7% Y/Y. The monthly July figure unexpectedly jumped to 1.9% from 2.8% admittedly as some temporary factors were in play (electricity subsidies). The comments from Hunter today are in line with current market pricing for the RBA to keep the policy rate unchanged at 3.6% when it meets on Sept 29-30. The market still discounts further easing in November and next year with the low of the easing cycle seen near 3.1%.
GBP/JPY Daily Outlook
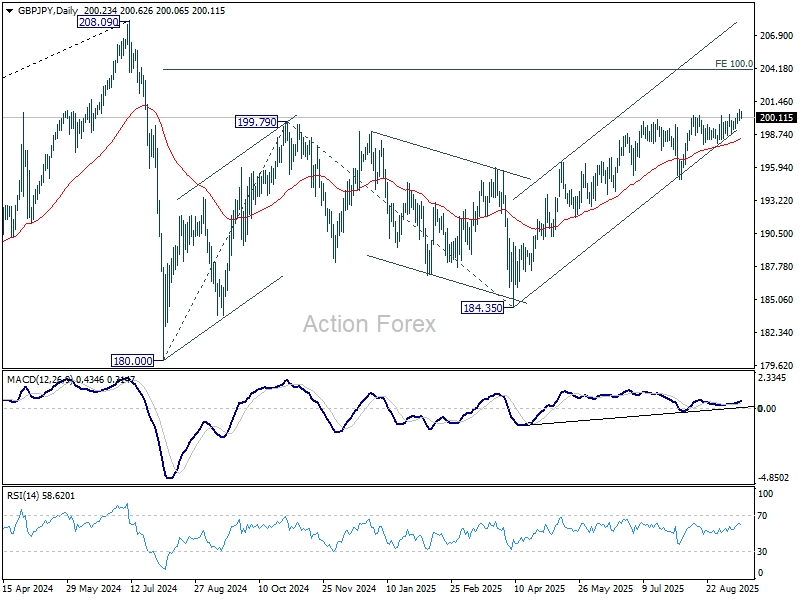
Daily Pivots: (S1) 200.00; (P) 200.37; (R1) 200.82; More...
Intraday bias in GBP/JPY stays mildly on the upside at this point. Sustained trading above 200.32 will target 100% projection of 180.00 to 199.79 from 184.35 at 204.14. Nevertheless, break of 199.57 minor support will delay the bullish case and turn intraday bias neutral again.
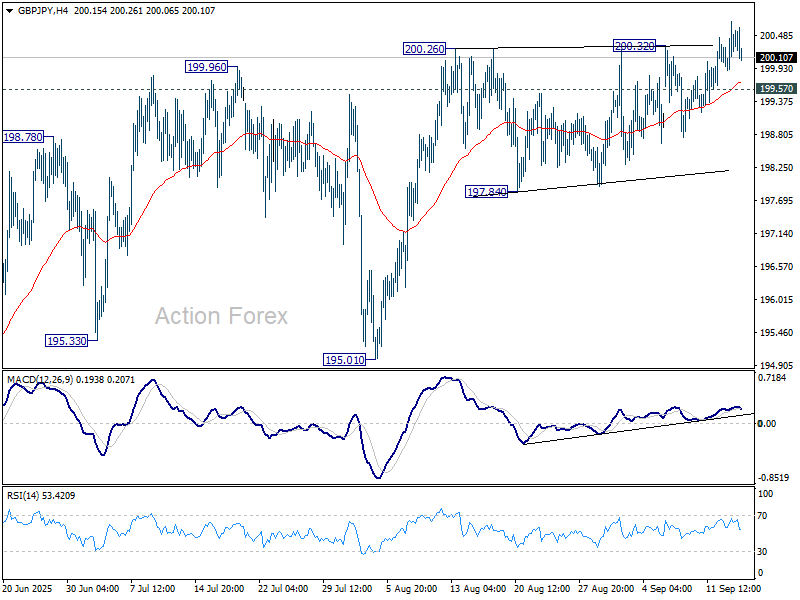
In the bigger picture, price actions from 208.09 (2024 high) are seen as a correction to rally from 123.94 (2020 low). The pattern might still extend with another falling leg. But in that case, strong support should be seen from 38.2% retracement of 123.94 to 208.09 at 175.94 to contain downside. Meanwhile, decisive break of 208.09 will confirm long term up trend resumption.
EUR/JPY Daily Outlook
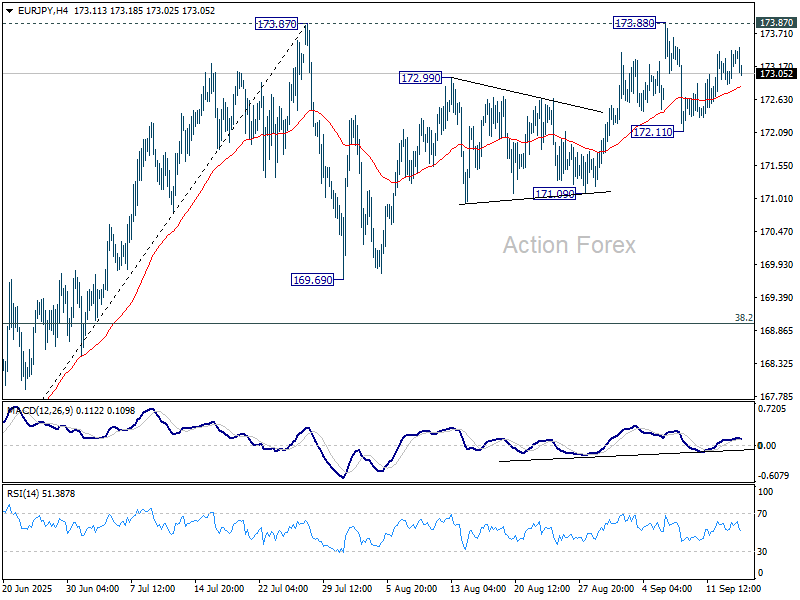
Daily Pivots: (S1) 172.70; (P) 173.07; (R1) 173.65; More...
Intraday bias in EUR/JPY remains neutral and further rise is in favor as long as 172.11 support holds. On the upside, firm break of 173.87/8 will resume the rally from 154.77 to retest 175.41 high. However, break of 172.11 will extend the corrective pattern from 173.87 with another fall. Bias will be back to the downside for 171.09 support first.
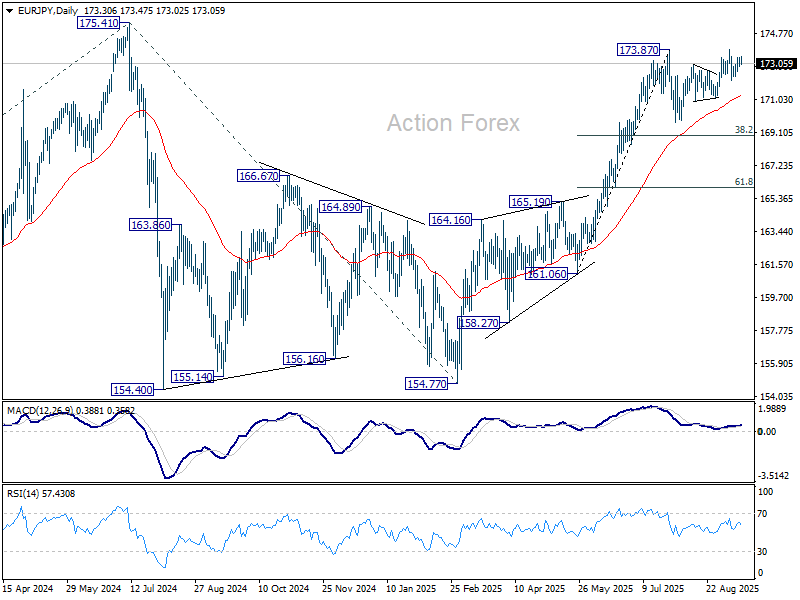
In the bigger picture, current rally from 154.77 is still tentatively seen as resuming the larger up trend. Firm break of 175.41 (2024 high) will confirm and target 61.8% projection of 124.37 to 175.41 from 154.77 at 186.31. However, sustained break of 38.2% retracement of 161.06 to 173.87 at 168.97 will delay this bullish case, and probably extend the correction from 175.41 with another fall.
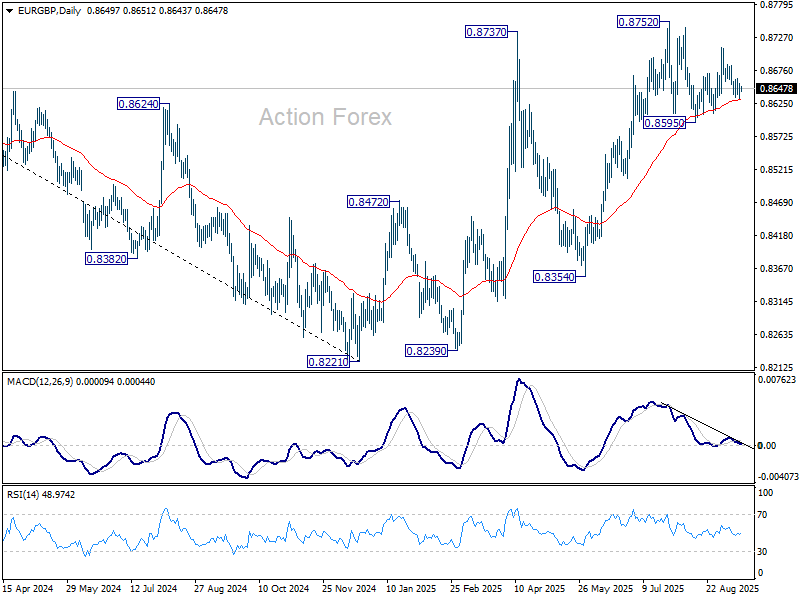
EUR/GBP Daily Outlook
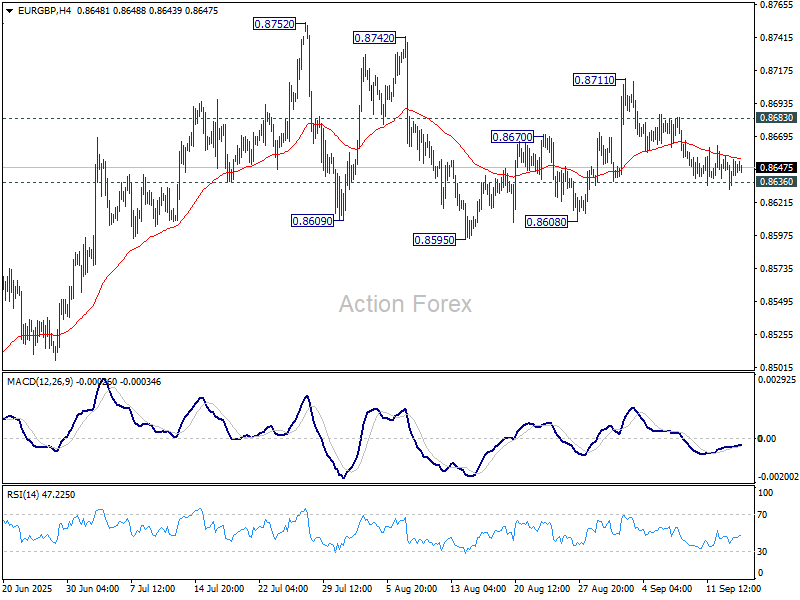
Daily Pivots: (S1) 0.8634; (P) 0.8647; (R1) 0.8661; More...
EUR/GBP is still holding on to 0.8636 support despite breaching it. Intraday bias stays neutral. On the upside, break of 0.8683 minor resistance will extend the rebound from 0.8595 through 0.8711 to retest 0.8752 high. However, firm break of 0.8636 will turn bias to the downside for 0.8595 support instead.
In the bigger picture, the structure from 0.8221 medium term bottom are not impulsive enough to suggest that it's reversing the down trend from 0.9267 (2022 high). But even if it's a correction, further rise could still be seen to 61.8% retracement of 0.9267 to 0.8221 at 0.8867. Nevertheless, sustained trading below 55 W EMA (now at 0.8518) will argue that the pattern has completed and bring retest of 0.8221 low.
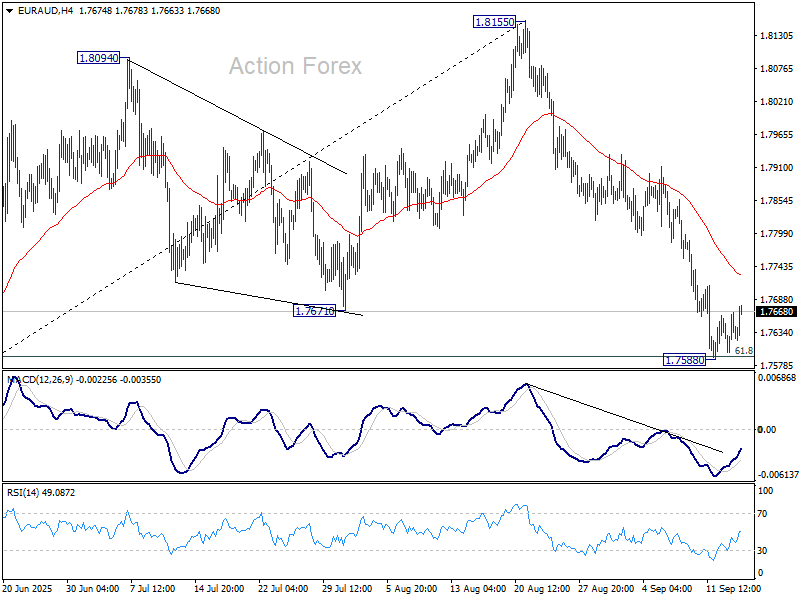
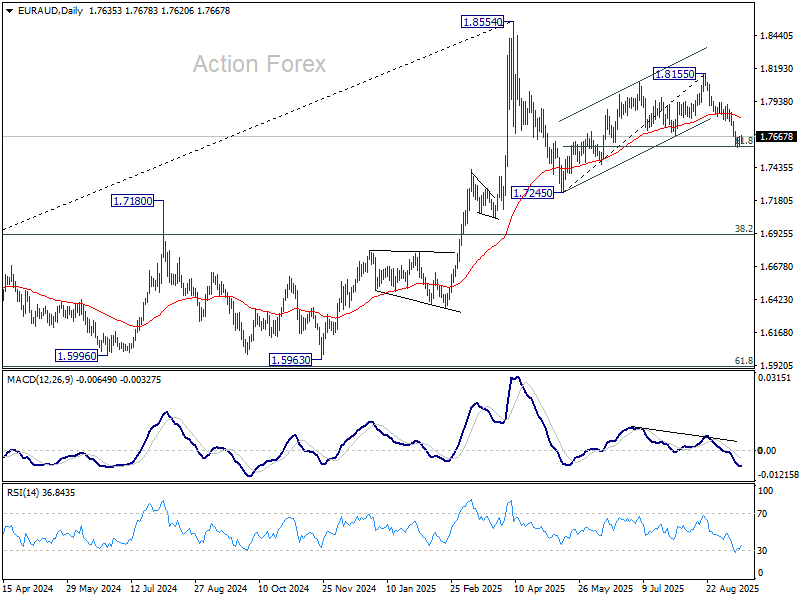
EUR/AUD Daily Outlook
Daily Pivots: (S1) 1.7596; (P) 1.7639; (R1) 1.7676; More...
Intraday bias in EUR/AUD as consolidations continue above 1.7588. Another recovery cannot be ruled out, but further decline is expected as long as 55 D EMA (now at 1.7808) holds. Corrective pattern from 1.8554 is in the third leg. Sustained trading below 61.8% retracement of 1.7245 to 1.8155 at 1.7593 will target 1.7245 support and possibly below.
In the bigger picture, price actions from 1.8554 medium term top are seen as a corrective pattern. Deeper fall could be seen as the pattern extends, but downside should be contained by 38.2% retracement of 1.4281 (2022 low) to 1.8554 at 1.6922 to bring rebound. Uptrend from 1.4281 is expected to resume at a later stage.
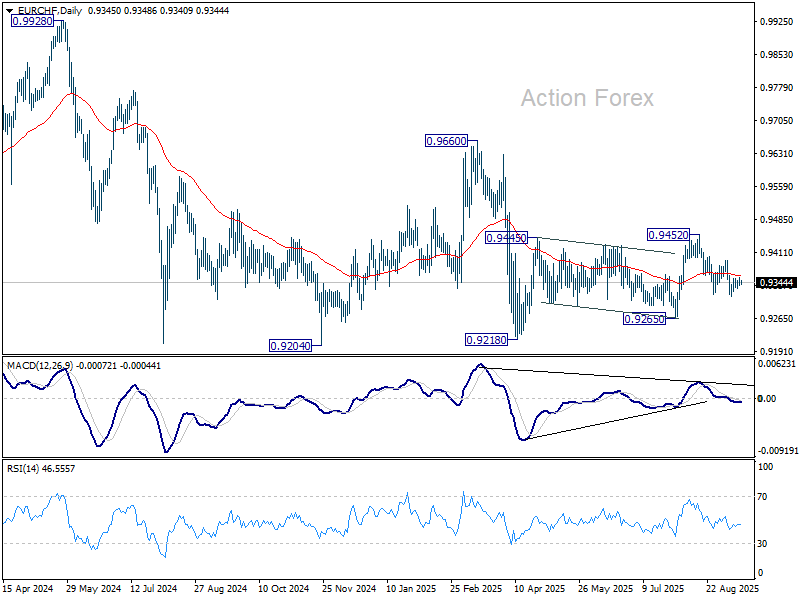
EUR/CHF Daily Outlook
Daily Pivots: (S1) 0.9338; (P) 0.9347; (R1) 0.9356; More...
No change in EUR/CHF's outlook as consolidations continue above 0.9313. Intraday bias stays neutral and further decline is expected with 0.9394 resistance intact. On the downside, break of 0.9313 will resume the fall from 0.9452 to retest 0.9218 low. On the upside, break of 0.9394 will bring stronger rally towards 0.9452 resistance instead.
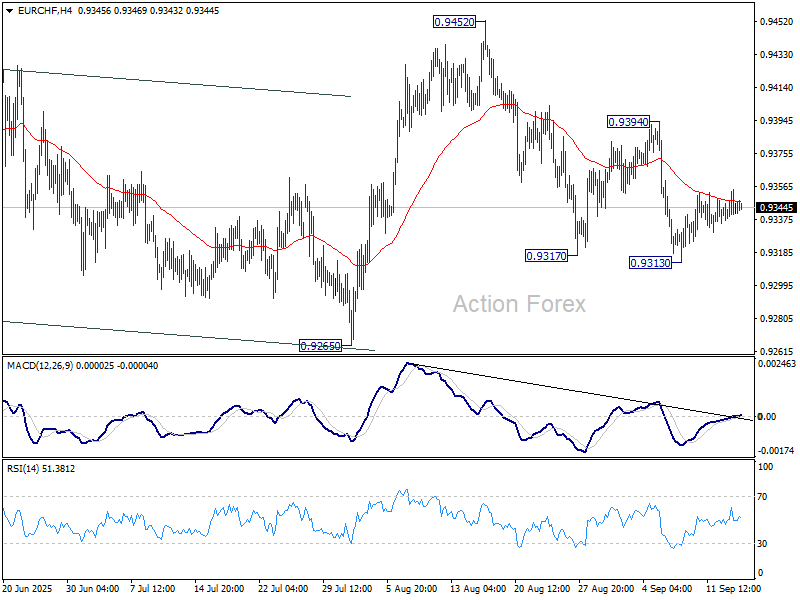
In the bigger picture, the down trend from 0.9204 (2018 high) might still be in progress considering that EUR/CHF is staying well inside the long term falling channel. However, with bullish convergence condition in W MACD, downside potential should be limited in case of another fall. Instead, firm break of 0.9660 resistance will be an important sign of medium term bullish trend reversal.
UK job losses continue, pay growth still strong
UK labor market data for August showed further signs of strain, with payrolled employment falling by -8k on the month, extending a steady decline since the peak in Q3 2024. Claimant count rose by 17.4k, less than expected 20.3k. Median monthly pay rose 6.6% yoy, up from July’s 6.0%, underlining persistent wage pressures.
In the three months to July, unemployment rate held steady at 4.7%, in line with forecasts. Average earnings excluding bonuses eased slightly from 5.0% to 4.8%, while including bonuses ticked higher from 4.6% to 4.7%. Overall, the figures show employment losses are continuing, but wage growth remains firm enough to keep the BoE cautious on policy.
Big Tech Leads Rally as Fed Starts Two-Day Meeting
Another day, another record high for the S&P 500 on optimism that:
- Earnings grew around 13% last quarter and the profit outlook has been improving since the summer months, and
- The Federal Reserve (Fed) is about to start a fresh policy-easing cycle to counter the weakening U.S. jobs market – provided that inflation remains under control.
The combination of strong earnings growth and the prospect of lower rates is simply too good for investors to jump off a running bull. On the Fed and rate cuts, many expect a total of 100 bps over the next four meetings.
So if you think there’s a mismatch between the S&P 500’s outlook and the broader U.S. economy and Fed outlook – you’re not alone. That’s because the S&P 500 doesn’t represent the US economy. Roughly a third of the index is made up of Big Tech. Nvidia alone accounts for about 8% of the benchmark. These companies have deep pockets and support each others’ business. This ecosystem, combined with global demand for US tech, has kept the major US indices – the S&P 500 and Nasdaq in particular – in demand despite signs of economic weakness elsewhere. For the rest of the S&P 500, earnings growth last quarter was around 3–4%. You can see this divergence in the equal-weight S&P 500, which continues to lag the market-cap-weighted version.
The weak economic outlook and deteriorating jobs market are not necessarily a concern for US Big Tech, but the prospect of lower rates is clearly positive because it makes valuations look juicier – simple math. As such, the week kicked off at fresh record highs for the S&P 500, while the US 2-year yield – which captures Fed expectations – remained under pressure. Google jumped more than 4% and hit a $3 trillion valuation, fueled by the news (earlier this month) that the company doesn’t need to sell its Chrome browser. That, combined with AI momentum, is pushing Google higher with a slight delay. We’ve long argued that Meta and Google would be the next leg of the AI rally, given these data-rich companies are well placed to benefit from the technology. Nvidia, the icon of the global AI rally, opened lower but closed flat above its 50-DMA, despite reports that China is going after it for violating antitrust laws in a high-profile 2020 deal. The timing is noteworthy, as US and Chinese officials are simultaneously discussing trade terms, TikTok and US concerns about Chinese purchases of Russian oil. Meanwhile, there are also rumours that the trade truce with China could be extended, and that India could strike a trade agreement with the US as well. The good news: trade headlines no longer dent market sentiment as they once did.
So, does that mean everything is rosy? Well, the correction I was expecting over the summer hasn’t materialized, and underlying fundamentals have turned more positive in the meantime. US debt concerns have faded into the background, the trade war’s negative implications have been digested, the Trump administration’s interventions in private companies and the Fed have been absorbed. And now, the Fed appears convinced that cutting rates is indeed the right course.
Inside the Fed, Stephen Miran has been confirmed as a voting member just in time for this week’s Fed meeting, while Lisa Cook will likely participate despite Trump’s efforts to oust her. Beyond the policy rate decision, we’ll also get an update on the so-called dot plot, giving insight into Fed members’ expectations beyond this month. As I wrote earlier, many analysts think there could be four 25-bp cuts on the horizon in the coming months – a scenario that would likely give a fresh boost to equity markets. Small and mid-cap companies, as well as non-tech and non-U.S. names, are also enjoying the ride. A gauge of Asian equities hit a fresh all-time high this morning.
Looking back, some sectors have outperformed others under different rate-cutting scenarios. According to Ned Davis Research, the median gain after four or more cuts (following a six-month pause) was ~20% for health care, nearly 20% for consumer staples, 18% for energy and just 1.6% for tech – suggesting that heavy cutting cycles mostly happen in weak economic conditions, which favour defensives. By contrast, two or fewer cuts tend to support cyclicals such as industrials, energy and financials. We’ll see how many cuts the Fed puts on the menu in the coming months and how markets react.
Still, note that some, like JPMorgan’s chief strategist, warn that investors could lose appetite once the Fed actually starts cutting, if they believe the move is politically rather than economically motivated. That risk would rise if the Fed cut by 50 bps or signaled more cuts over the next 6–12 months than warranted. For now, though, dovish Fed expectations remain supportive of risk appetite. The US dollar is under pressure, gold and silver are pushing higher, and US crude is consolidating gains near the middle of the $62–65pb range, awaiting fresh direction.