Sample Category Title
Gold (XAU/USD) Technical: Eyeing New All-Time High Above US$3,675, Supported by Positive Flows and Positioning
The price actions of Gold (XAU/USD) have traded sideways and managed to hold above the US$3,600 short-term pivotal support highlighted in our previous report.
The latest speculative positioning and flows data in the gold futures market and exchange-traded funds are net positive, in turn, supporting the current short-term bullish acceleration trend of Gold (XAU/USD) since the bullish breakout above its former all-time high of US$3,500 on 2 September 2025.
Let’s examine these positioning and flow data in greater detail.
Net long speculative positions in gold futures have not reached extreme levels
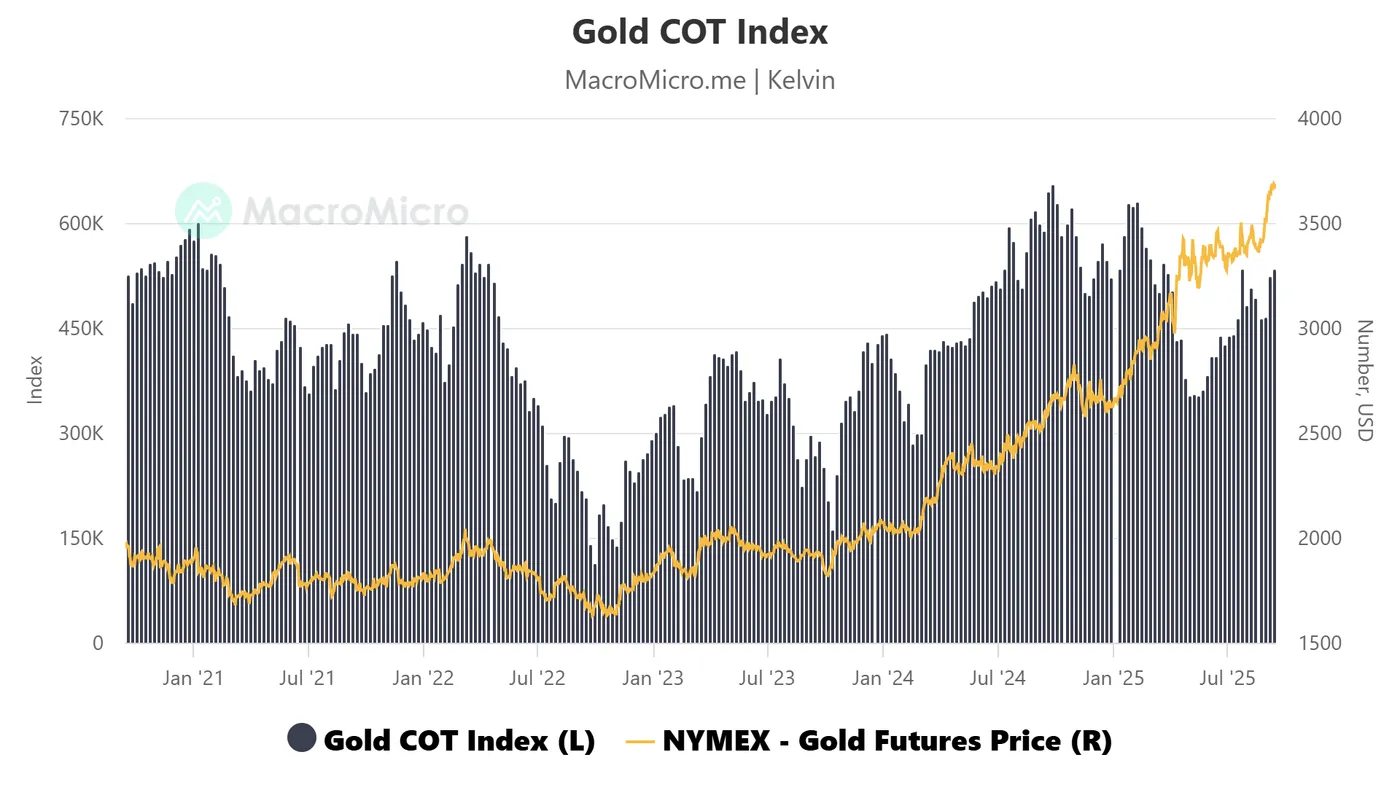
Fig. 1: Commitments of Trader large speculators' net positioning in Gold futures as of 9 September 2025 (Source: Macro Micro)
Based on the latest Commitments of Traders (COT) data as of 9 September 2025 (compiled by MacroMicro), the aggregate net long positions of large speculators in NYMEX gold futures, after offsetting the positions of commercial hedgers, have climbed to +535,115 contracts, extending a steady four-month increase from +354,079 on 29 April 2025 (see Fig. 1).
Net speculative flows, primarily from hedge funds, are often contrarian indicators; elevated positioning can trigger an opposite move in prices if market data or news disappoints.
However, with the current net long positioning still about 20% below the five-year high of +655,096 contracts recorded on 24 September 2024, the short-term bullish trend in Gold (XAU/USD) appears to have more room to run, as positioning has yet to reach levels that typically prompt profit-taking.
Gold ETFs' net inflows have recovered from a 2-month low
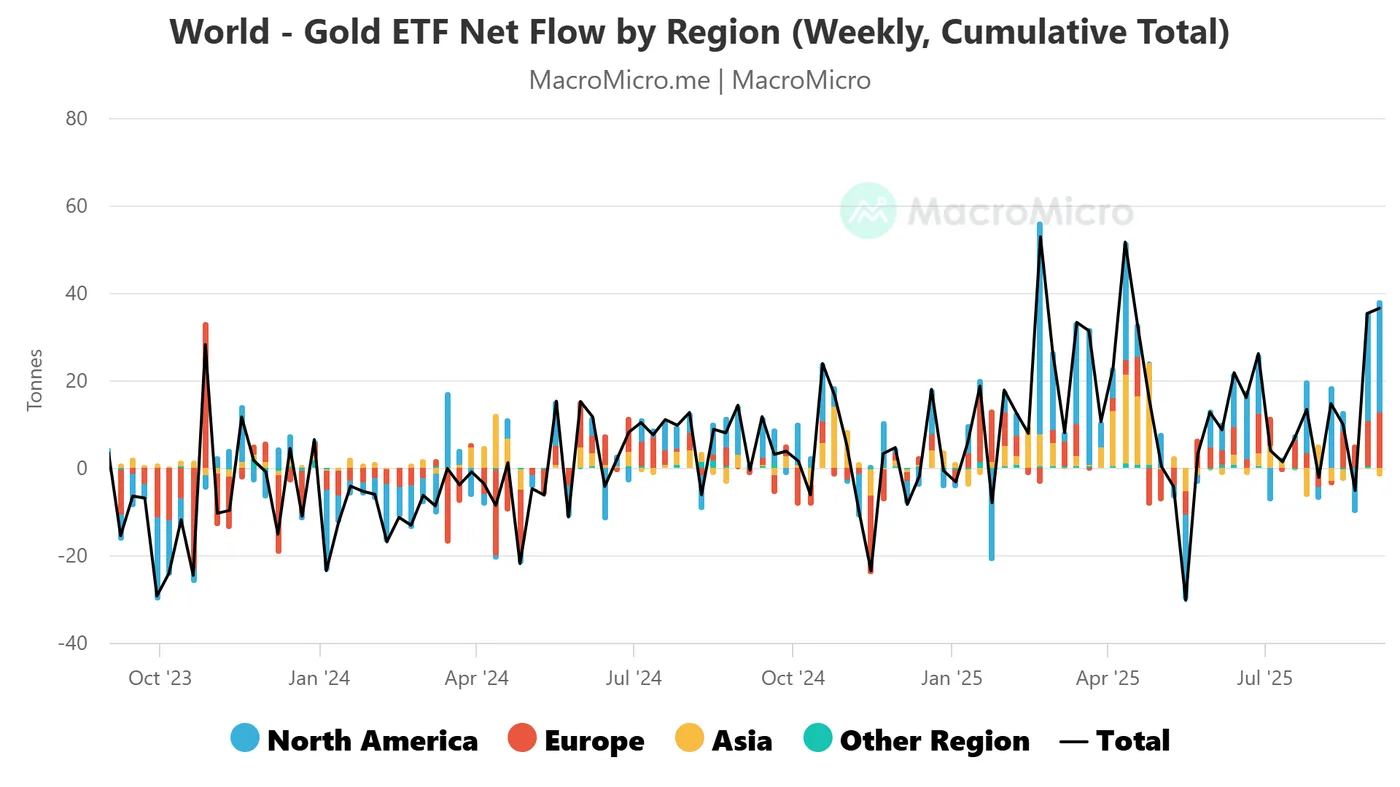
Fig. 2: Weekly cumulative Gold ETF flows as of 5 September 2025 (Source: Macro Micro)
In addition to steady gold bullion purchases by central banks since 2022, institutional and retail demand through exchange-traded funds (ETFs) has gained momentum since May 2025, further reinforcing investor appetite for the precious metal.
Total regional gold ETF flows have recovered from a net outflow of -5.17 tonnes for the week ending 22 August 2025 to a net inflow of 36.49 tonnes for the week ending 5 September 2025 (see Fig. 2).
An improvement in the cumulative weekly gold ETF flows suggests a pick-up in demand from institutions and retail investors, in turn, supporting the short to medium-term uptrend phases of Gold (XAU/USD)
Let’s now examine the short-term (1 to 3 days) trajectory of Gold (XAU/USD) and its key levels to watch ahead of this week’s key US Federal Reserve monetary policy decision, latest economic projections, and Fed Chair Powell’s press conference.
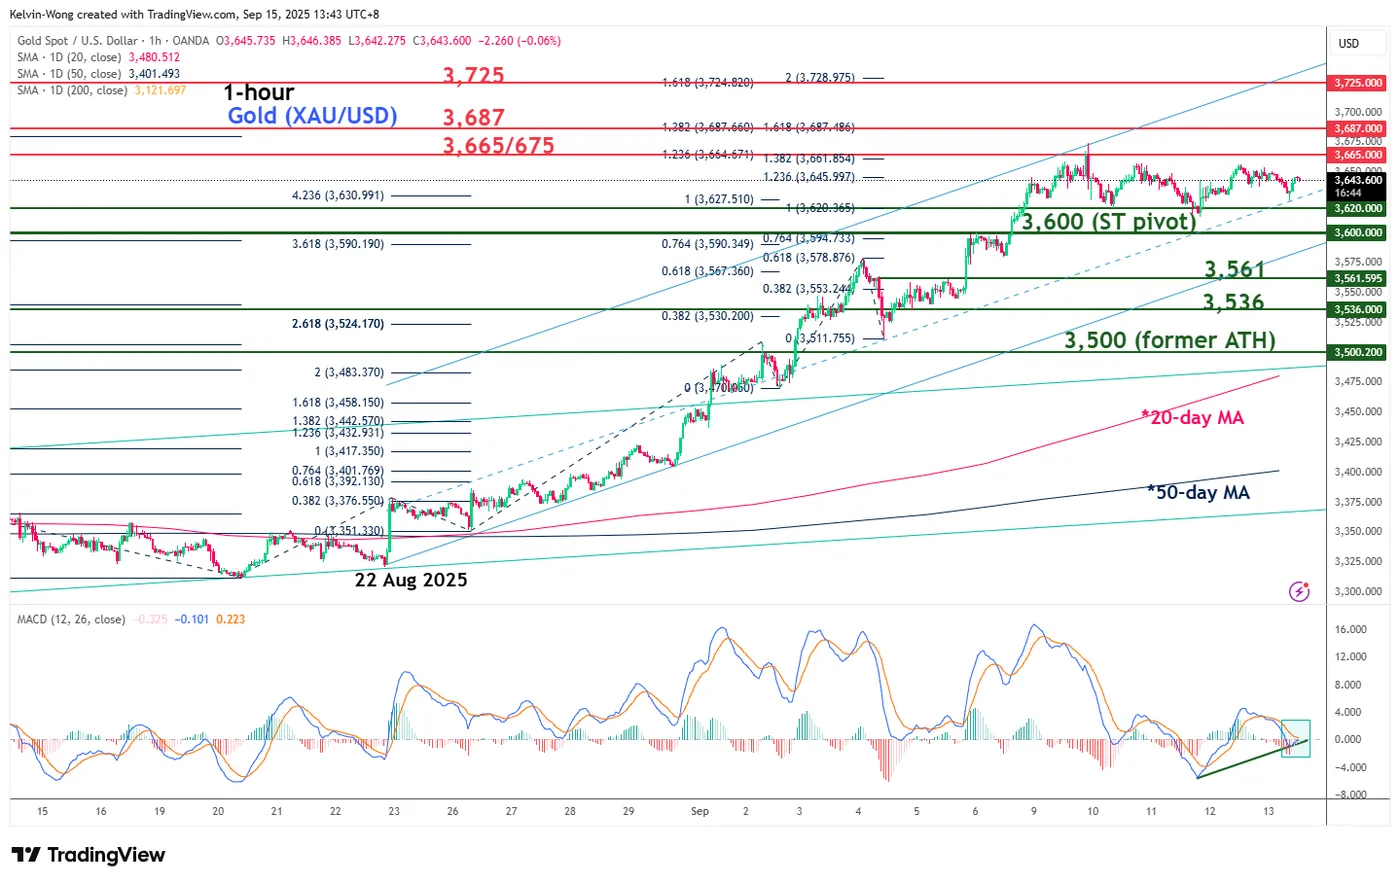
Fig. 3: Gold (XAU/USD) minor trend as of 15 September 2025 (Source: TradingView)
Preferred trend bias (1-3 days)
Maintain bullish bias with a key short-term pivotal support at US$3,600 for Gold (XAU/USD). A clearance above US$3,665/3,675 intermediate resistance increases the odds of another leg of bullish impulsive up move sequence for the next intermediate resistances to come in at US$3,687, followed by US$3,725 (also a Fibonacci extension cluster) (see Fig. 3).
Key elements
- The price actions of Gold (XAU/USD) have continued to oscillate within a minor ascending channel from its 22 August 2025 low, with its upper boundary of the ascending channel projected to come at US$3,725, and its lower boundary, now acting as a key intermediate support at US$3,600.
- The hourly MACD trend indicator has managed to find support at around the centreline, and it has now flashed out an impending bullish crossover signal. These observations suggest that the minor bullish acceleration phase for Gold (XAU/USD) remains intact.
Alternative trend bias (1 to 3 days)
A break below the US$3,600 key short-term support on Gold (XAU/USD) invalidates the bullish tone to trigger a deeper minor corrective decline towards the next intermediate supports at US$3,561 and US$3,536.
We Align With Currently Priced in Back-to-Back-to-Back Fed Moves
Markets
Rating agency Fitch lowered the French credit rating after market close on Friday from AA- to A+ with a stable outlook. It’s the first time ever that the French rating drops into single A category at one of the three big credit rating firms. Belgium shared the same fate when Fitch axed the rating to A+ back in June. France currently still holds a one-notch better rating at Moody’s (Aa3; stable outlook) and S&P (AA-; negative outlook). Those rating agencies have a planned update on respectively October 25 and November 28. The French high and rising debt ratio is the main culprit for Fitch’s verdict. It projects it to increase from 113.2% of GDP in 2024 to 121% in 2027 without a clear horizon for debt stabilization in subsequent years. Political fragmentation hinders budget consolidation, as illustrated by previous PM Bayrou’s defeat in a parliamentary confidence vote. The instability of the political system (three different governments since snap election slightly over a year ago) weakens the capacity to deliver much-needed fiscal consolidation making it unlikely that the deficit return below 3% of GDP by 2029. Fitch expects a deficit ratio of 5.5% of GDP this year (from 5.8% last year) and >5% shortcomings in 2026 and 2027 as well. The underlying growth path is rather weak at 0.6%-0.9%-1.2% for the 2025-2027 period (trend growth estimated at a low 1.1%). While the downgrade had been coming, we see no sustainable path for a comeback in French assets and especially bonds. Since the current attempt to form a new government, led by PM Lecornu, offers only a path to again watered down fiscal efforts, a new parliamentary ballot and related-uncertainty probably is the unavoidable scenario. The single currency shows no signs of contagion this morning, holding steady at EUR/USD 1.1725.
Today’s eco calendar is empty apart from the September US Empire Manufacturing Survey and a speech by ECB President Lagarde after European close. The US figures (including tomorrow’s retail sales) won’t move the needle in the run-up to Wednesday’s FOMC meeting. The re-start of the Fed’s normalization cycle (25 bps rate cut) is discounted, but markets will be screening the updated quarterly Summary of Economic Projections and Powell’s presser into how far the cycle might reach. We align with the currently priced in back-to-back-to-back moves stretching into December, but have no strong conviction on next year given sticky and rising inflation. This could also show up in the new dot plot in form of a wide-range of views by Fed governors. Money markets put the bottom currently at a neutral 3% in 2026. ECB President Lagarde is expected to stay close to last week’s message. Declaring the disinflation process as over set the stage for a prolonged pause at the current 2% policy rate level.
News & Views
Fitch upgraded the Portuguese rating from A to A+ (stable outlook). As a driver for the upgrade, Fitch, amongst others, mentions the continued debt reduction. Public debt fell from 134.1% in 2020 to 96.4% in Q1 of this year. The drop reflects robust growth and sizeable primary surpluses underpinned by a strong record of prudent fiscal policy. Fitch forecasts Portugal’s public debt to fall further to 88.4% end 2027, albeit at a slower pace. The county currently has a balanced fiscal position. Fitch expects a budget surplus of 0.1% in 2025, but sees the general government balance to shifting to a moderate deficit of 0.7% in 2026 before easing again to -0.4% in 2027. Fitch expects growth of 1.8% this year and 2.2% next year, outperforming EMU average growth (1.1% in 2026 and 2027).
S&P upgraded the Spanish rating from A to A+ (stable outlook). It mentions that a decade of private sector deleveraging has led to a notable improvement in the county’s external balance sheet, lowering the country’s sensitivity to sudden changes in external financing conditions and improving its overall resilience to economic shocks. Immigration, investment and past structural reforms are also said to drive buoyant employment growth. S&P expects 2.6% growth this year. The rating agency also sees the services-based economy having limited US trade exposure insulating the economy from the immediate consequences of the US merchandise tariffs. Those positive developments are happening despite the lack of a more resolute decline in the budget deficit and limited government debt reduction. The budget deficit declined to 3.2% last year and is expected to slowly narrow to 2.6% of GDP in 2028. The bulk of this improvement comes from robust growth in revenue rather than significant discretionary fiscal consolidation. S&P expects gross debt-to GDP to slowly decline to 97% in 2028 from 99% now.
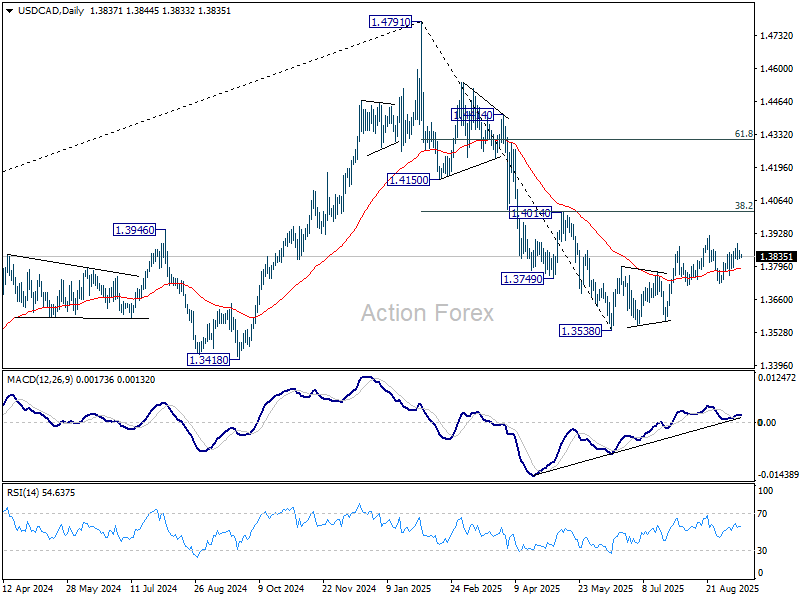
USD/CAD Daily Outlook
Daily Pivots: (S1) 1.3830; (P) 1.3847; (R1) 1.3863; More...
Intraday bias in USD/CAD remains neutral and outlook is unchanged. On the downside, firm break of 1.3725 support will indicate that corrective rebound from 1.3538 has already completed, and turn near term outlook bearish. However, break of 1.3923 will resume the rebound towards 1.4014 cluster resistance.
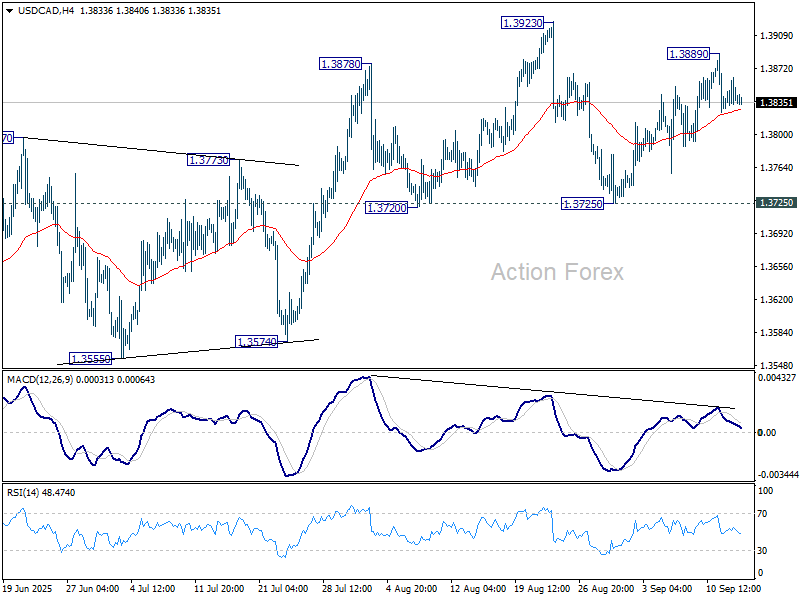
In the bigger picture, price actions from 1.4791 medium term top could either be a correction to rise from 1.2005 (2021 low), or trend reversal. In either case, further decline is expected as long as 1.4014 cluster resistance (38.2% retracement of 1.4791 to 1.3538 at 1.4017) holds. Next target is 61.8% retracement of 1.2005 (2021 low) to 1.4791 at 1.3069.
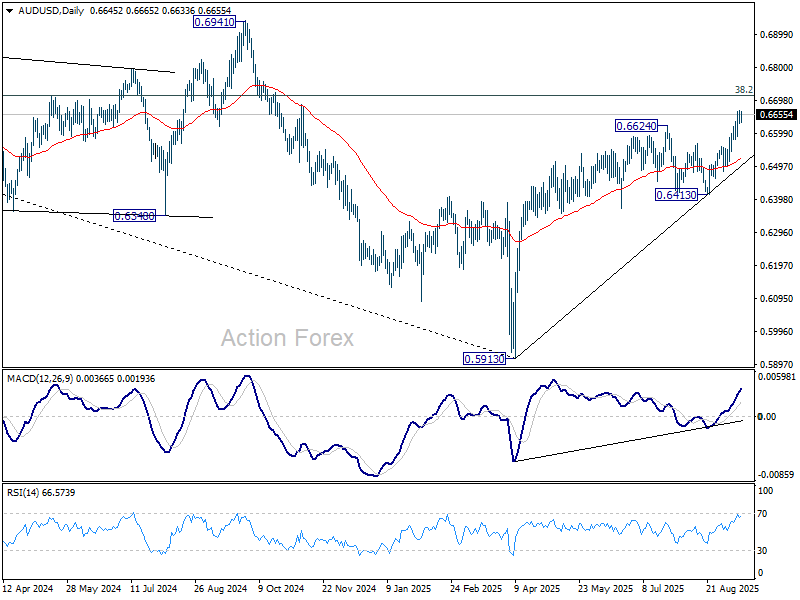
AUD/USD Daily Report
Daily Pivots: (S1) 0.6630; (P) 0.6650; (R1) 0.6668; More...
Intraday bias in AUD/USD stays on the upside at this point. Current rally from 0.5913 should target 0.6713 fibonacci level. Firm break there will carry larger bullish implications. On the downside, below 0.6589 minor support will turn bias neutral and bring consolidations first, before staging another rise.
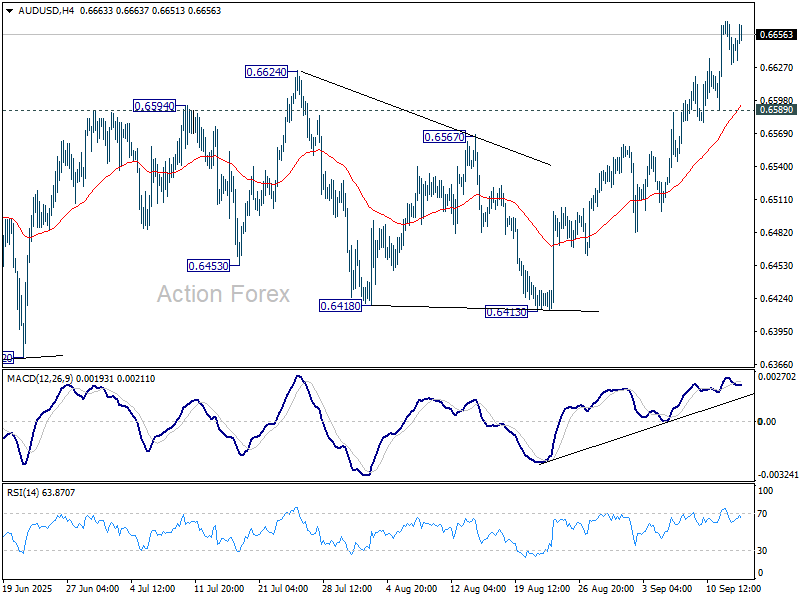
In the bigger picture, there is no clear sign that down trend from 0.8006 (2021 high) has completed. Rebound from 0.5913 is seen as a corrective move. While stronger rally cannot be ruled out, outlook will remain bearish as long as 38.2% retracement of 0.8006 to 0.5913 at 0.6713 holds. Nevertheless, considering bullish convergence condition in W MACD, sustained break of 0.6713 will be a strong sign of bullish trend reversal, and path the way to 0.6941 structural resistance for confirmation.
USD/JPY Daily Outlook
Daily Pivots: (S1) 146.75; (P) 147.47; (R1) 147.94; More...
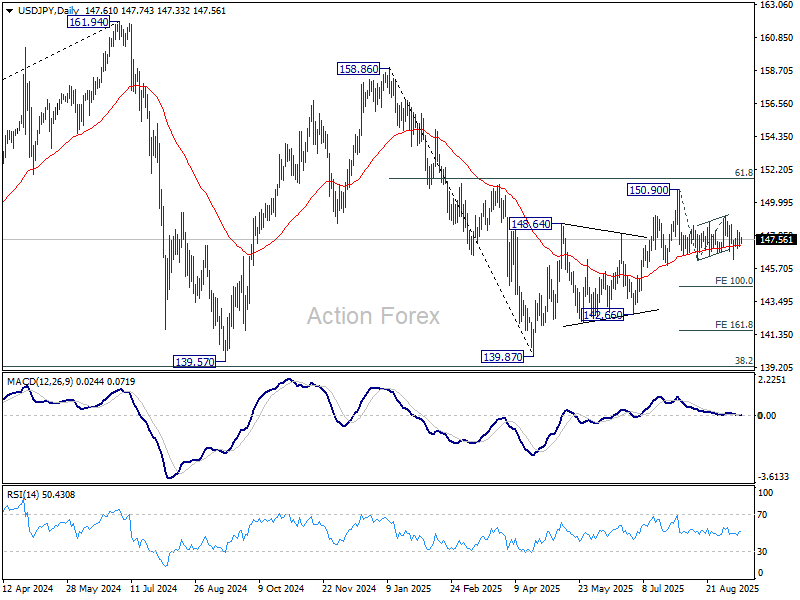
Intraday bias in USD/JPY stays neutral for the moment and more consolidations would be seen first. Further fall is in favor as long as 149.12 resistance holds. Firm break of 146.29 will solidify the case that whole rebound from 139.87 has completed with three waves up to 150.90. Deeper decline should then be seen to 100% projection of 150.90 to 146.20 from 149.12 at 144.42.
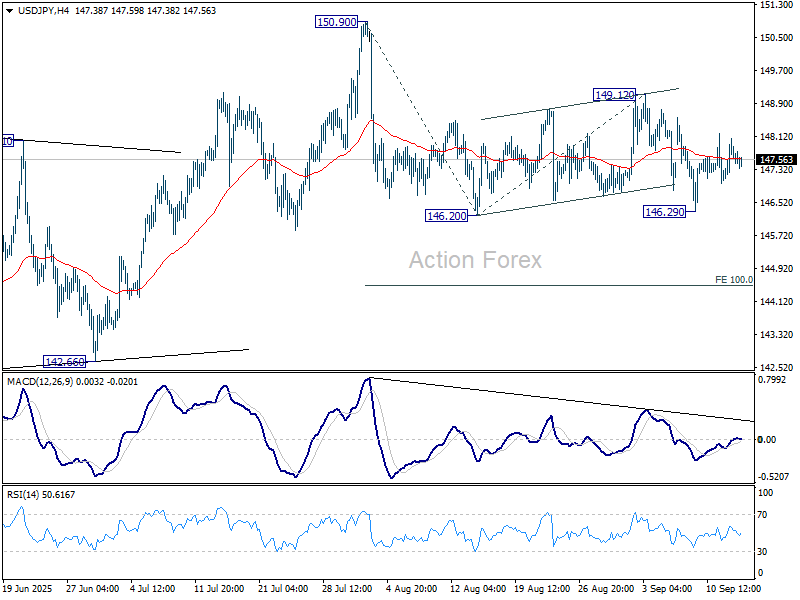
In the bigger picture, price actions from 161.94 (2024 high) are seen as a corrective pattern to rise from 102.58 (2021 low). Decisive break of 61.8% retracement of 158.86 to 139.87 at 151.22 will argue that it has already completed with three waves at 139.87. Larger up trend might then be ready to resume through 161.94 high. In case the corrective pattern extends with another fall, strong support is expected from 38.2% retracement of 102.58 to 161.94 at 139.26 to bring rebound.
USD/CHF Daily Outlook
Daily Pivots: (S1) 0.7948; (P) 0.7967; (R1) 0.7983; More….
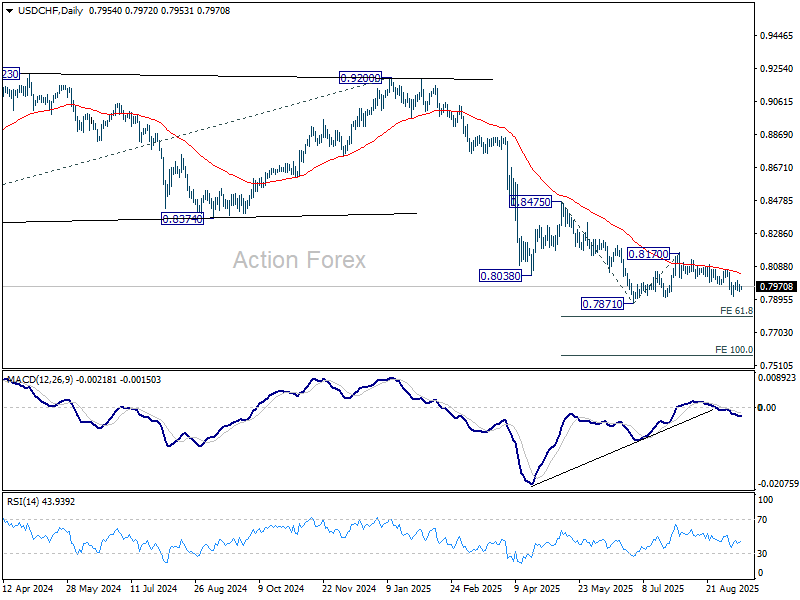
Intraday bias in USD/CHF remains neutral and more consolidations could be seen above 0.7914 temporary low. But further fall is expected as long as 0.8071 resistance holds. Below 0.7914 will bring retest of 0.7871 low. Decisive break there will resume larger down trend to 61.8% projection of 0.8475 to 0.7871 from 0.8170 at 0.7797.
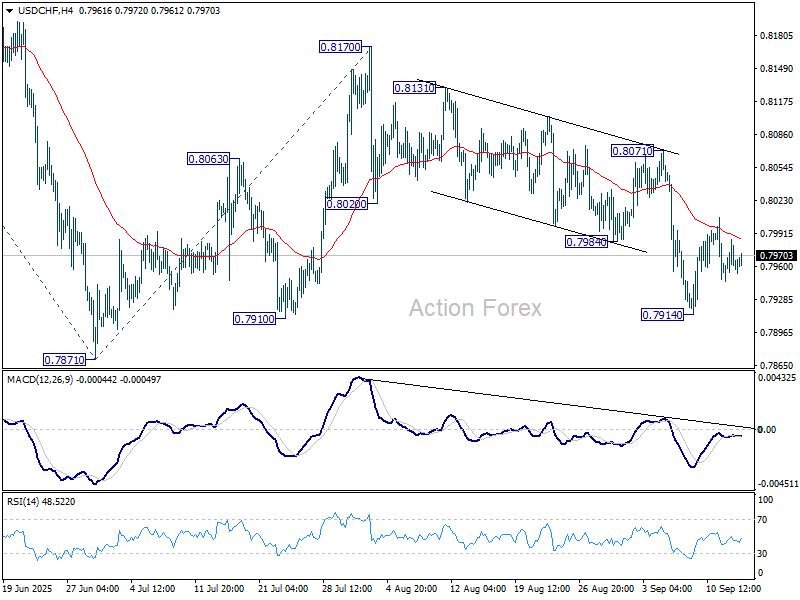
In the bigger picture, long term down trend from 1.0342 (2017 high) is still in progress. Next target is 100% projection of 1.0146 (2022 high) to 0.8332 from 0.9200 at 0.7382. In any case, outlook will stay bearish as long as 0.8332 support turned resistance holds.
GBP/USD Daily Outlook
Daily Pivots: (S1) 1.3530; (P) 1.3556; (R1) 1.3587; More...
Intraday bias in GBP/USD remains neutral and more consolidations could be seen below 1.3590. Further rally is expected as long as 1.3332 support holds. Firm break of 1.3594 will resume the rebound from 1.3140 to retest 1.3787 high. Decisive break there will resume larger up trend.
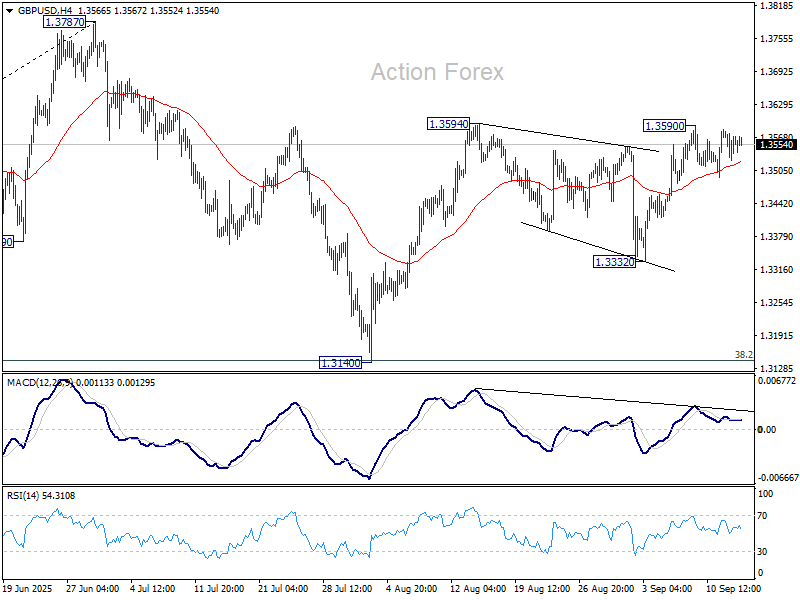
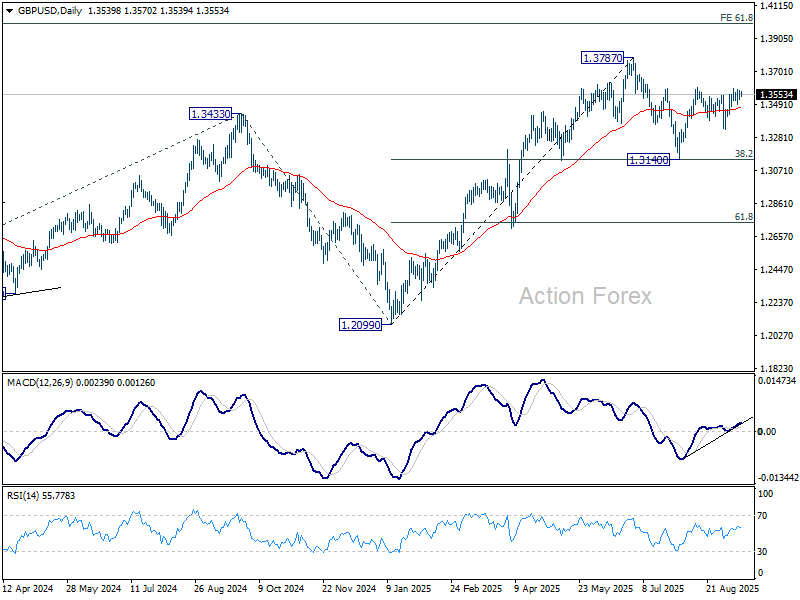
In the bigger picture, up trend from 1.3051 (2022 low) is in progress. Next medium term target is 61.8% projection of 1.0351 to 1.3433 from 1.2099 at 1.4004. Outlook will now stay bullish as long as 55 W EMA (now at 1.3118) holds, even in case of deep pullback.
Asian Stocks Hit Record on Dovish Fed Bets, Tech Appetite
The week kicks off on a slightly positive note after last week’s softer-than-expected US inflation data paved the way for a rate cut on Wednesday. Combined with signs of a rapidly deteriorating US jobs market, investors now expect the Federal Reserve (Fed) to begin a series of cuts this week. Markets are almost fully priced for a 25bp reduction in US rates, the dollar remains offered across the board, and the US 2-year yield, while rebounding from 3.50% last week, is still hovering near its lowest levels of the year. Equity markets are enjoying the ride, with the S&P 500 hinting at a positive start after hitting a fresh record on Friday.
In Europe, sentiment across futures is encouraging even though the European Central Bank (ECB) refrained from further easing last week, signaling its rate-cutting cycle is likely over. The FTSE 100 pulled back from near-record highs on Friday. The Bank of England (BoE) is expected to hold rates steady this week given sticky inflation pressures, while the Bank of Canada (BoC) is widely expected to trim by 25bp to support an economy squeezed by trade headwinds. Diverging central-bank stances are creating interesting FX opportunities: the US dollar is soft on the back of easing Fed expectations, the euro remains supported by firmer ECB policy and more trade clarity with the US, though political risks in France cap upside. Fitch downgraded France’s credit rating from AA- to A+ on Friday, citing the lack of a credible debt-control plan. The move could further widen the French-German yield spread as institutional investors adjust portfolios, potentially triggering further selling in French bonds. Sterling holds firm against a weaker dollar but loses ground to the euro. The BoE’s hawkish stance looks less appealing amid sticky inflation, tax increases and a slowing economy. UK 10-year gilt yields stand near 4.65% this morning — among the highest across DM peers.
Yields across developed markets have risen sharply since pre-pandemic times, reflecting higher inflation, spending and debt burdens. Pandemic-era debt expansion continues to weigh on long-maturity sovereigns, driving flows into commodities. As such, gold consolidates near all-time highs, silver pushes toward levels last seen in 2011, while EM central banks continue to add gold at the expense of US Treasuries.
Crude oil rises this Monday morning on the back of weekend attacks on Russian oil facilities and Trump asks its allies to stop buying energy from Russia, and threatens to impose up to 100% tariffs on India and China that refuse to stop buying the cheap Russian oil. The latter should cement support near the $62pb mark yet the bulls need a major geopolitical shakeup to sustainably break above the $65pb level at a time OPEC is willing to bring more oil to the market – though their capacity to do so is broadly questioned.
In Asia, the week began with weaker-than-expected Chinese data on industrial production, retail sales, and investment, alongside a higher unemployment rate. Yet markets took the disappointment as a cue for more stimulus. Combined with AI enthusiasm, this is keeping Chinese equities in demand: the CSI 300 is up, the Hang Seng consolidates near a four-year high. EV-battery giant CATL rallied almost 10% to a fresh record in Hong Kong after Beijing announced a new energy-storage plan and JPMorgan upgraded the stock. Broader Asian equities hit record highs Monday, fueled by dovish Fed expectations, a weaker dollar and tech strength. Alibaba extended last week’s rally (+3%), BYD climbed 4%, while Tencent trades near its 2021 peak. In Korea, the KOSPI is riding strong inflows into tech, as well. National chip champion SK Hynix opened at a fresh record high before paring gains. The AI-backed rally in Asian tech looks to have more room to run, with valuations still well below US peers. Asian tech ETFs continue to offer investors an attractive way to diversify away from US names while still riding the AI, tech boom.
Markets Brace for a Fed Rate Cut
In focus this week
Multiple central bank rate decisions are on the agenda, with notably the FOMC meeting and Bank of Canada (BoC) on Wednesday, the Bank of England (BoE) and Norges Bank (NB) on Thursday, and the Bank of Japan (BoJ) on Friday. The FOMC, BoC and NB are expected to deliver a 25bp cut, while we anticipate that both the BoE and BoJ will keep rates unchanged. Regarding the details, the market will be closely watching the Federal Reserve's updated rate projections for clues on the pace of future easing.
Economic and market news
What happened overnight
In China, the monthly data package showed a further weakening of the economy in August across the board. Both consumption and housing moved a notch lower again with retail sales falling from 3.7% y/y to 3.4% y/y (cons 3.8%) and new home prices down 0.3% m/m following -0.31% m/m in July. Industrial production weakened as well, falling from 5.7% y/y to 5.2% y/y (consensus 5.6%). Investment growth also dropped, and unemployment moved higher. The data should ring some alarm bells in Beijing and, as we saw last autumn, pave the way for stronger stimulus signals soon. The weak demand situation contrasts with the strong development in the tech space, which has supported this year's equity rally. The market reaction has been muted with offshore equities actually slightly higher overnight and USD/CNH lower from 7.1275 to around 7.12. Markets are likely betting on stronger stimulus soon.
What happened over the weekend
In the euro area, the credit rating agency Fitch downgraded France to A+ from AA- citing political instability and rising debt. While we initially believed that France would be downgraded, the formation of a new government earlier this week led to speculation that Fitch might postpone the "inevitable". Prime Minister Lecornu is grappling with the challenge of implementing the spending cuts demanded by impatient investors, while simultaneously attempting to secure support from three ideologically diverse parliamentary blocs with conflicting approaches to budget reductions.
In the US, the University of Michigan's preliminary September consumer sentiment survey reported 1-year inflation expectations remaining elevated at 4.8%, while 5-year expectations rose to 3.9% from 3.5% in August. Both figures remain above the Federal Reserve's target. Although the market reaction was rather muted, we think this presents a compelling argument for a more gradual rate-cutting cycle rather than back-to-back cuts.
In the UK, GDP was unchanged in July compared to June, leaving y/y growth at 1.4% and slightly weaker than market expectations. Manufacturing output declined 1.3% m/m while services improved slightly, thus largely confirming the story from PMI data as well.
Equities: Equities were little changed on Friday. In the US, performance was supported by last week's decline in yields, which continued to fuel gains in big tech. The "Magnificent Seven" stocks rose another 1-2% on a light news flow, while Tesla advanced 7%. The S&P 500 and Stoxx 600 finished the day flat, whereas the Nasdaq gained 0.4%, closing at a fresh all-time high. Today's session also looks quiet, with futures little changed this morning. This still wraps up a strong week for equities, with US indices up 1.5% and Europe 1%. Importantly, the recent defensive rebound - led by healthcare - has stalled.
While focus often falls on the US when lower rates spark tech rallies, the impact has been even more pronounced in emerging markets. Korea's Kospi surged an impressive 7% last week, and China's Shenzhen index has climbed nearly 30% over the past three months. This strength comes despite signs that China's credit impulse and macro momentum have rolled over in past months. Like in the US, the link between broad macro fundamentals and equity prices appears to be breaking down due to AI.
FI and FX: A quiet end to a rather busy week as we saw global yields drifting slightly higher on Friday, with modest curve steepening on both sides of the Atlantic. For the week ahead, focus will be on no less than four G10 central bank meetings: the Fed, Bank of England, Bank of Japan and Norges Bank. In FX space, the USD closed the week on a weaker footing, with EUR/USD moving back above 1.1730. Scandies had a strong week, where especially the NOK stood out with EUR/NOK closing the week some 20 figures lower and NOK/SEK edging higher towards the 200dma at 0.9510.
EUR/USD Daily Outlook
Daily Pivots: (S1) 1.1709; (P) 1.1728; (R1) 1.1756; More...
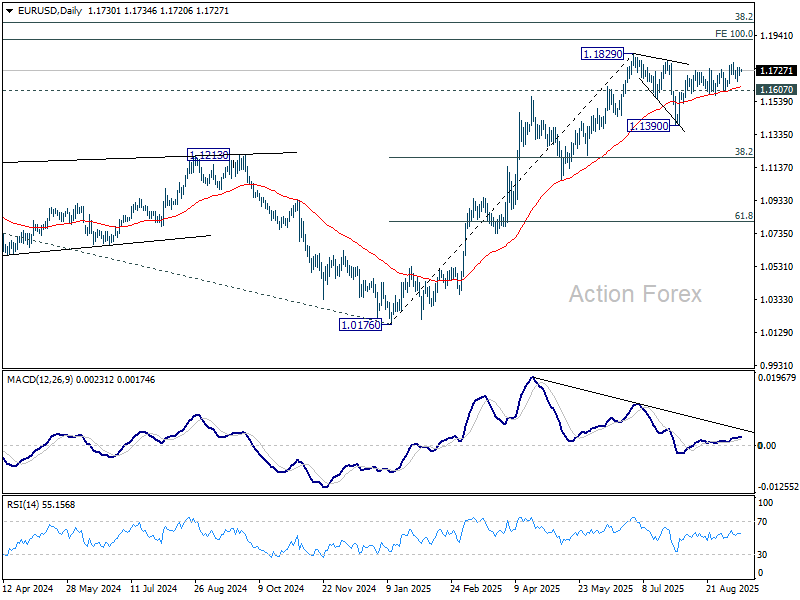
Range trading continues in EUR/USD and intraday bias remains neutral. With 1.1607 support intact, further rise is expected. On the upside, above 1.1779 will target a retest of 1.1829 high. Firm break there will resume larger up trend to 1.1916 projection level next.
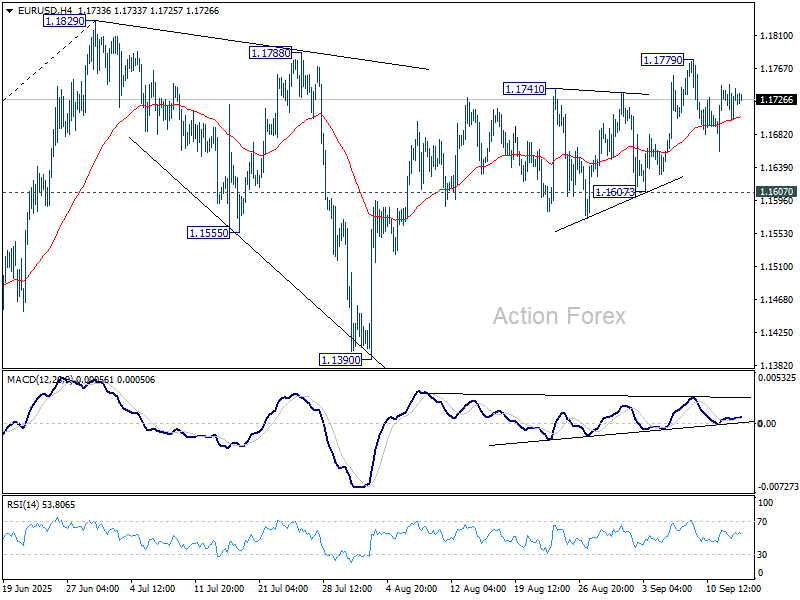
In the bigger picture, rise from 0.9534 (2022 low) long term bottom could be correcting the multi-decade downtrend or the start of a long term up trend. In either case, further rise should be seen to 100% projection of 0.9534 to 1.1274 from 1.0176 at 1.1916. This will remain the favored case as long as 55 W EMA (now at 1.1174) holds.