Sample Category Title
EUR/USD Weekly Outlook
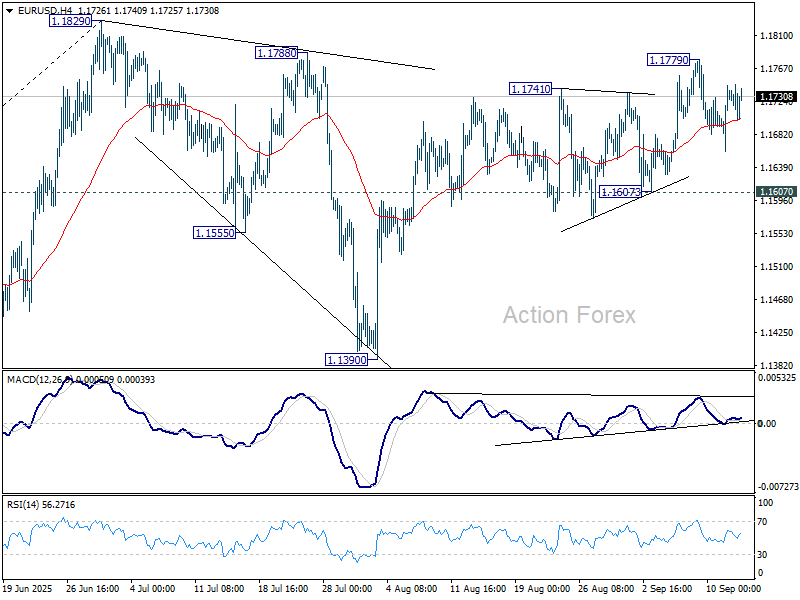
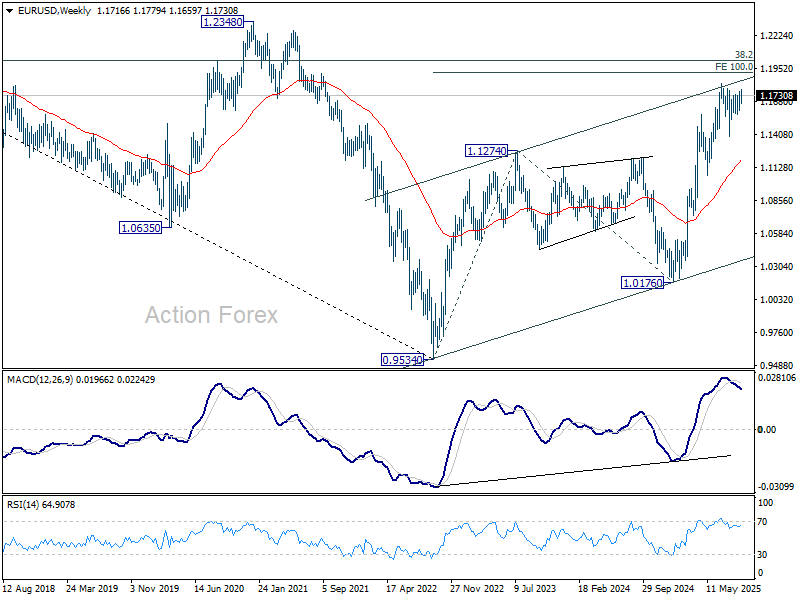
EUR/USD edged higher to 1.1779 last week but turned sideway since then. Initial bias remains neutral this week first, and further rise is expected as long as 1.1607 support holds. Above 1.1779 will target a retest of 1.1829 high. Firm break there will resume larger up trend to 1.1916 projection level next.
In the bigger picture, rise from 0.9534 (2022 low) long term bottom could be correcting the multi-decade downtrend or the start of a long term up trend. In either case, further rise should be seen to 100% projection of 0.9534 to 1.1274 from 1.0176 at 1.1916. This will remain the favored case as long as 55 W EMA (now at 1.1174) holds.
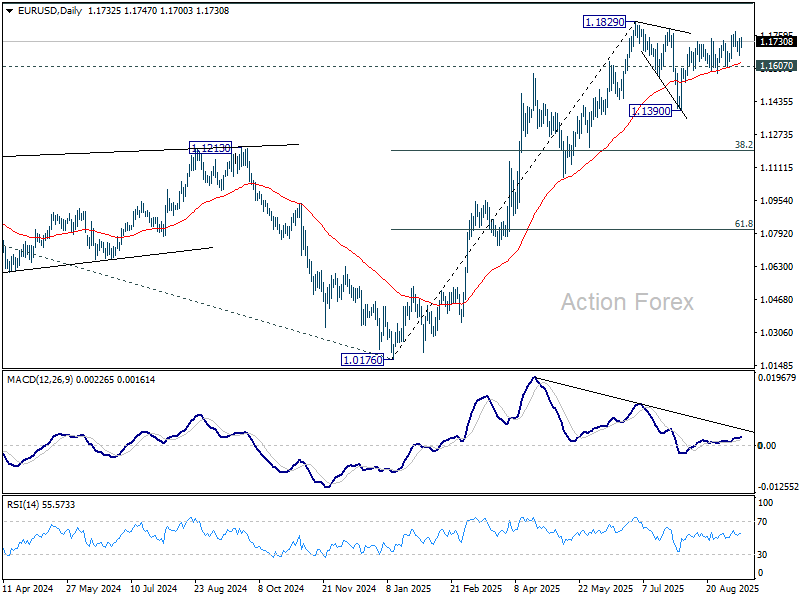
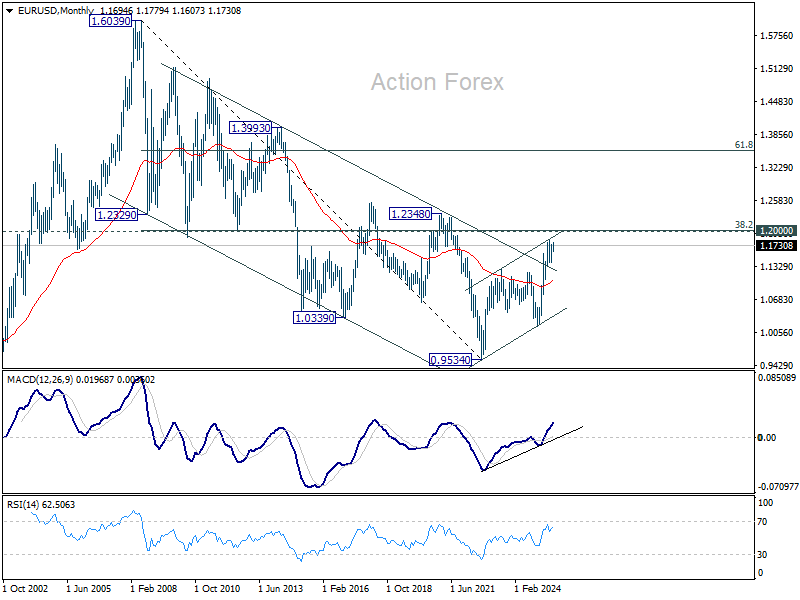
In the long term picture, a long term bottom was in place already at 0.9534, on bullish convergence condition in M MACD. Further rise should be seen to 38.2% retracement of 1.6039 (2008 high) to 0.9534 at 1.2019. Rejection by 1.2019 will keep the price actions from 0.9534 as a corrective pattern. But sustained break of 1.2019 will suggest long term bullish trend reversal, and target 61.8% retracement at 1.3554.
USD/JPY Weekly Outlook
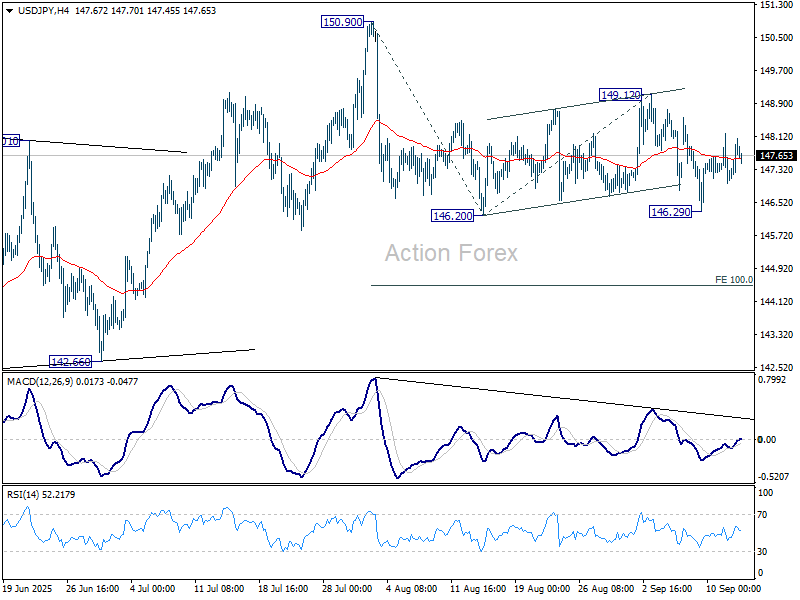
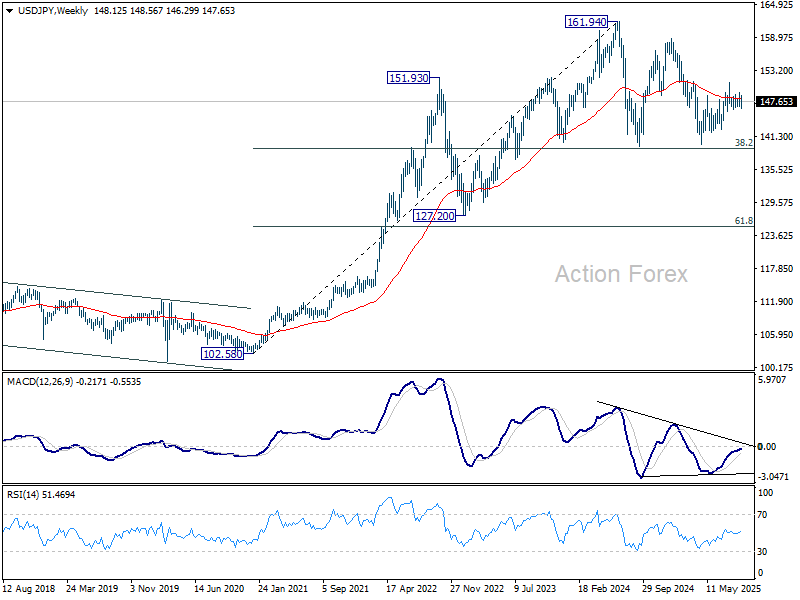
USD/JPY edged lower to 146.29 last week but quickly recovered. Initial bias remains neutral this week first. Further fall is in favor as long as 149.12 resistance holds. Firm break of 146.29 will solidify the case that whole rebound from 139.87 has completed with three waves up to 150.90. Deeper decline should then be seen to 100% projection of 150.90 to 146.20 from 149.12 at 144.42.
In the bigger picture, price actions from 161.94 (2024 high) are seen as a corrective pattern to rise from 102.58 (2021 low). Decisive break of 61.8% retracement of 158.86 to 139.87 at 151.22 will argue that it has already completed with three waves at 139.87. Larger up trend might then be ready to resume through 161.94 high. In case the corrective pattern extends with another fall, strong support is expected from 38.2% retracement of 102.58 to 161.94 at 139.26 to bring rebound.
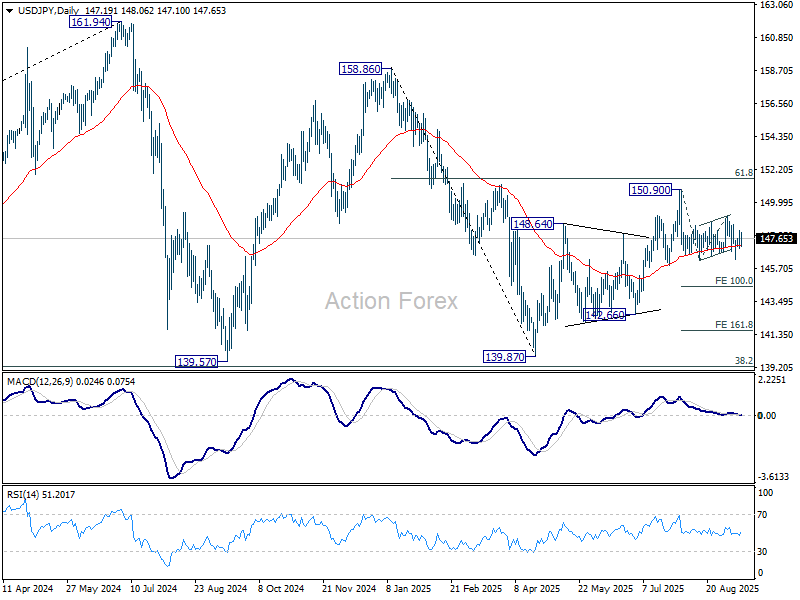
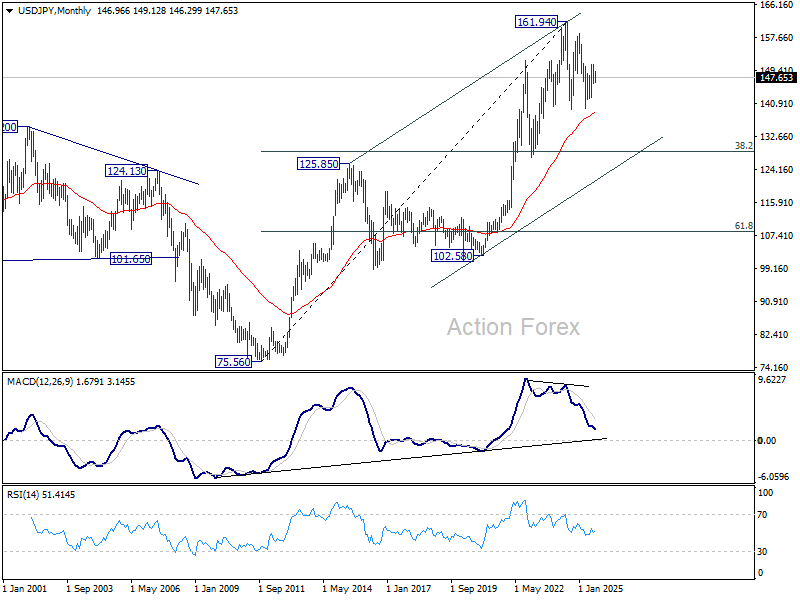
In the long term picture, there is no sign that up trend from 75.56 (2011 low) has completed. But then, firm break of 161.94 is needed to confirm resumption. Otherwise, more medium term range trading could still be seen.
GBP/USD Weekly Outlook
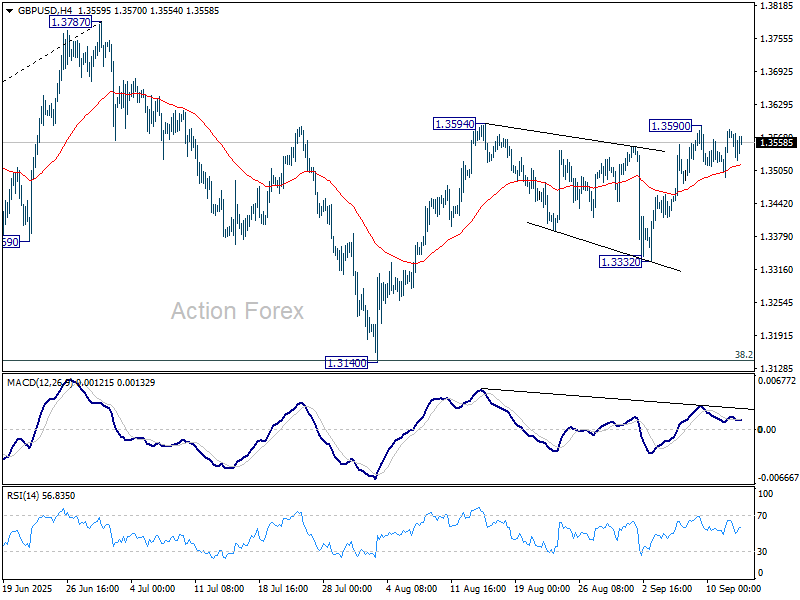
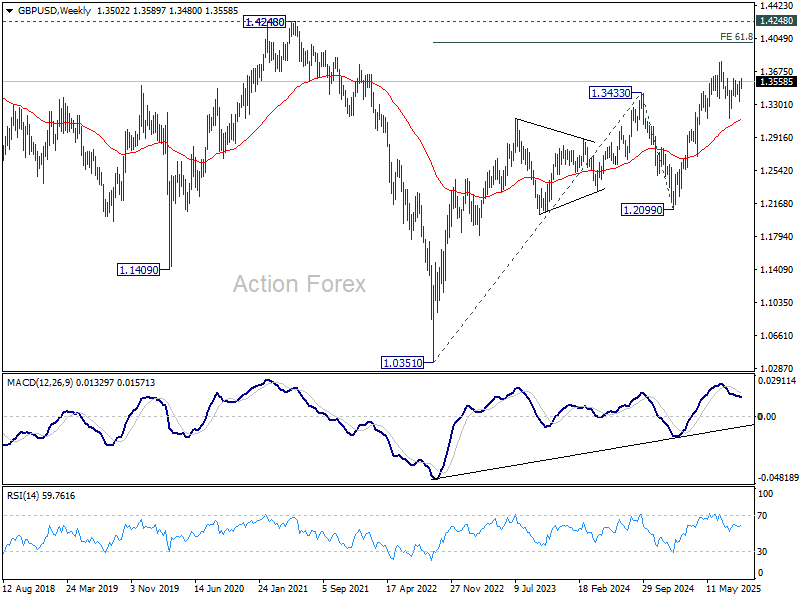
GBP/USD failed to break through 1.3594 resistance last week and turned sideway. Initial bias remains neutral this week first. Further rally is expected as long as 1.3332 support holds. Firm break of 1.3594 will resume the rebound from 1.3140 to retest 1.3787 high. Decisive break there will resume larger up trend.
In the bigger picture, up trend from 1.3051 (2022 low) is in progress. Next medium term target is 61.8% projection of 1.0351 to 1.3433 from 1.2099 at 1.4004. Outlook will now stay bullish as long as 55 W EMA (now at 1.3118) holds, even in case of deep pullback.
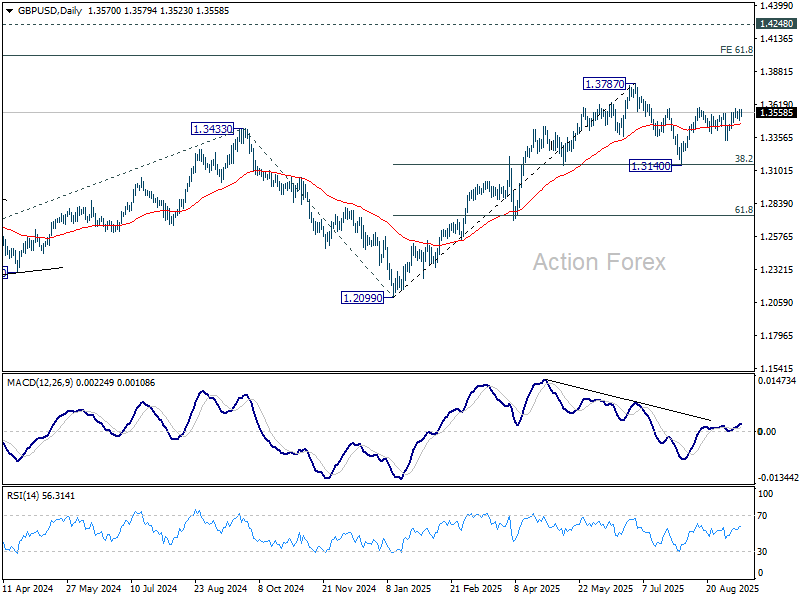
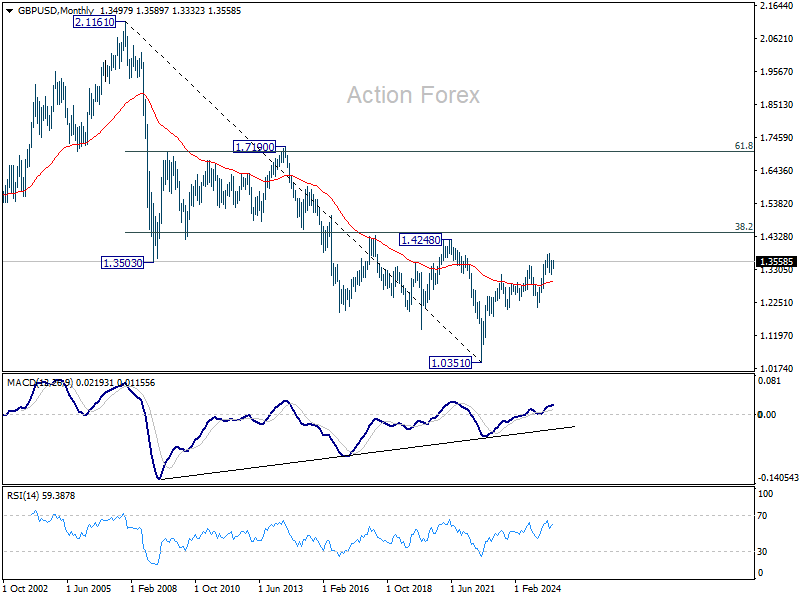
In the long term picture, for now, price actions from 1.0351 (2022 low) are still seen as a corrective pattern to the long term down trend from 2.1161 (2007 high) only. However, firm break of 1.4248 resistance (38.2% retracement of 2.1161 to 1.0351 at 1.4480) will be a strong sign of long term bullish reversal.
USD/CHF Weekly Outlook
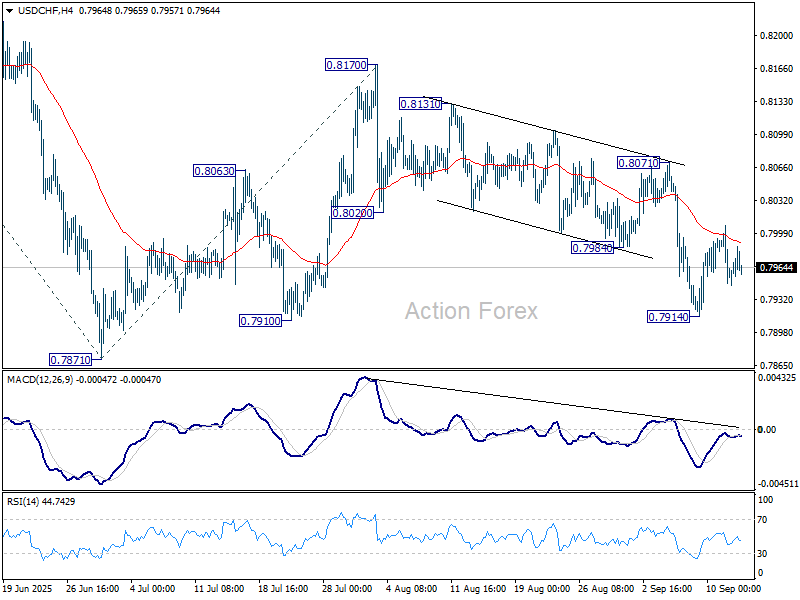
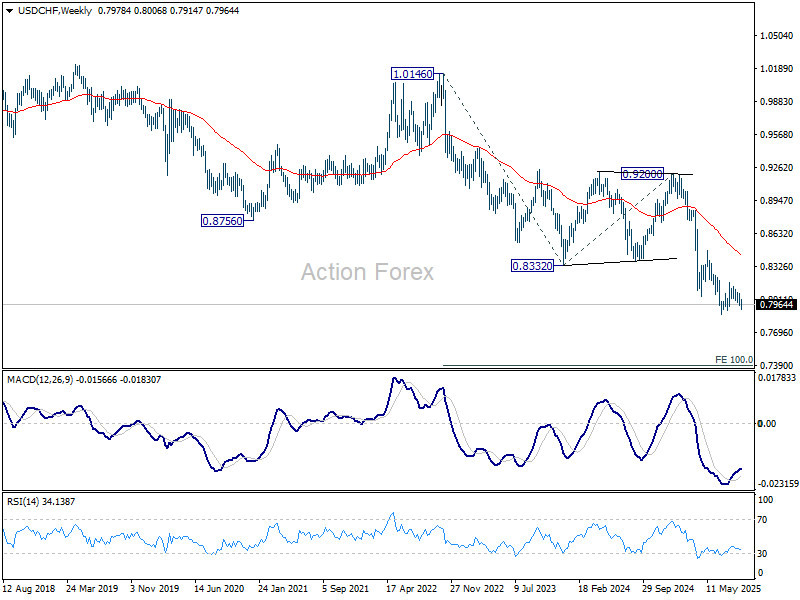
USD/CHF edged lower to 0.7914 last week but recovered since then. Initial bias remains neutral this week for some more consolidations. But further fall is expected as long as 0.8071 resistance holds. Below 0.7914 will bring retest of 0.7871 low. Decisive break there will resume larger down trend to 61.8% projection of 0.8475 to 0.7871 from 0.8170 at 0.7797.
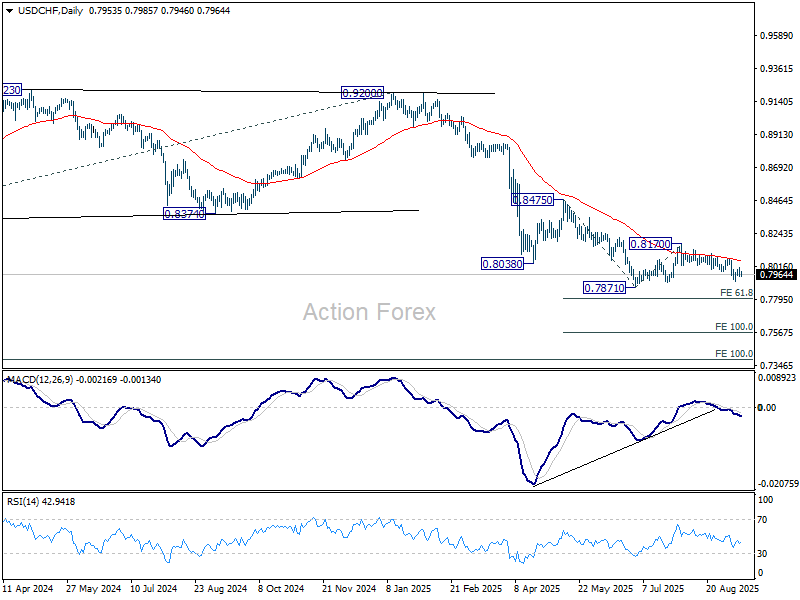
In the bigger picture, long term down trend from 1.0342 (2017 high) is still in progress. Next target is 100% projection of 1.0146 (2022 high) to 0.8332 from 0.9200 at 0.7382. In any case, outlook will stay bearish as long as 0.8332 support turned resistance holds.
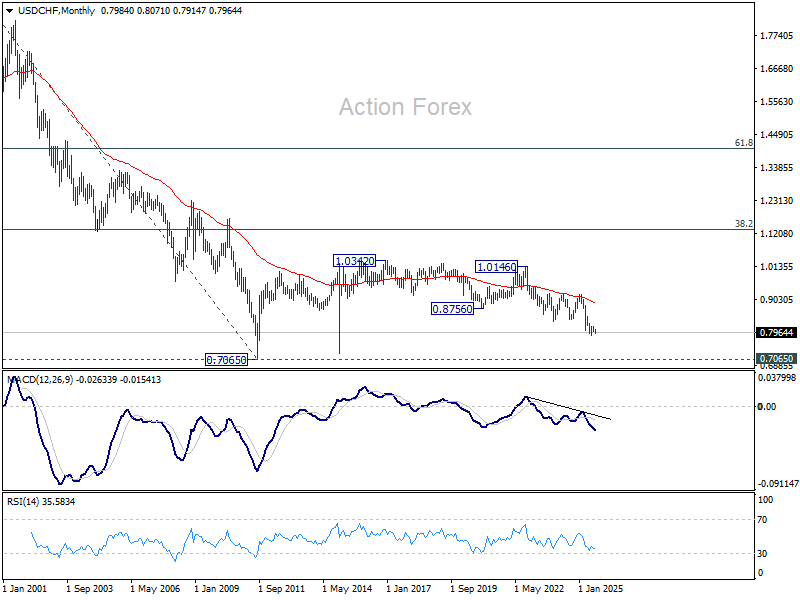
In the long term picture, price action from 0.7065 (2011 low) are seen as a corrective pattern to the multi-decade down trend from 1.8305 (2000 high). It's uncertain if the fall from 1.0342 is the second leg of the pattern, or resumption of the downtrend. But in either case, outlook will stay bearish as long as 0.9200 resistance holds. Retest of 0.7065 should be seen next.
AUD/USD Weekly Report
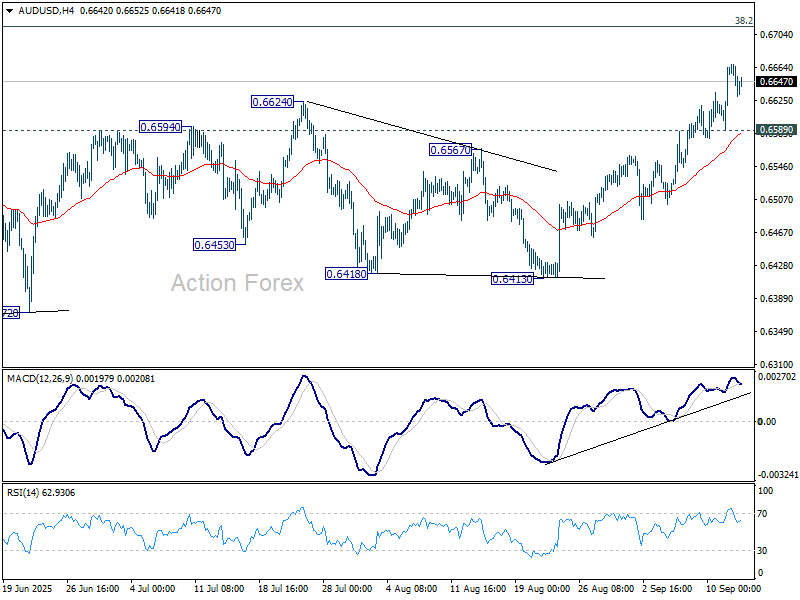
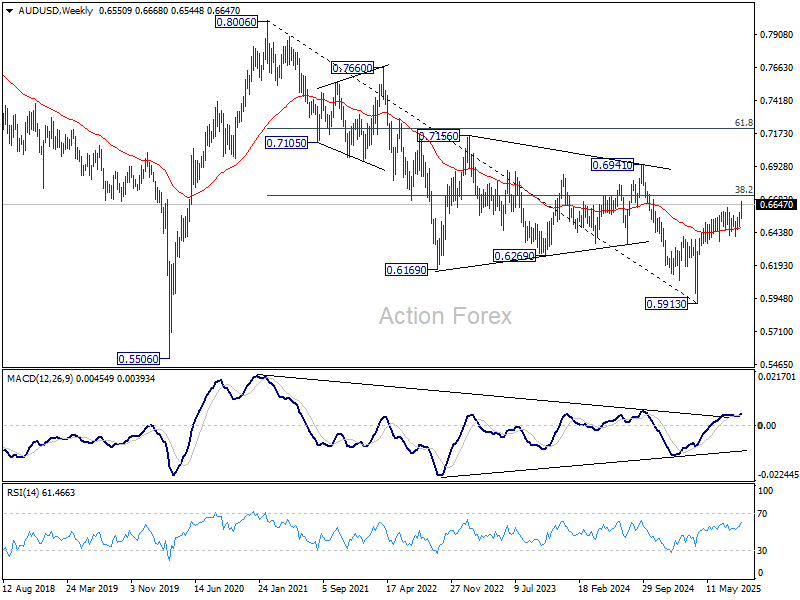
AUD/USD's rise from 0.5913 resumed through 0.6624 resistance last week. There is no sign of topping yet, and initial bias stays on the upside. Next target is 0.6713 fibonacci level. Firm break there will carry larger bullish implications. On the downside, below 0.6589 minor support will turn bias neutral and bring consolidations first, before staging another rally.
In the bigger picture, there is no clear sign that down trend from 0.8006 (2021 high) has completed. Rebound from 0.5913 is seen as a corrective move. While stronger rally cannot be ruled out, outlook will remain bearish as long as 38.2% retracement of 0.8006 to 0.5913 at 0.6713 holds. Nevertheless, considering bullish convergence condition in W MACD, sustained break of 0.6713 will be a strong sign of bullish trend reversal, and path the way to 0.6941 structural resistance for confirmation.
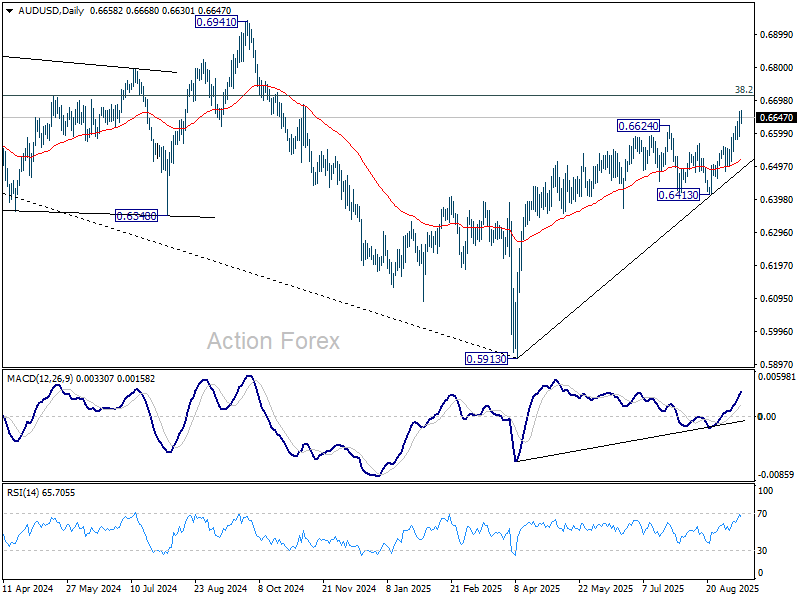
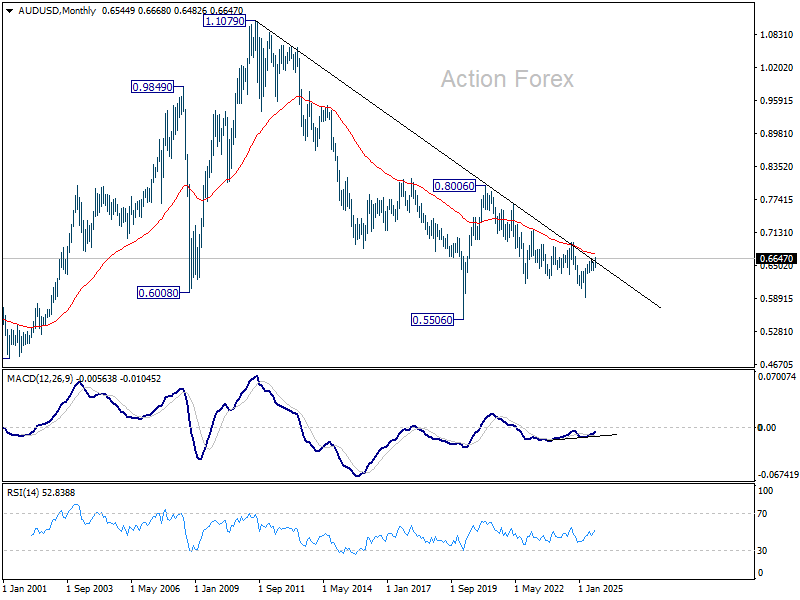
In the long term picture, fall from 0.8006 is seen as the second leg of the corrective pattern from 0.5506 long term bottom (2020 low). Hence, in case of deeper decline, strong support should emerge above 0.5506 to contain downside to bring reversal. On the upside, firm break of 0.6941 will argue that the third leg has already started back to 0.8006.
USD/CAD Weekly Outlook
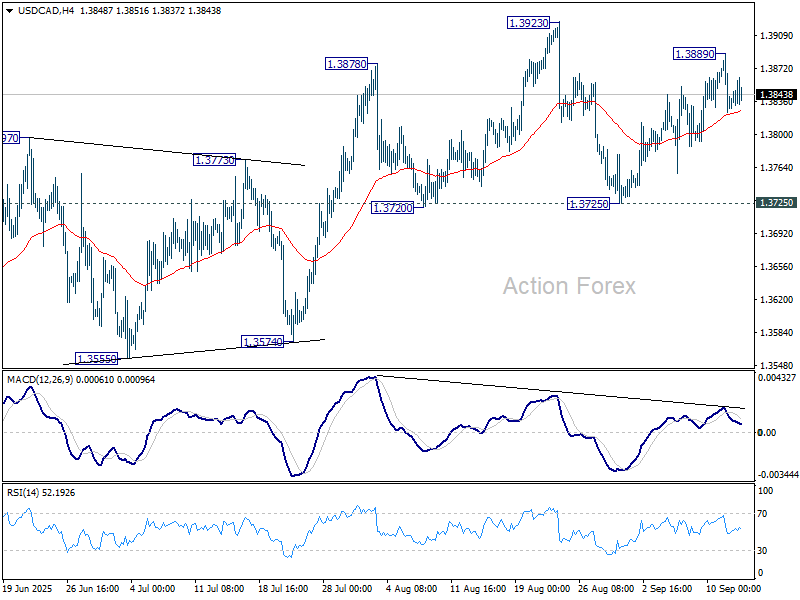
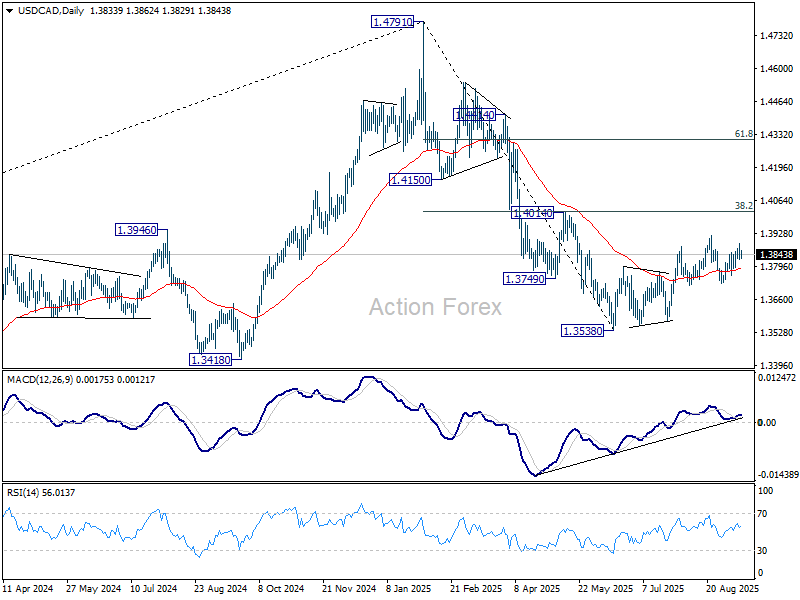
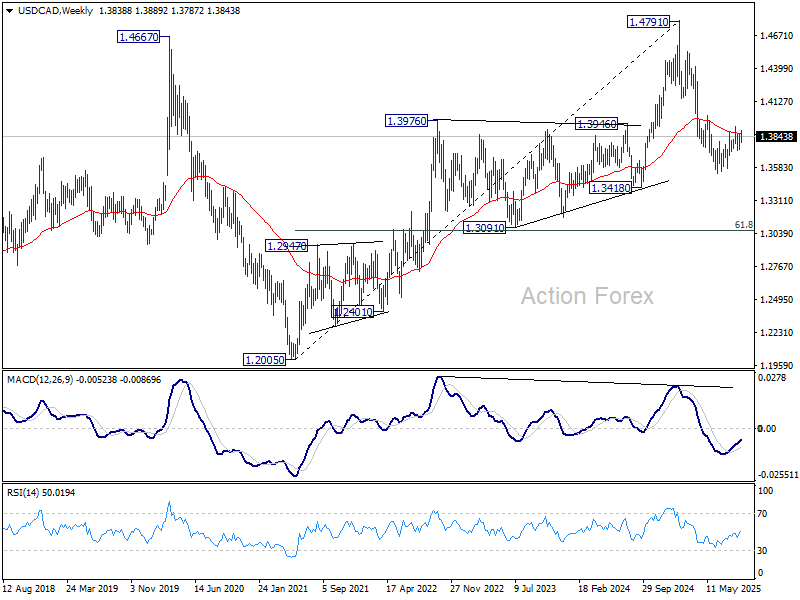
USD/CAD recovered to 1.3889 last week but lost momentum since then. Initial bias remains neutral this week first. On the downside, firm break of 1.3725 support will indicate that corrective rebound from 1.3538 has already completed, and turn near term outlook bearish. However, break of 1.3923 will resume the rebound towards 1.4014 cluster resistance.
In the bigger picture, price actions from 1.4791 medium term top could either be a correction to rise from 1.2005 (2021 low), or trend reversal. In either case, further decline is expected as long as 1.4014 cluster resistance (38.2% retracement of 1.4791 to 1.3538 at 1.4017) holds. Next target is 61.8% retracement of 1.2005 (2021 low) to 1.4791 at 1.3069.
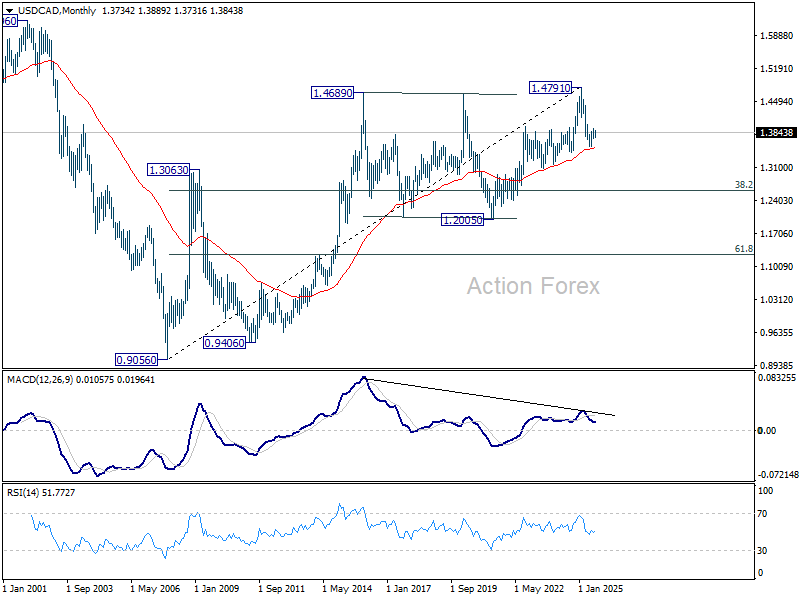
In the long term picture, considering bearish divergence condition in M MACD, up trend from 0.9506 (2027 low) might have completed with five waves up to 1.4791. Sustained trading below 55 M EMA (now at 1.3511) will solidify this case and bring deeper medium term fall to 38.2% retracement of 0.9056 to 1.4791 at 1.2600, even as a correction. Nevertheless, strong rebound from the 55 E MEA will retain bullishness for up trend resumption through 1.4791 later.
GBP/JPY Weekly Outlook
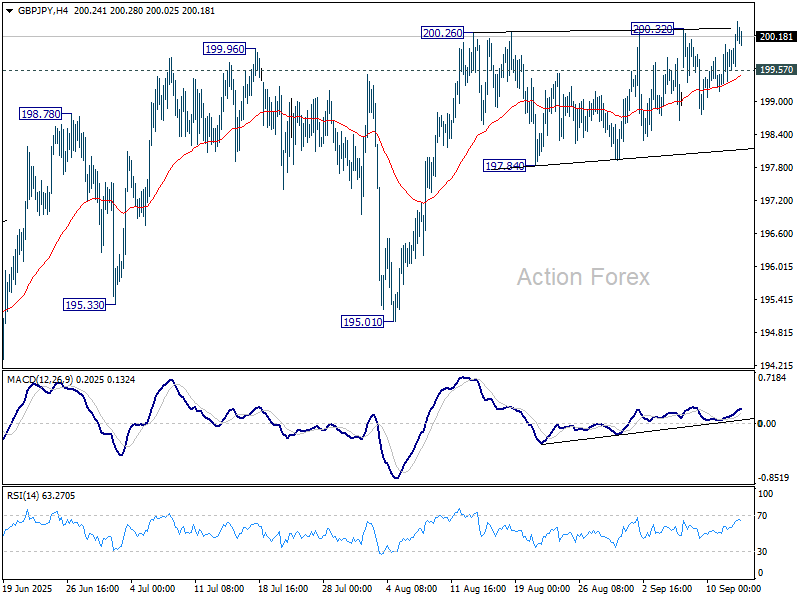
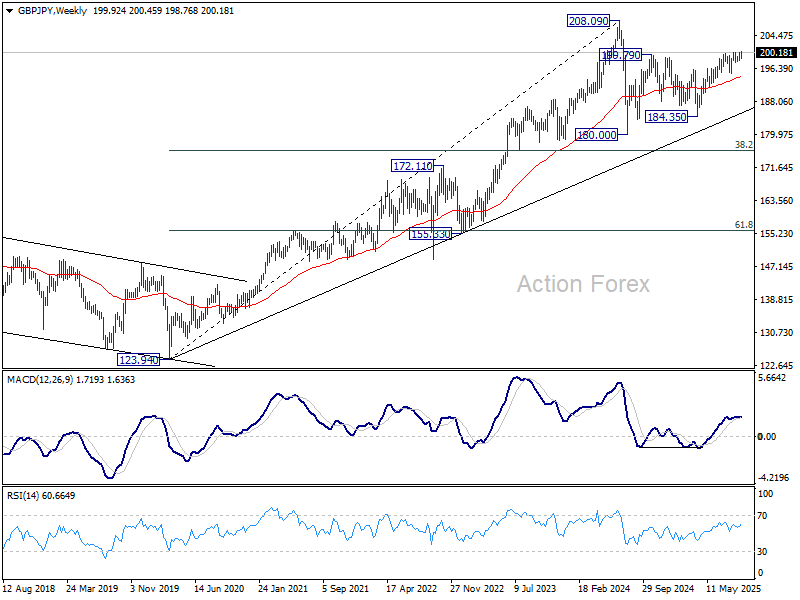
GBP/JPY's late breach of 200.26/32 resistance suggests that rise from 184.35 is resuming. Initial bias is mildly on the upside this week. Sustained trading above 200.32 will target 100% projection of 180.00 to 199.79 from 184.35 at 204.14. Nevertheless, break of 199.57 minor support will delay the bullish case and turn intraday bias neutral again.
In the bigger picture, price actions from 208.09 (2024 high) are seen as a correction to rally from 123.94 (2020 low). The pattern might still extend with another falling leg. But in that case, strong support should be seen from 38.2% retracement of 123.94 to 208.09 at 175.94 to contain downside. Meanwhile, decisive break of 208.09 will confirm long term up trend resumption.
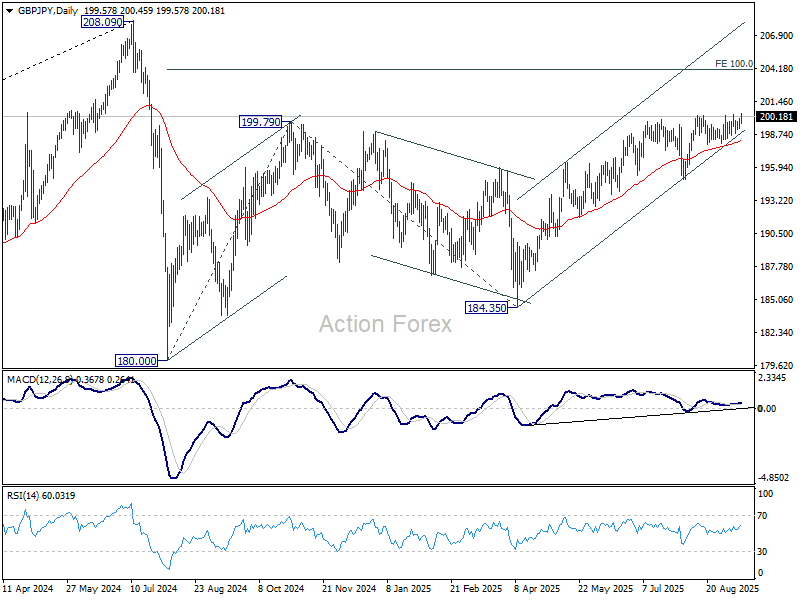
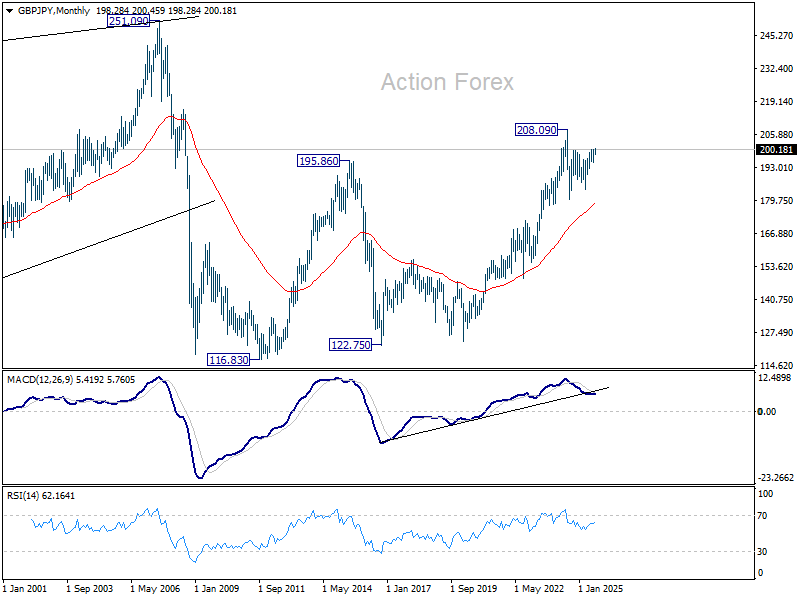
In the long term picture, there is no sign that the long term up trend from 122.75 (2016 low) has concluded. But firm break of 208.09 is needed to confirm resumption. Otherwise, more medium term range trading could still be seen.
EUR/JPY Weekly Outlook
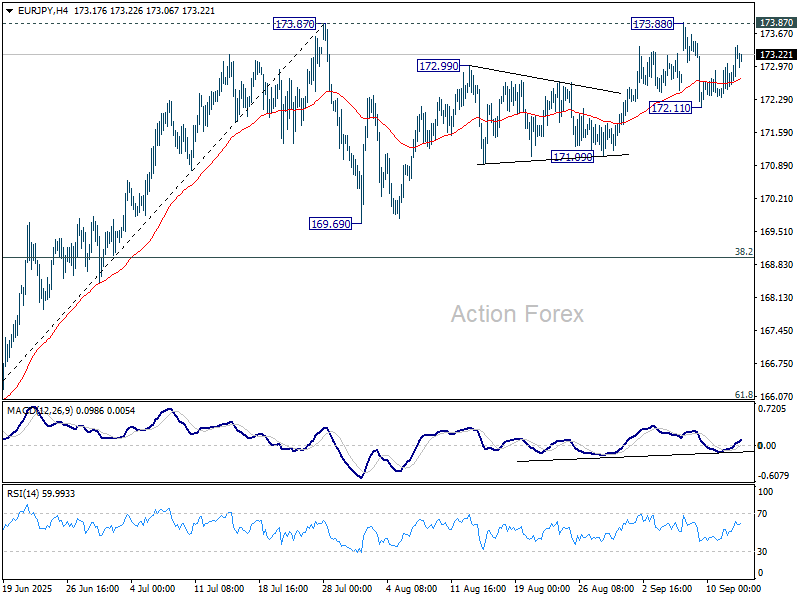
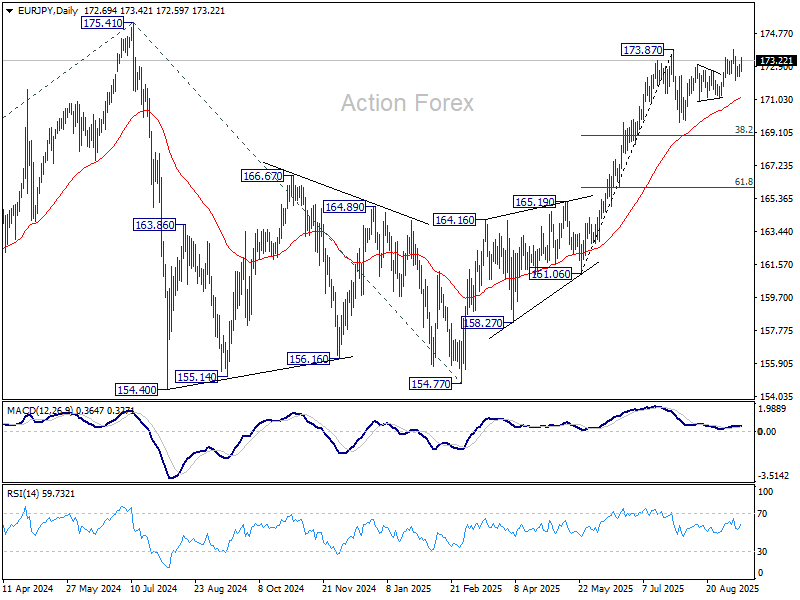
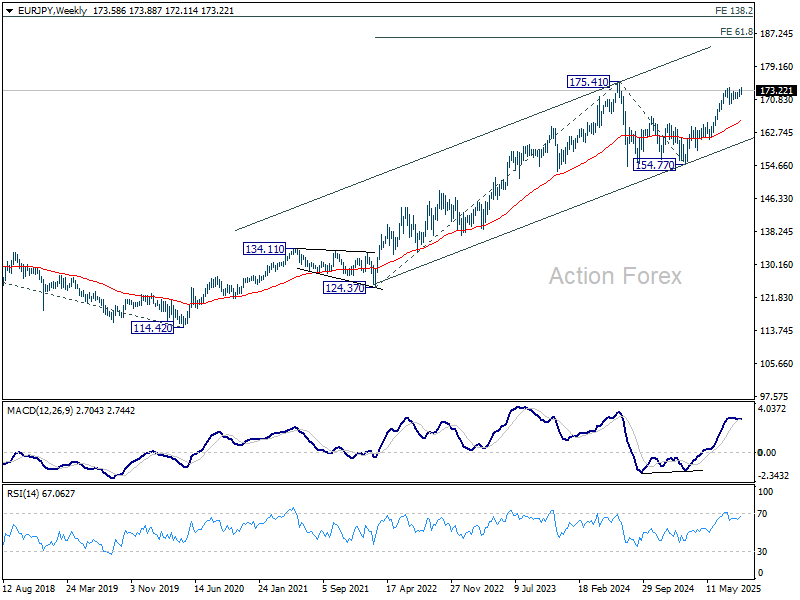
EUR/JPY edged higher to 173.88 last week, but was rejected by 173.87 resistance and retreated. Initial bias stays neutral this week first. On the upside, firm break of 173.87/8 will resume the rally from 154.77 to retest 175.41 high. However, break of 172.11 will extend the corrective pattern from 173.87 with another fall. Bias will be back to the downside for 171.09 support first.
In the bigger picture, current rally from 154.77 is still tentatively seen as resuming the larger up trend. Firm break of 175.41 (2024 high) will confirm and target 61.8% projection of 124.37 to 175.41 from 154.77 at 186.31. However, sustained break of 38.2% retracement of 161.06 to 173.87 at 168.97 will delay this bullish case, and probably extend the correction from 175.41 with another fall.
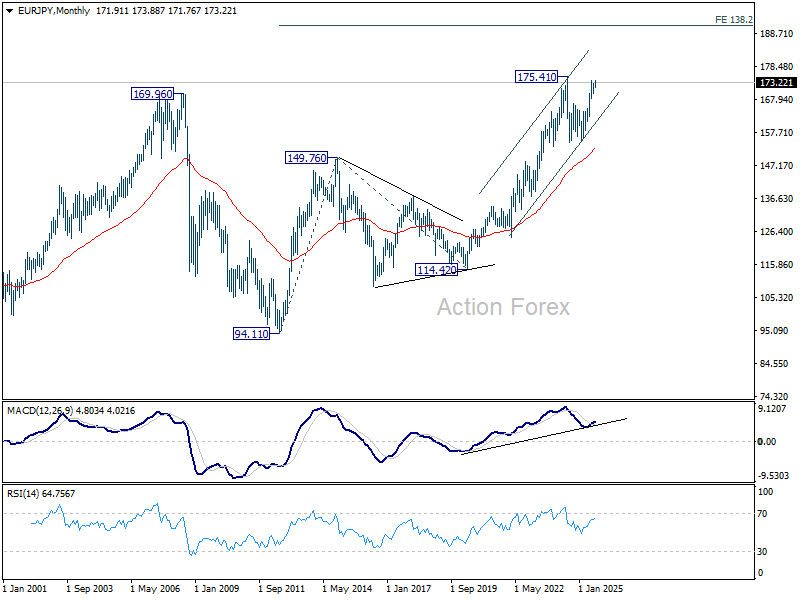
In the long term picture, up trend from 94.11 (2021 low) is still in progress. On resumption, next target is 138.2% projection of 94.11 to 149.76 (2014 high) from 114.42 (2020 low) at 191.32.
EUR/GBP Weekly Outlook
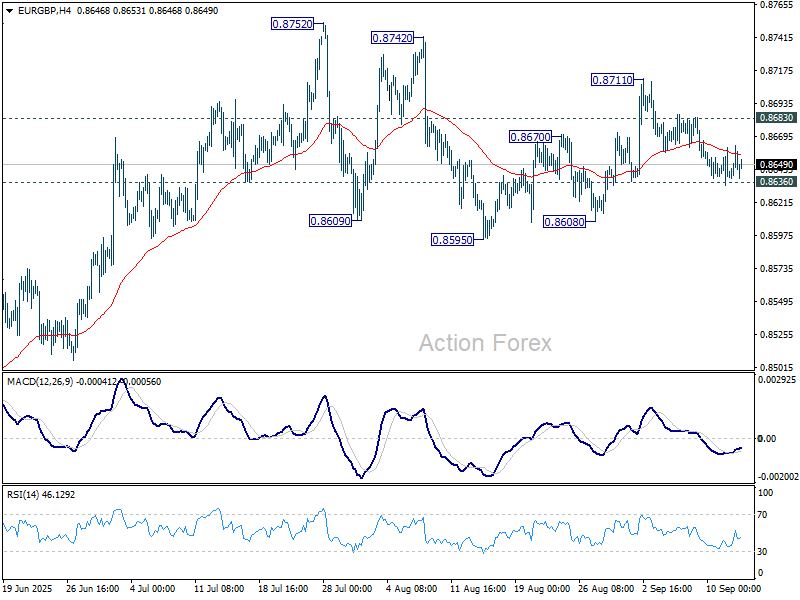
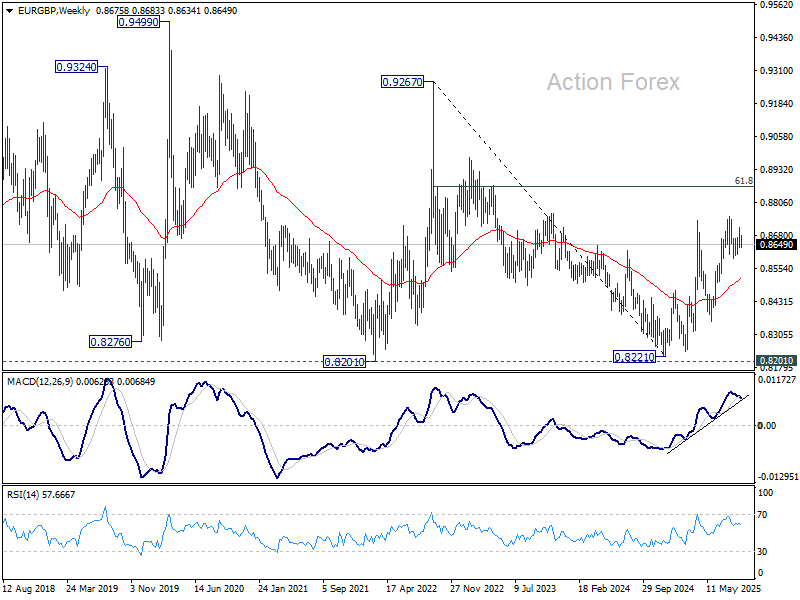
EUR/GBP gyrated lower last week as fall from 0.8711 extended, but turned sideway after breaching 0.8636 support briefly. Initial bias stays neutral this week first. On the upside, break of 0.8683 minor resistance will extend the rebound from 0.8595 through 0.8711 to retest 0.8752 high. However, firm break of 0.8636 will turn bias to the downside for 0.8595 support instead.
In the bigger picture, the structure from 0.8221 medium term bottom are not impulsive enough to suggest that it's reversing the down trend from 0.9267 (2022 high). But even if it's a correction, further rise could still be seen to 61.8% retracement of 0.9267 to 0.8221 at 0.8867. Nevertheless, sustained trading below 55 W EMA (now at 0.8518) will argue that the pattern has completed and bring retest of 0.8221 low.
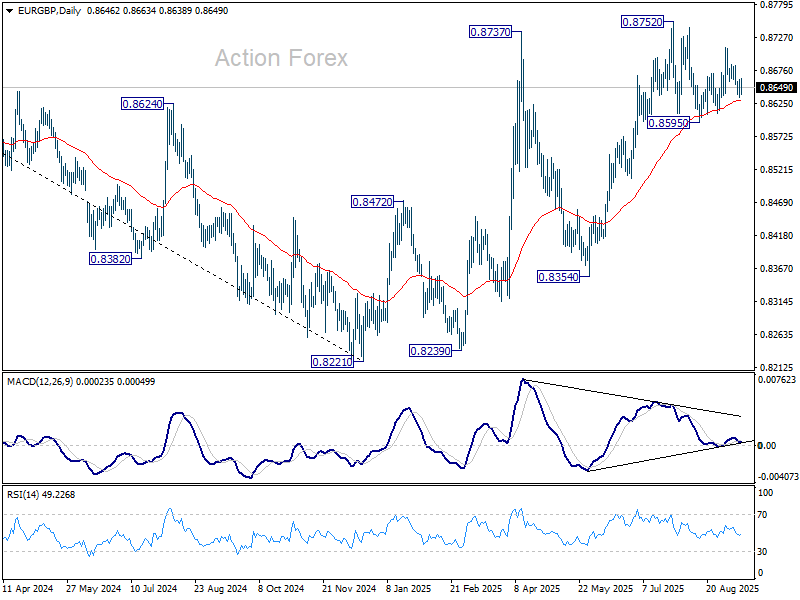
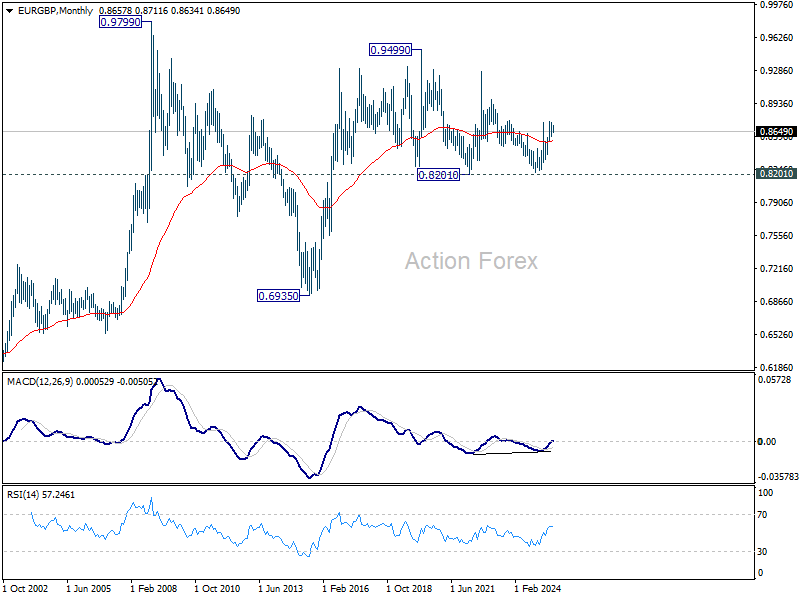
In the long term picture, price action from 0.9499 (2020 high) is seen as part of the long term range pattern from 0.9799 (2008 high). Range trading should continue between 0.8201 and 0.9499, until there is clear signal of imminent breakout.
EUR/AUD Weekly Outlook
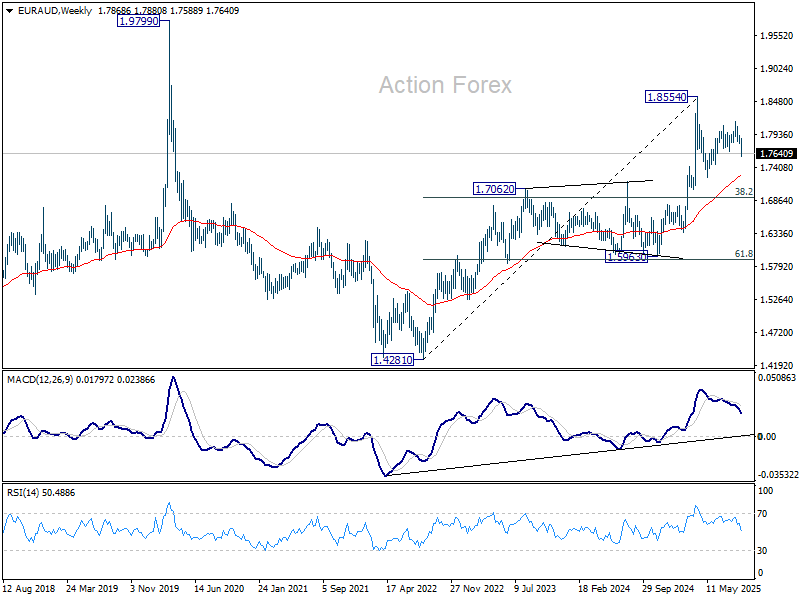
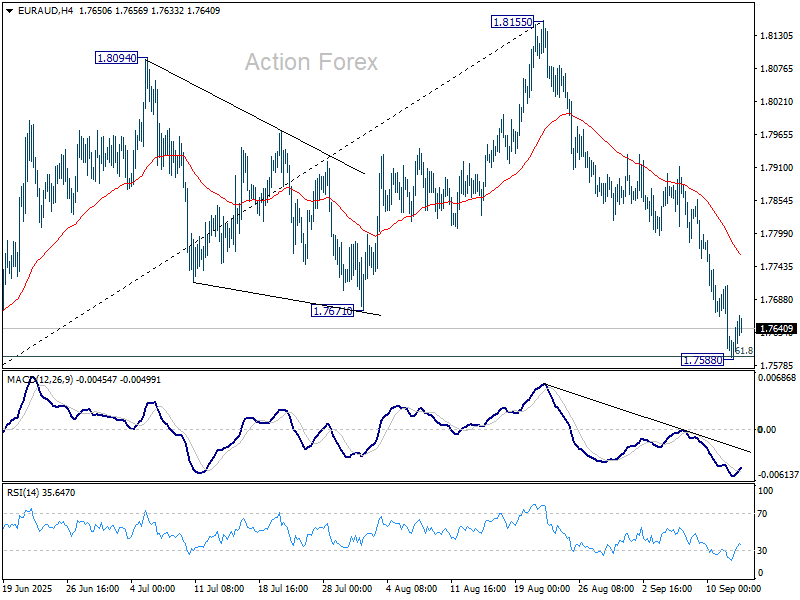
EUR/AUD's fall from 1.8155 extended lower last week but recovered after hitting 61.8% retracement of 1.7245 to 1.8155 at 1.7593. Initial bias is turned neutral this week for some consolidations first. While stronger recovery cannot be ruled out, further decline is expected as long as 55 D EMA (now at 1.77812) holds. Corrective pattern from 1.8554 is in the third leg. Sustained trading below 1.7593 will target 1.7245 support and possibly below.
In the bigger picture, price actions from 1.8554 medium term top are seen as a corrective pattern. Deeper fall could be seen as the pattern extends, but downside should be contained by 38.2% retracement of 1.4281 (2022 low) to 1.8554 at 1.6922 to bring rebound. Uptrend from 1.4281 is expected to resume at a later stage.
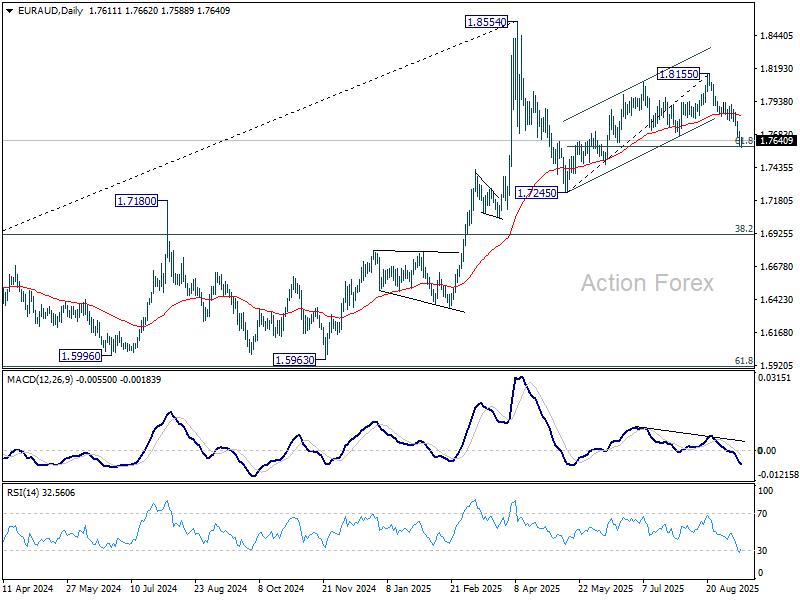
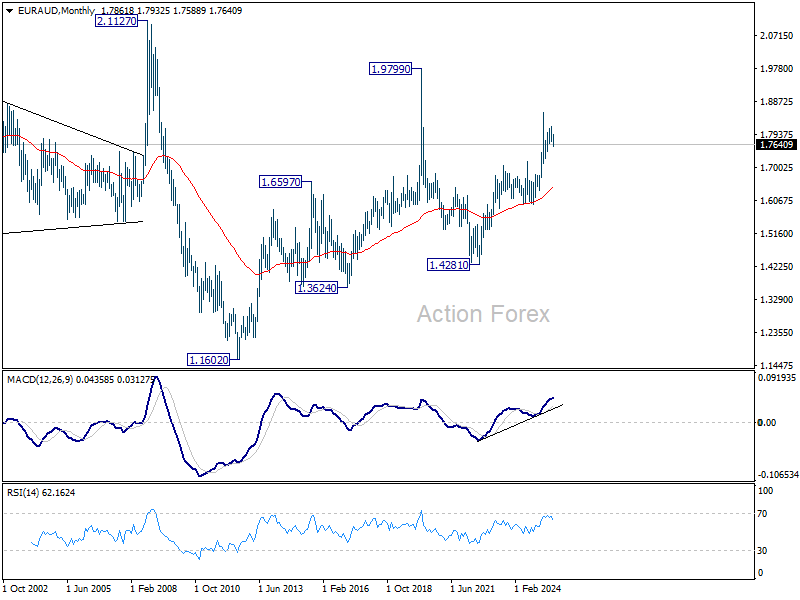
In the longer term picture, rise from 1.4281 is seen as the second leg of the pattern from 1.9799 (2020 high), which is part of the pattern from 2.1127 (2008 high). As long as 55 M EMA (now at 1.6464) holds, this second leg could still extend higher.