Sample Category Title
EUR/CHF Weekly Outlook
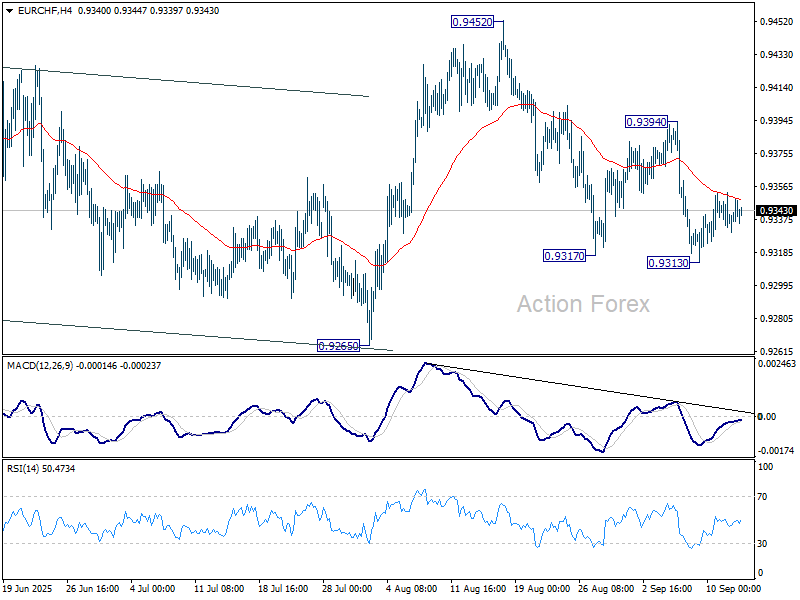
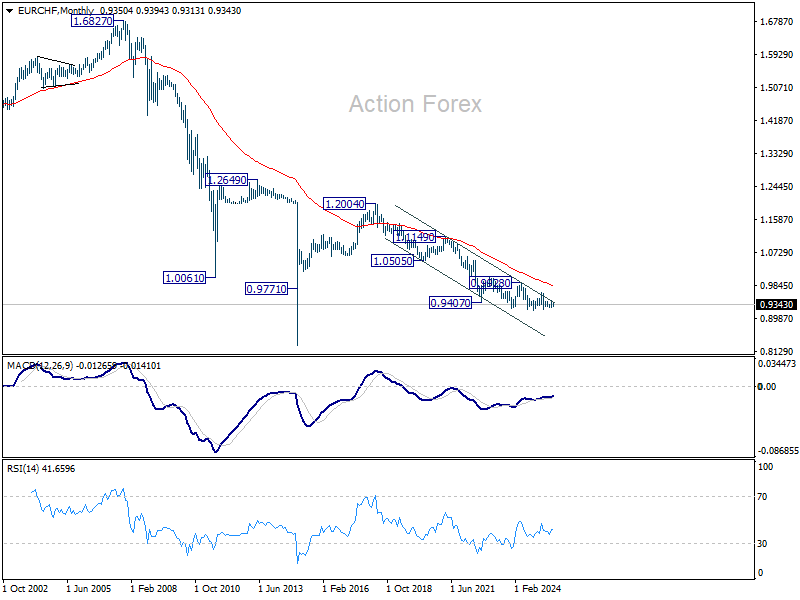
EUR/CHF edged lower to 0.9313 last week but quickly recovered. Initial bias stays neutral this week first. Risk will stay on the downside as long as 0.9394 resistance holds. Break of 0.9313 will resume the decline from 0.9452 to retest 0.9218 low. On the upside, break of 0.9394 will bring stronger rally towards 0.9452 resistance instead.
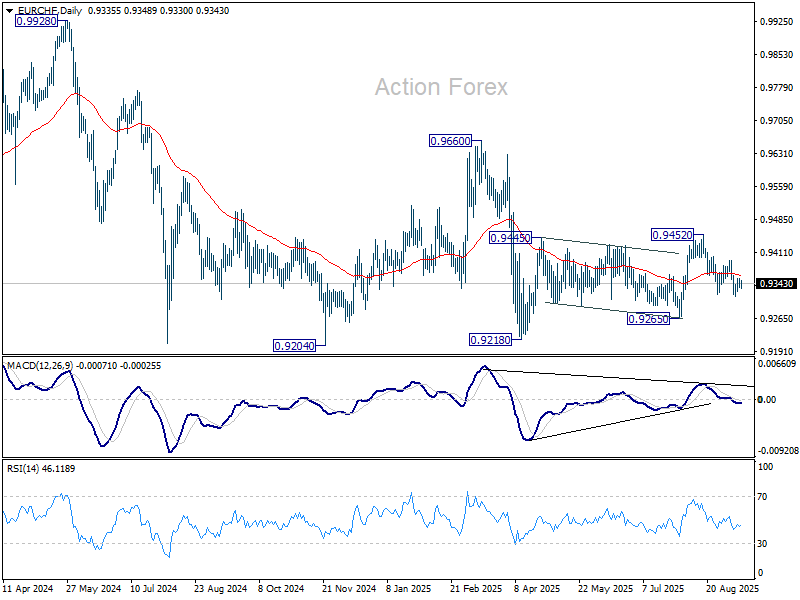
In the bigger picture, the down trend from 0.9204 (2018 high) might still be in progress considering that EUR/CHF is staying well inside the long term falling channel. However, with bullish convergence condition in W MACD, downside potential should be limited in case of another fall. Instead, firm break of 0.9660 resistance will be an important sign of medium term bullish trend reversal.
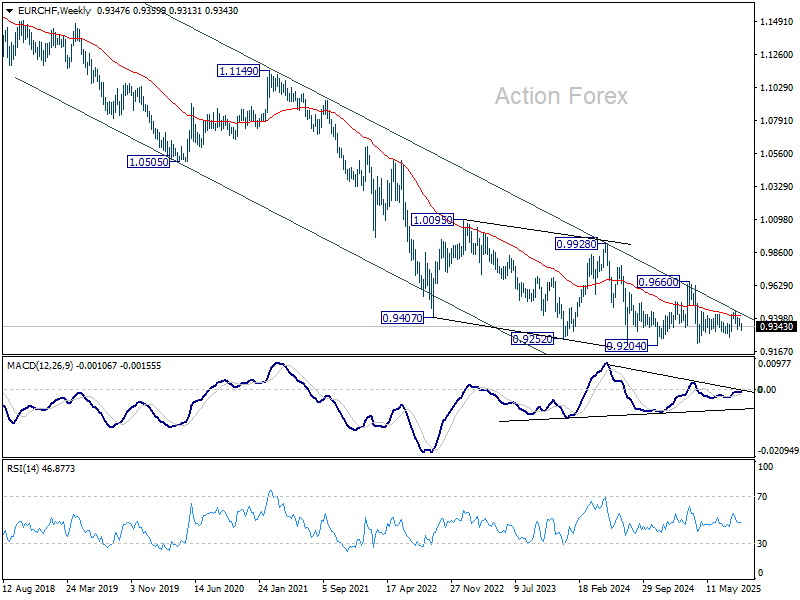
In the long term picture, overall long term down trend is still in progress in EUR/CHF. Outlook will continue to stay bearish as long as 55 M EMA (now at 0.9839) holds.
Summary 9/15 – 9/19
Monday, Sep 15, 2025
| GMT | Ccy | Events | Consensus | Previous |
|---|---|---|---|---|
| 22:30 | NZD | Business NZ PSI Aug | 48.9 | |
| 02:00 | CNY | Industrial Production Y/Y Aug | 5.80% | 5.70% |
| 02:00 | CNY | Retail Sales Y/Y Aug | 3.80% | 3.70% |
| 02:00 | CNY | Fixed Asset Investment YTD Y/Y Aug | 1.40% | 1.60% |
| 06:30 | CHF | Producer and Import Prices M/M Aug | 0.10% | -0.20% |
| 06:30 | CHF | Producer and Import Prices Y/Y Aug | -0.90% | |
| 09:00 | EUR | Eurozone Trade Balance (EUR) Jul | 12.2B | 2.8B |
| 12:30 | CAD | Manufacturing Sales M/M Jul | 1.80% | 0.30% |
| 12:30 | CAD | Wholesales Sales M/M Jul | 1.30% | 0.70% |
| 12:30 | USD | Empire State Manufacturing Sep | 3 | 11.9 |
| GMT | Ccy | Events | |
|---|---|---|---|
| 22:30 | NZD | Business NZ PSI Aug | |
| Forecast: | Previous: 48.9 | ||
| 02:00 | CNY | Industrial Production Y/Y Aug | |
| Forecast: 5.80% | Previous: 5.70% | ||
| 02:00 | CNY | Retail Sales Y/Y Aug | |
| Forecast: 3.80% | Previous: 3.70% | ||
| 02:00 | CNY | Fixed Asset Investment YTD Y/Y Aug | |
| Forecast: 1.40% | Previous: 1.60% | ||
| 06:30 | CHF | Producer and Import Prices M/M Aug | |
| Forecast: 0.10% | Previous: -0.20% | ||
| 06:30 | CHF | Producer and Import Prices Y/Y Aug | |
| Forecast: | Previous: -0.90% | ||
| 09:00 | EUR | Eurozone Trade Balance (EUR) Jul | |
| Forecast: 12.2B | Previous: 2.8B | ||
| 12:30 | CAD | Manufacturing Sales M/M Jul | |
| Forecast: 1.80% | Previous: 0.30% | ||
| 12:30 | CAD | Wholesales Sales M/M Jul | |
| Forecast: 1.30% | Previous: 0.70% | ||
| 12:30 | USD | Empire State Manufacturing Sep | |
| Forecast: 3 | Previous: 11.9 | ||
Tuesday, Sep 16, 2025
| GMT | Ccy | Events | Consensus | Previous |
|---|---|---|---|---|
| 04:30 | JPY | Tertiary Industry Index M/M Jul | 0.20% | 0.50% |
| 06:00 | GBP | Claimant Count Change Aug | 20.3K | -6.2K |
| 06:00 | GBP | ILO Unemployment Rate (3M) Jul | 4.70% | 4.70% |
| 06:00 | GBP | Average Earnings Excluding Bonus 3M/Y Jul | 4.80% | 5.00% |
| 06:00 | GBP | Average Earnings Including Bonus 3M/Y Jul | 4.70% | 4.60% |
| 09:00 | EUR | Eurozone Industrial Production M/M Jul | 0.50% | -1.30% |
| 09:00 | EUR | Germany ZEW Economic Sentiment Sep | 25 | 34.7 |
| 09:00 | EUR | Germany ZEW Current Situation Sep | -65 | -68.6 |
| 09:00 | EUR | Eurozone ZEW Economic Sentiment Sep | 20.3 | 25.1 |
| 12:15 | CAD | Housing Starts Aug | 273K | 294.1K |
| 12:30 | CAD | CPI M/M Aug | 0.10% | 0.30% |
| 12:30 | CAD | CPI Y/Y Aug | 1.70% | |
| 12:30 | CAD | CPI Median Y/Y Aug | 3.10% | 3.10% |
| 12:30 | CAD | CPI Trimmed Y/Y Aug | 3.00% | 3.00% |
| 12:30 | CAD | CPI Common Y/Y Aug | 2.60% | 2.60% |
| 12:30 | USD | Retail Sales M/M Aug | 0.20% | 0.50% |
| 12:30 | USD | Retail Sales ex Autos M/M Aug | 0.30% | 0.30% |
| 12:30 | USD | Import Price Index M/M Aug | -0.20% | 0.40% |
| 13:15 | USD | Industrial Production M/M Aug | 0.00% | -0.10% |
| 13:15 | USD | Capacity Utilization Aug | 77.40% | 77.50% |
| 14:00 | USD | Business Inventories Jul | 0.20% | 0.20% |
| 21:00 | NZD | Westpac Consumer Sentiment Q3 | 91.2 | |
| 22:45 | NZD | Current Account (NZD) Q2 | -2.65B | -2.32B |
| 23:50 | JPY | Trade Balance (JPY) Aug | -0.34T | -0.30T |
| GMT | Ccy | Events | |
|---|---|---|---|
| 04:30 | JPY | Tertiary Industry Index M/M Jul | |
| Forecast: 0.20% | Previous: 0.50% | ||
| 06:00 | GBP | Claimant Count Change Aug | |
| Forecast: 20.3K | Previous: -6.2K | ||
| 06:00 | GBP | ILO Unemployment Rate (3M) Jul | |
| Forecast: 4.70% | Previous: 4.70% | ||
| 06:00 | GBP | Average Earnings Excluding Bonus 3M/Y Jul | |
| Forecast: 4.80% | Previous: 5.00% | ||
| 06:00 | GBP | Average Earnings Including Bonus 3M/Y Jul | |
| Forecast: 4.70% | Previous: 4.60% | ||
| 09:00 | EUR | Eurozone Industrial Production M/M Jul | |
| Forecast: 0.50% | Previous: -1.30% | ||
| 09:00 | EUR | Germany ZEW Economic Sentiment Sep | |
| Forecast: 25 | Previous: 34.7 | ||
| 09:00 | EUR | Germany ZEW Current Situation Sep | |
| Forecast: -65 | Previous: -68.6 | ||
| 09:00 | EUR | Eurozone ZEW Economic Sentiment Sep | |
| Forecast: 20.3 | Previous: 25.1 | ||
| 12:15 | CAD | Housing Starts Aug | |
| Forecast: 273K | Previous: 294.1K | ||
| 12:30 | CAD | CPI M/M Aug | |
| Forecast: 0.10% | Previous: 0.30% | ||
| 12:30 | CAD | CPI Y/Y Aug | |
| Forecast: | Previous: 1.70% | ||
| 12:30 | CAD | CPI Median Y/Y Aug | |
| Forecast: 3.10% | Previous: 3.10% | ||
| 12:30 | CAD | CPI Trimmed Y/Y Aug | |
| Forecast: 3.00% | Previous: 3.00% | ||
| 12:30 | CAD | CPI Common Y/Y Aug | |
| Forecast: 2.60% | Previous: 2.60% | ||
| 12:30 | USD | Retail Sales M/M Aug | |
| Forecast: 0.20% | Previous: 0.50% | ||
| 12:30 | USD | Retail Sales ex Autos M/M Aug | |
| Forecast: 0.30% | Previous: 0.30% | ||
| 12:30 | USD | Import Price Index M/M Aug | |
| Forecast: -0.20% | Previous: 0.40% | ||
| 13:15 | USD | Industrial Production M/M Aug | |
| Forecast: 0.00% | Previous: -0.10% | ||
| 13:15 | USD | Capacity Utilization Aug | |
| Forecast: 77.40% | Previous: 77.50% | ||
| 14:00 | USD | Business Inventories Jul | |
| Forecast: 0.20% | Previous: 0.20% | ||
| 21:00 | NZD | Westpac Consumer Sentiment Q3 | |
| Forecast: | Previous: 91.2 | ||
| 22:45 | NZD | Current Account (NZD) Q2 | |
| Forecast: -2.65B | Previous: -2.32B | ||
| 23:50 | JPY | Trade Balance (JPY) Aug | |
| Forecast: -0.34T | Previous: -0.30T | ||
Wednesday, Sep 17, 2025
| GMT | Ccy | Events | Consensus | Previous |
|---|---|---|---|---|
| 00:30 | AUD | Westpac Leading Index M/M Aug | 0.10% | |
| 06:00 | GBP | CPI M/M Aug | 0.10% | |
| 06:00 | GBP | CPI Y/Y Aug | 3.80% | 3.80% |
| 06:00 | GBP | Core CPI Y/Y Aug | 3.70% | 3.80% |
| 06:00 | GBP | RPI M/M Aug | 0.40% | |
| 06:00 | GBP | RPI Y/Y Aug | 4.70% | 4.80% |
| 09:00 | EUR | Eurozone CPI Y/Y Aug F | 2.10% | 2.10% |
| 09:00 | EUR | Eurozone Core CPI Y/Y Aug F | 2.30% | 2.30% |
| 12:30 | USD | Building Permits Aug | 1.37M | 1.35M |
| 12:30 | USD | Housing Starts Aug | 1.38M | 1.43M |
| 13:45 | CAD | BoC Interest Rate Decision | 2.50% | 2.75% |
| 14:30 | CAD | BoC Press Conference | ||
| 14:30 | USD | Crude Oil Inventories (Sep 12) | 3.9M | |
| 18:00 | USD | Fed Interest Rate Decision | 4.25% | 4.50% |
| 18:30 | USD | FOMC Press Conference | ||
| 22:45 | NZD | GDP Q/Q Q2 | -0.30% | 0.80% |
| 23:50 | JPY | Machinery Orders M/M Jul | -1.40% | 3.00% |
| GMT | Ccy | Events | |
|---|---|---|---|
| 00:30 | AUD | Westpac Leading Index M/M Aug | |
| Forecast: | Previous: 0.10% | ||
| 06:00 | GBP | CPI M/M Aug | |
| Forecast: | Previous: 0.10% | ||
| 06:00 | GBP | CPI Y/Y Aug | |
| Forecast: 3.80% | Previous: 3.80% | ||
| 06:00 | GBP | Core CPI Y/Y Aug | |
| Forecast: 3.70% | Previous: 3.80% | ||
| 06:00 | GBP | RPI M/M Aug | |
| Forecast: | Previous: 0.40% | ||
| 06:00 | GBP | RPI Y/Y Aug | |
| Forecast: 4.70% | Previous: 4.80% | ||
| 09:00 | EUR | Eurozone CPI Y/Y Aug F | |
| Forecast: 2.10% | Previous: 2.10% | ||
| 09:00 | EUR | Eurozone Core CPI Y/Y Aug F | |
| Forecast: 2.30% | Previous: 2.30% | ||
| 12:30 | USD | Building Permits Aug | |
| Forecast: 1.37M | Previous: 1.35M | ||
| 12:30 | USD | Housing Starts Aug | |
| Forecast: 1.38M | Previous: 1.43M | ||
| 13:45 | CAD | BoC Interest Rate Decision | |
| Forecast: 2.50% | Previous: 2.75% | ||
| 14:30 | CAD | BoC Press Conference | |
| Forecast: | Previous: | ||
| 14:30 | USD | Crude Oil Inventories (Sep 12) | |
| Forecast: | Previous: 3.9M | ||
| 18:00 | USD | Fed Interest Rate Decision | |
| Forecast: 4.25% | Previous: 4.50% | ||
| 18:30 | USD | FOMC Press Conference | |
| Forecast: | Previous: | ||
| 22:45 | NZD | GDP Q/Q Q2 | |
| Forecast: -0.30% | Previous: 0.80% | ||
| 23:50 | JPY | Machinery Orders M/M Jul | |
| Forecast: -1.40% | Previous: 3.00% | ||
Thursday, Sep 18, 2025
| GMT | Ccy | Events | Consensus | Previous |
|---|---|---|---|---|
| 01:30 | AUD | Employment Change Aug | 21.2K | 24.5K |
| 01:30 | AUD | Unemployment Rate Aug | 4.20% | 4.20% |
| 06:00 | CHF | Trade Balance (CHF) Aug | 5.22B | 4.59B |
| 08:00 | EUR | Eurozone Current Account (EUR)v Jul | 35.8B | |
| 11:00 | GBP | BoE Interest Rate Decision | 4.00% | 4.00% |
| 11:00 | GBP | MPC Official Bank Rate Votes | 0--1--8 | 0--5--4 |
| 12:30 | USD | Initial Jobless Claims (Sep 12) | 240K | 263K |
| 12:30 | USD | Philadelphia Fed Manufacturing Survey Sep | 3 | -0.3 |
| 14:30 | USD | Natural Gas Storage (Sep 12) | 71B | |
| 22:45 | NZD | Trade Balance (NZD) Aug | -578M | |
| 23:01 | GBP | GfK Consumer Confidence Sep | -18 | -17 |
| 23:30 | JPY | National CPI Y/Y Aug | 3.10% | |
| 23:30 | JPY | National CPI Core Y/Y Aug | 2.70% | 3.10% |
| 23:30 | JPY | National CPI Core-Core Y/Y Aug | 3.40% |
| GMT | Ccy | Events | |
|---|---|---|---|
| 01:30 | AUD | Employment Change Aug | |
| Forecast: 21.2K | Previous: 24.5K | ||
| 01:30 | AUD | Unemployment Rate Aug | |
| Forecast: 4.20% | Previous: 4.20% | ||
| 06:00 | CHF | Trade Balance (CHF) Aug | |
| Forecast: 5.22B | Previous: 4.59B | ||
| 08:00 | EUR | Eurozone Current Account (EUR)v Jul | |
| Forecast: | Previous: 35.8B | ||
| 11:00 | GBP | BoE Interest Rate Decision | |
| Forecast: 4.00% | Previous: 4.00% | ||
| 11:00 | GBP | MPC Official Bank Rate Votes | |
| Forecast: 0--1--8 | Previous: 0--5--4 | ||
| 12:30 | USD | Initial Jobless Claims (Sep 12) | |
| Forecast: 240K | Previous: 263K | ||
| 12:30 | USD | Philadelphia Fed Manufacturing Survey Sep | |
| Forecast: 3 | Previous: -0.3 | ||
| 14:30 | USD | Natural Gas Storage (Sep 12) | |
| Forecast: | Previous: 71B | ||
| 22:45 | NZD | Trade Balance (NZD) Aug | |
| Forecast: | Previous: -578M | ||
| 23:01 | GBP | GfK Consumer Confidence Sep | |
| Forecast: -18 | Previous: -17 | ||
| 23:30 | JPY | National CPI Y/Y Aug | |
| Forecast: | Previous: 3.10% | ||
| 23:30 | JPY | National CPI Core Y/Y Aug | |
| Forecast: 2.70% | Previous: 3.10% | ||
| 23:30 | JPY | National CPI Core-Core Y/Y Aug | |
| Forecast: | Previous: 3.40% | ||
Friday, Sep 19, 2025
| GMT | Ccy | Events | Consensus | Previous |
|---|---|---|---|---|
| JPY | BoJ Interest Rate Decision | 0.50% | 0.50% | |
| 06:00 | GBP | Retail Sales M/M Aug | 0.40% | 0.60% |
| 06:00 | EUR | Germany PPI M/M Aug | -0.10% | -0.10% |
| 06:00 | EUR | Germany PPI Y/Y Aug | -1.80% | -1.50% |
| 12:30 | CAD | Retail Sales M/M Jul | 0.00% | 1.50% |
| 12:30 | CAD | Retail Sales ex Autos M/M Jul | 0.20% | 1.90% |
| GMT | Ccy | Events | |
|---|---|---|---|
| JPY | BoJ Interest Rate Decision | ||
| Forecast: 0.50% | Previous: 0.50% | ||
| 06:00 | GBP | Retail Sales M/M Aug | |
| Forecast: 0.40% | Previous: 0.60% | ||
| 06:00 | EUR | Germany PPI M/M Aug | |
| Forecast: -0.10% | Previous: -0.10% | ||
| 06:00 | EUR | Germany PPI Y/Y Aug | |
| Forecast: -1.80% | Previous: -1.50% | ||
| 12:30 | CAD | Retail Sales M/M Jul | |
| Forecast: 0.00% | Previous: 1.50% | ||
| 12:30 | CAD | Retail Sales ex Autos M/M Jul | |
| Forecast: 0.20% | Previous: 1.90% | ||
Markets Weekly Outlook – S&P 500, Nasdaq & Dow Jones on a Tear as Fed Rate Cut Looms
Week in Review - Equities with Fresh All-Time Highs
Another inflation print from the US and focus still remains on the labor market where unemployment claims saw a significant spike this week. This leaves the Fed in a position where anything but a rate cut next week could send markets spinning.
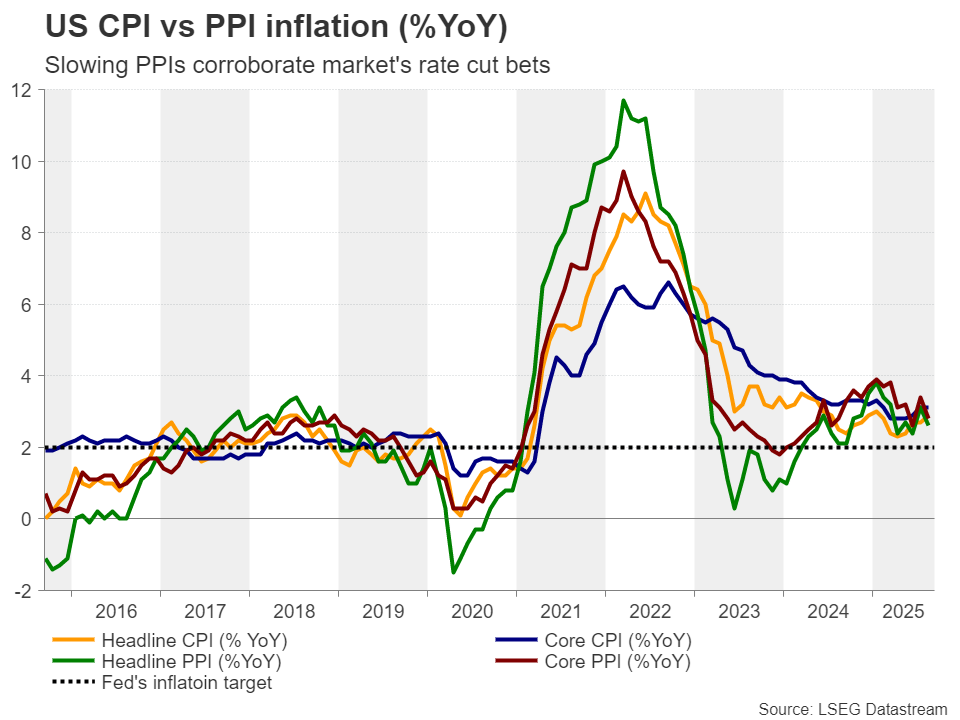
Inflation data this week did flash some warning signs. Looking at the data, tariff driven price pressure leaks through the economy, though it looks different across categories. Food prices seem to climb a bit, while many non‑essential items are easing. Yet the worry for a typical Fed watcher is not the direct cost of imported goods. It is more about the rise in service costs that come from inside the country. Take the index for services excluding energy. In August it sat at three point six percent. Services less shelter were higher, around four percent. Both numbers sit well above the two percent goal Fed constantly cites.
At the same time, the producer‑price data released yesterday showed a weaker jump than analysts expected. Those weak spots feed into personal consumption expenditure measures, which the Fed prefers for inflation. That filter mostly points to higher pressure, not relief. When you line up the latest CPI release, math points toward a core PCE near three percent for August. “Supercore” PCE appears to sit above three point three percent, edging past peaks seen in February 2025 and December 2024, months when the Fed paused rate cuts.
If this pattern holds, the central bank may have to rethink its easing path in the near term. Or perhaps the service surge could soften later, giving policymakers breathing room.
However, despite the inflation concern Fed Chair Powell faces political pressure as well as growing concerns about the US labor market. Given Fed Chair Powell's Jackson Hole speech where he practically confirmed that labor market data is currently the major factor rather than inflation. However, can the Fed ignore the signs?
Consumer Confidence Plummets Amid Economic and Inflation Worries
Consumers are growing more pessimistic about the economy, with a key measure of sentiment falling to a four-month low in September. The decline was sharper than expected, driven by widespread concerns about rising risks to business conditions, the job market, and persistent inflation.
The University of Michigan’s consumer sentiment index dropped to 55.4 this month. This was a notable slide from the previous month’s reading and came as a surprise to economists, who had anticipated only a slight dip. The worsening sentiment was particularly strong among lower- and middle-income groups, highlighting the economic pressure on these households.
The report revealed that consumers' views on their own personal finances are declining, with a gloomier outlook for both their current situation and future expectations. Looking at the specifics, a gauge of how consumers feel about current conditions slipped, but the biggest drop came from the barometer of their expectations for the future, which fell sharply.
Consumers are also growing more concerned about long-term price increases, as long-run inflation expectations rose for the second consecutive month, climbing to 3.9% in September.
Stock Surge Continues
The S&P 500 and Nasdaq continued their impressive performance and pushed up to new record levels, mainly thanks to a jump from Microsoft. Investors seemed to be eyeing the Federal Reserve’s meeting next week, where many think a rate cut could happen because the jobs market looks slower.
The Dow Jones fell a bit, while the S&P barely rose after a big rally the day before that lifted all three indexes to historic peaks.
People are really focused on the Fed’s session on Tuesday and Wednesday. Some analysts think the bank may trim rates by 25 basis points, especially as jobs data dominate the Fed agenda and concerns.
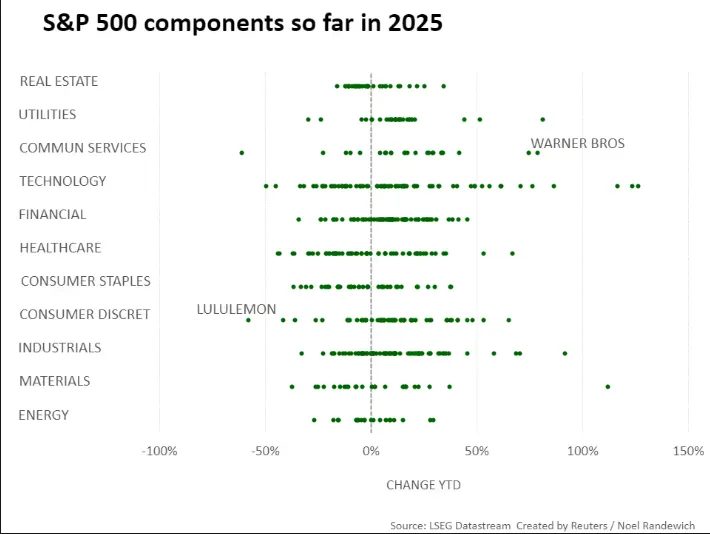
Source: LSEG
The Week Ahead
Asia Pacific Markets - Japan and China in Focus
The Bank of Japan will probably keep the interest rate the same this week. Exports have been slipping, maybe because US tariffs are still biting. Imports could drop too, since global commodity prices seem to be falling. Because exports stay weak, the BoJ may leave its 0.5% policy rate unchanged on Friday in my opinion.
The bank still needs some time to see how new US‑Japan trade deal works out. Consumer price numbers are likely to ease to about 2.9% year‑over‑year in August, thanks to last year’s high base. Core inflation, which leaves out food and energy, might stay above 3%, which could help a rate rise in October. Governor Ueda won’t say anything hawkish, given the fluid political scene. Some analysts think the weak export data could hurt consumer confidence, which may slow growth.
China will publish its August numbers on Monday. Retail sales are expected to bounce back, around 4% higher than a year ago. At the same time, industrial output probably keeps slipping, perhaps down 5.6% year‑over‑year. Fixed‑asset investment may also fall, about 1.5% down so far this year.
Housing price data from about 70 cities should show that the downtrend has continued for a few months. Poor weather was often blamed for the weak July figures. Therefore, August’s data will be a key test to see if the slowdown was just a blip or a longer trend.
Federal Reserve, Bank of England (BoE) and Bank of Canada (BoC) in Focus
The Fed meeting on Wednesday gets our attention. Inflation still feels high, but the job picture may be getting worse. Over the last four months we have only seen modest job growth, and a recent revision even hints that more than half of the jobs reported added by March weren’t real. That suggests the labor market is softer than it first seemed.
A cooler economy and a weaker jobs market could ease the price pressure that comes from tariffs. The Fed therefore might move away from its “somewhat restrictive” stance toward a more neutral stance. According to LSEG data, there is 95% probability of a 25‑basis‑point cut, pulling rates down toward 3.25% by March, down from the current 4.5% ceiling.
Retail sales data, due Tuesday, looks likely to stay low because consumers feel uneasy and car sales keep dropping. Industrial output could still shrink again, as the latest manufacturing survey points to another dip.
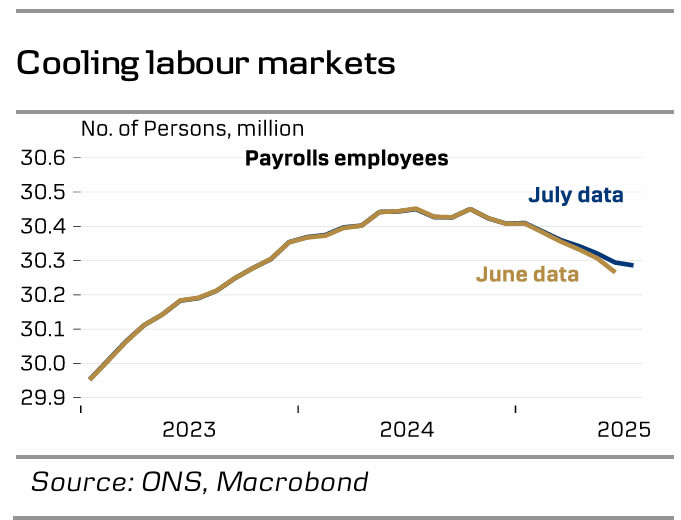
The jobs market feels like a wild card for the Bank of England.
We will be watching payroll numbers for any sign of weakness.
Recent surveys have been getting better, which may mean the worst is over, but the autumn could still bring risk.
Also we need to see if wage growth is finally easing.
Looking at the UK and Inflation data due Wednesday is another focus.
The BoE is especially nervous about food prices, and those numbers are likely still to sit above five percent. Services inflation, on the other hand, might inch lower. If that happens, the report probably won’t shift the Bank’s plan for cutting rates. I still expect a cut in November, although a big surprise on inflation could make us rethink that view.
On Thursday the Bank is not expected to cut rates. Historically it likes to cut only once per quarter and it already cut in August.
Even a change in forward guidance looks unlikely in my opinion. Even though the Central Bank has hinted at more cuts, that hint may simply show rates are edging toward a potentially neutral level.
The Bank of Canada may cut rates by about 25 basis points soon. Canada’s economy is tied closely to President Trump’s tariffs, moreover production dropped in the second quarter. It may mean that demand from the US weakens, which could linger. Jobs numbers slipped again in August, pushing unemployment up to roughly 7.1 %.
Inflation sits near the target, in conclusion the central bank could push rates toward the low end of the so‑called neutral range. Therefore I think another cut could happen in the fourth quarter.
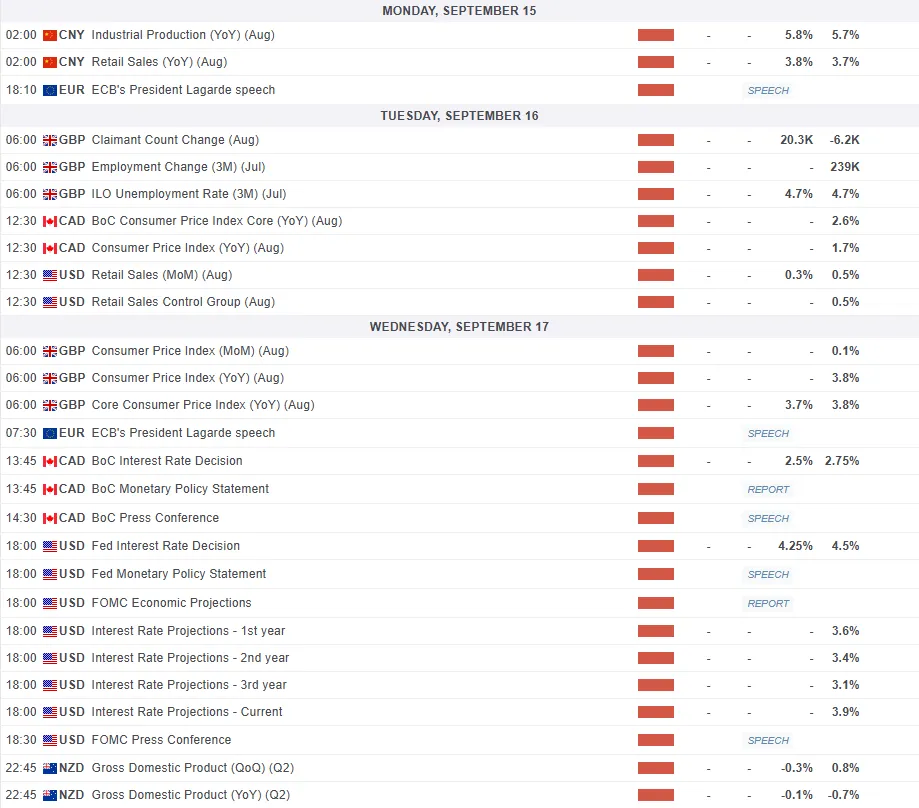
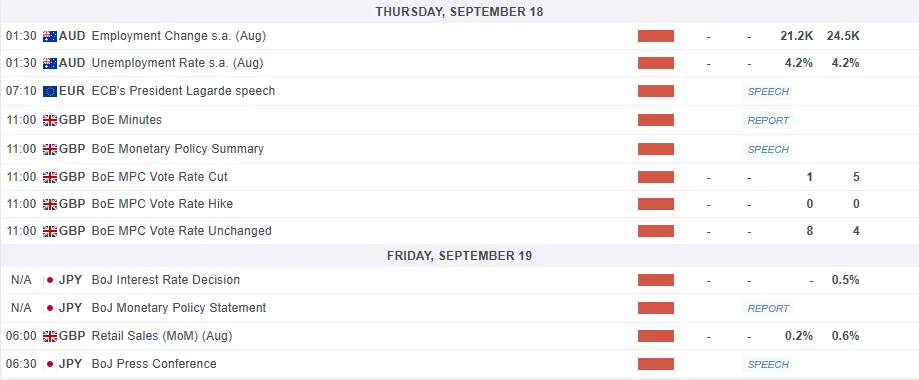 For all market-moving economic releases and events, see the MarketPulse Economic Calendar. (click to enlarge)
Chart of the Week - US Dollar Index (DXY)
This week's Chart of the week is the US Dollar Index (DXY).
The DXY remains under pressure but has thus far remained above the YTD low which was printed in July.
The question for many in the week ahead will be whether a rate cut will lead to a fresh yearly low?
While this is possible, it does appear that markets have already priced in the majority of a 25bps rate cut. This means that we could be in for a DXY rally this week.
This of course is my opinion and could change if the Fed issue a dovish outlook or if Fed Chair Powell hints at more aggressive rate cuts moving forward.
Immediate support rests at 97.13 before 96.90 and YTD low around the 96.38 handle come into focus.
A move higher for the Index faces a significant confluence area around the 98.50 mark. Beyond that the 99.50 and 100.00 areas come into focus.
US Dollar Index (DXY) Daily Chart - September 12, 2025
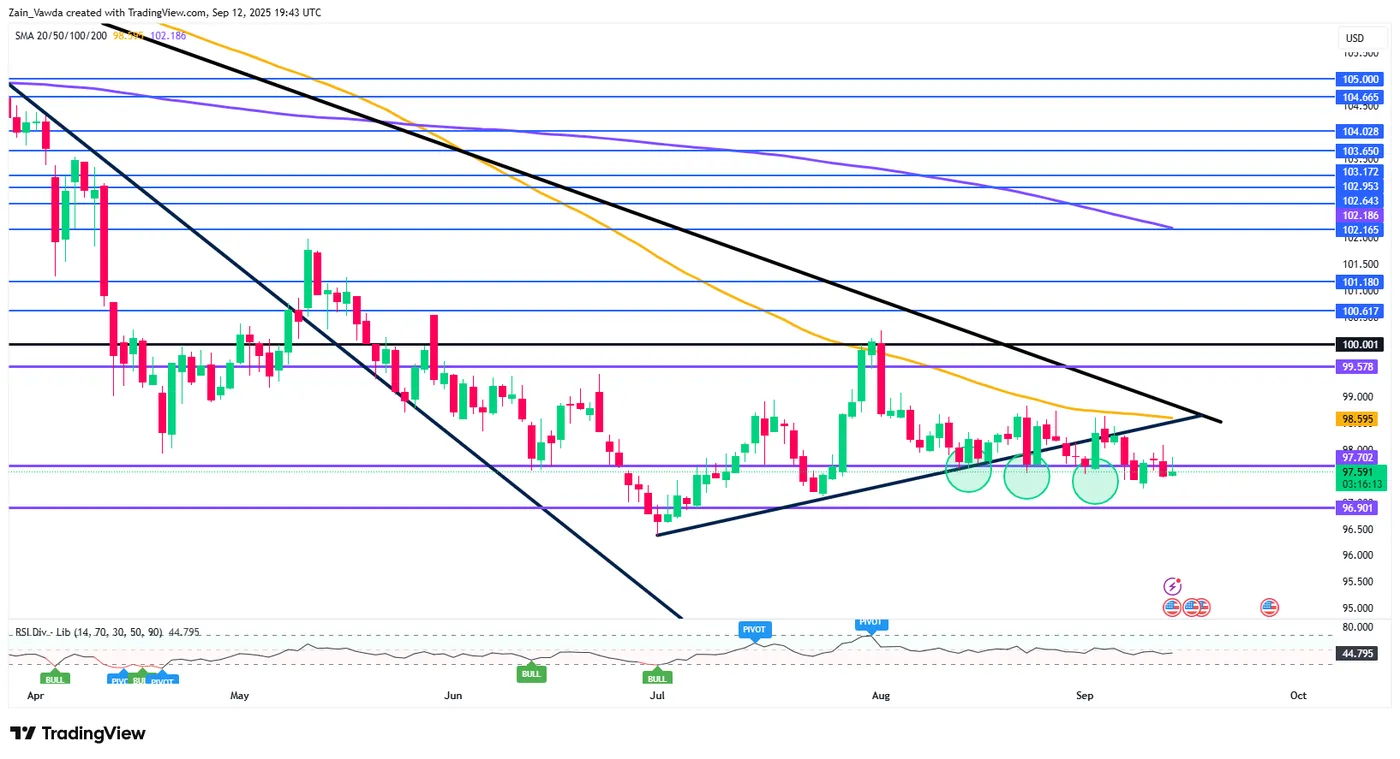
Source: TradingView.Com (click to enlarge)
The Weekly Bottom Line: The Calm Before the Cut?
Canadian Highlights
- Odds are the Bank of Canada cuts rates next week after a pair of soft employment reports and a contraction in GDP.
- Canadian household wealth continues to rise, supporting the recent resiliency in consumer spending. However, elevated debt levels will likely keep a lid on near-term consumption growth.
- Prime Minister Mark Carney announced the first five major projects of the country’s nation-building project plan.
U.S. Highlights
- The preliminary benchmark revisions to the payrolls data through March 2025 suggest that job growth slowed earlier than previously believed, with 911k fewer jobs added in the year through March 2025.
- August’s consumer inflation report showed continued price pressures from tariffs.
- All eyes will now turn to the Federal Reserve meeting next week, with the FOMC expected to implement its first 25 basis-point cut of the year.
Canada – The Calm Before the Cut?
A quiet week for domestic data gave some time for markets to assess economic conditions before next week’s Bank of Canada (BoC) rate decision. In recent weeks, softer economic data led by a further deterioration in Canada’s job market has shifted the tides toward a rate cut on Sept. 17th – markets are pricing a 90% probability of a 25 bps cut, up from around 30% during the first half of August (Chart 1).

We’ve long argued that the BoC has reason to cut rates this year as ongoing trade uncertainty and loosening labour markets work to cool residual inflation pressures. Next week’s CPI update could solidify the BoC’s rate decision, if waning inflation momentum, especially in core measures, shows through. However, an upside surprise to inflation readings may keep the BoC to the sidelines. Overall, recent data flows have more or less tracked the Bank’s forecast scenario consistent with a rising need for a further reduction in the policy rate. Whatever happens next week, we believe the BoC’s cutting cycle is nearing the end, with 2.25% policy rate–the bottom end of their neutral rate range–being the target.
It’s worth pointing out that the Canadian consumer has shown some resiliency in recent months. Second-quarter consumption growth exceeded expectations despite a trade-driven economic contraction (Chart 2). National balance sheet data released this week showed that stronger balance sheets may be underpinning the surge in spending as household wealth trends higher on the back of stronger financial markets. It is encouraging to see a slight improvement in the financial position of Canadian households, but debt levels and debt-servicing costs remain elevated. High debt burdens and a weaker labour market are likely to see households keep spending in check over coming quarters, offering only modest support to growth in the second half of 2025.

As the economy faces headwinds, Prime Minister Mark Carney unveiled the first phase of the country’s nation-building projects. The first five include: LNG Canada Phase 2 in BC; the Darlington New Nuclear Project in Ontario; the Contrecoeur port expansion in Quebec; and two mine expansion projects in BC and Saskatchewan. The combined value of the projects tallies around $25 billion, excluding the LNG Canada project which has yet to reach a final investment decision. Another six projects in the early stages of planning have also been identified as part of a next wave under consideration.
The timing of project outlays is still highly uncertain and will likely span over several years, potentially providing a mild tailwind for Canada’s GDP growth over the medium-term. More importantly, this nation-building agenda is part of the government’s broader plan of enhancing long-term economic and productivity growth through increased defense spending, infrastructure development, reduced interprovincial trade barriers, and comprehensive spending and regulatory reviews.
U.S. – Waiting on Rates to Change
Despite there only being a handful of economic data releases this week, each was influential to the economic outlook. This included the preliminary benchmark revision for employment, as well as the consumer and producer inflation reports for August. While the data was somewhat concerning, financial markets largely took it in-stride as expectations for next week’s Federal Reserve decision remained in-tact. The S&P 500 rose 1.6% on the week, with U.S. Treasury yields seeing little change as of the time of writing.
The preliminary revision to non-farm payrolls released on Tuesday will not be incorporated into the official data until the January 2026 release, but the snapshot it provided was concerning. Estimates of employment for the year through to March 2025 were revised lower by 911k jobs, which would be the largest revision since 2009 (Chart 1). This comes on the heels of last week’s employment report for August, which showed only 22k jobs added during the month and the unemployment rate rising to 4.3%. The emerging shift away from full employment in the economy is likely to be a top priority during Federal Reserve deliberations at next week’s meeting.

However, they will also have to assess the emerging risks to the other side of their dual mandate related to price stability, with the data we received this week on inflation also raising concerns. Those with dovish predispositions may point to the surprise decline in the producer price index (PPI) in August as evidence that price pressures are under control. However, the rolling 12-month volatility of the PPI final demand index excluding food & energy has hit its highest level since mid-2022, likely reflecting the impact that constant trade policy changes have had on firm pricing decisions. Single-month changes in the PPI therefore need to be taken with a grain of salt and illustrate the challenges the Fed faces in assessing price developments in 2025.
On the consumer inflation front, we saw further upward pressure on goods prices in August, while services inflation also remained elevated. With the three-month annualized percent change in core CPI accelerating to 3.6% in August (Chart 2), the Federal Reserve’s response function would typically be to consider raising interest rates in such an environment, all else equal. However, given the temporary nature of tariff-induced inflation and the flagging labor market, the full balance of risks will need to be taken into consideration. Amid this backdrop, in conjunction with the sustained stability in consumer inflation expectations, we expect the Fed to implement its first 25 basis point cut of the year next week.

Further interest rate reductions are expected to be implemented gradually through the end of the year, to provide support to the economy without fanning the flames of inflation anew. This is expected to be a delicate maneuver by the Federal Reserve, and one that will be sensitive to the balance of incoming economic data.
Weekly Economic & Financial Commentary: Cuts to Begin Again
Summary
United States: Gradually, then Suddenly
- This week’s economic data showcased how both sides of the Fed’s dual mandate are under pressure. Inflation is running closer to 3% than 2%, according to both the CPI and PPI. Meanwhile, the BLS’s preliminary benchmark revision revealed that the pace of job growth leading up to March 2025 was substantially weaker than previously thought.
- Next week: Retail Sales (Tue.), Housing Starts (Wed.)
International: Diverging Decisions, Emerging Risks
- This week, the European Central Bank held rates steady, while Turkey surprised with a sharper-than-expected rate cut. Inflation edged up in Norway and Mexico, while price pressures continued to ease in Brazil. Finally, Argentina hosted elections where political risks resurfaced ahead of October midterms.
- Next week: China Industrial Production and Retail Sales (Mon.), Bank of Canada Policy Rate (Wed.), Bank of Japan Policy Rate (Fri.)
Interest Rate Watch: Cuts to Begin Again
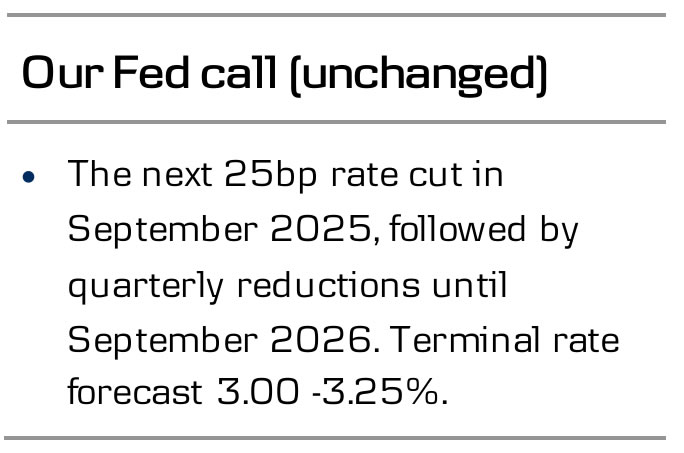
- We expect the FOMC to resume lowering the fed funds rate at its September meeting with a 25 bps rate cut that would bring the policy rate to a range of 4.00%-4.25%.
Topic of the Week: Benchmark Revision: Downshifting to a Lower Gear
- The BLS's estimate of the preliminary benchmark revisions suggests that total nonfarm payrolls were roughly 911K lower than currently published in March 2025 (not seasonally adjusted). This year's downward revisions are large on a historical basis, beating the preliminary estimates in 2024 and 2009 (-818K and -824K, respectively). So what is the benchmark and what does it mean about payroll growth?
Week Ahead – Fed, BoC, BoE and BoJ Policy Decisions Enter the Spotlight
- Fed expected to cut rates, focus to fall on the new ‘dot plot’.
- BoC seen cutting rates by 25bps due to weak economic data.
- BoE to remain on hold, voting may shake the Pound.
- Amid political uncertainty, the BoJ is expected to stand pat.
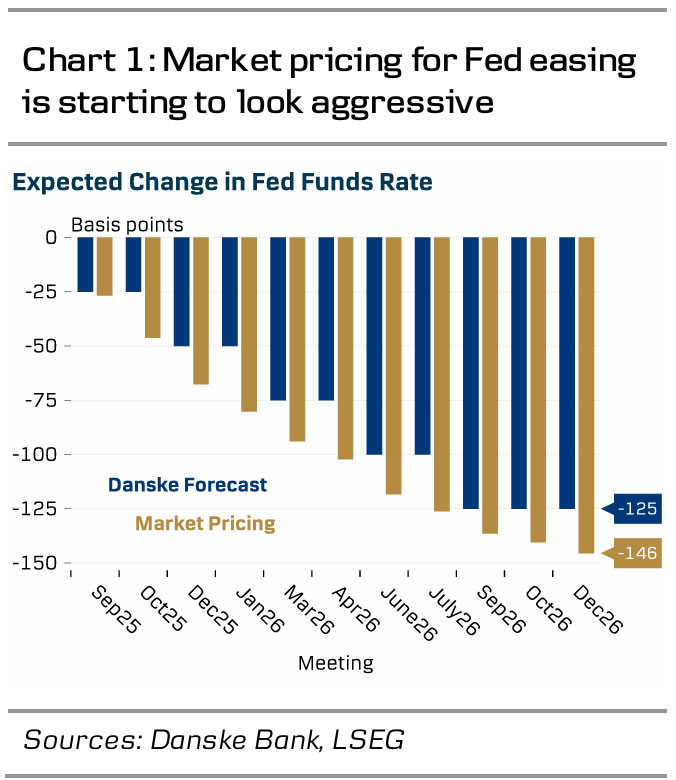
Investors see three rate cuts this year
The US dollar entered this week on a soft footing as the disappointing jobs report for August prompted market participants to increase their rate cut bets. That said, it recovered ground on Tuesday and Wednesday, even after data revealed a marked slowdown in producer prices. It was sold again on Thursday due to weaker-than-expected initial jobless claims, despite slightly hotter than expected CPI numbers.
Investors remained convinced that more than two quarter-point rate cuts are warranted by the end of the year. According to Fed fund futures, around 72bps worth of reductions are baked into the cake, with the first 25bps cut expected to be delivered at Wednesday’s meeting. There is even a 7% chance of a double 50bps cut. However, a more likely scenario according to market pricing is for the Fed to cut by 25bps at each of the three remaining meetings.
Although the weakness in the labor market has increased speculation about aggressive Fed easing policy, the strong 3.0% growth estimate for Q3 according to the Atlanta Fed GDPNow model makes the Fed’s job more complicated than the market believes.
Will the Fed match the market’s dovishness?
A 25bps reduction on its own is unlikely to trigger market volatility. If this is the decision, market participants are likely to quickly turn their attention to Fed Chair Powell’s press conference and the updated macroeconomic projections, especially the new “dot plot”.
Back in June, the median dot for this year pointed to 50bps worth of additional reductions, but with seven members favouring keeping rates untouched. So, it will take a major shift for policymakers to even match the market’s dovish expectations. However, if indeed they appear convinced that more rate cuts are needed, the US dollar is likely to come under renewed selling pressure.
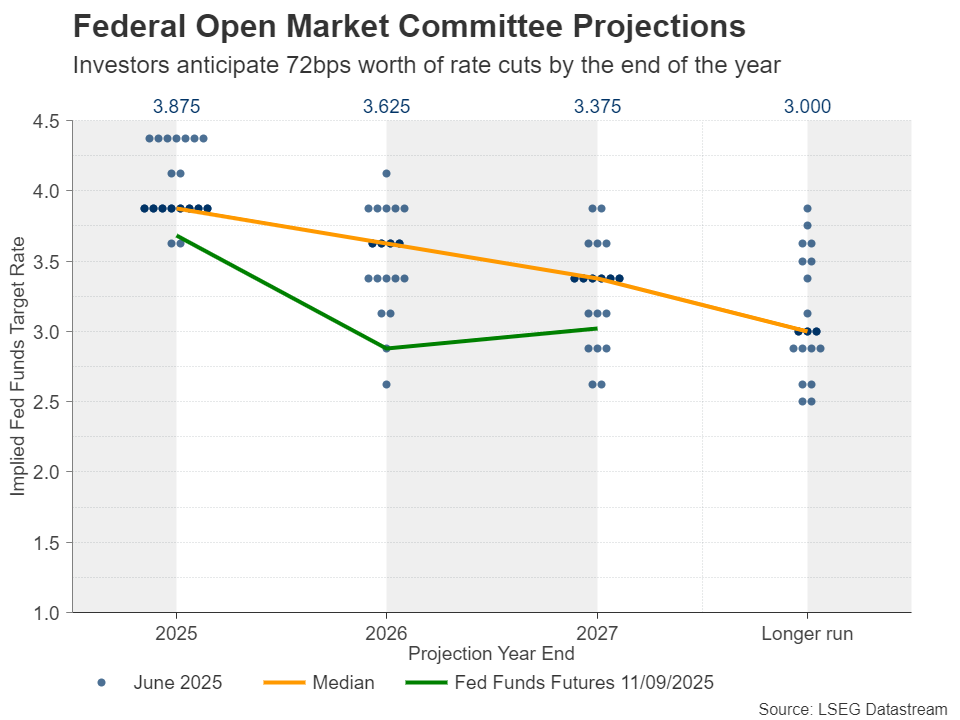
What may also attract special attention as we approach the end of 2025 is the median dot for 2026. In June, policymakers saw one additional reduction to the two projected for this year, which comes in huge contrast to the market’s view of another three. However, with US President Trump pushing for replacements within the Board of Governors, and the selection of regional Fed presidents scheduled for early next year, the 2026 projections may be subject to substantial revisions moving forward.
Economic weakness to prompt BoC to cut rates
Ahead of the Fed decision, the Bank of Canada will already have set rates. Back in July, the Bank kept interest rates unchanged at 2.75%, citing resilience in economy and adding that underlying inflation levels were around 2.5% when stripping out volatility and tax changes.
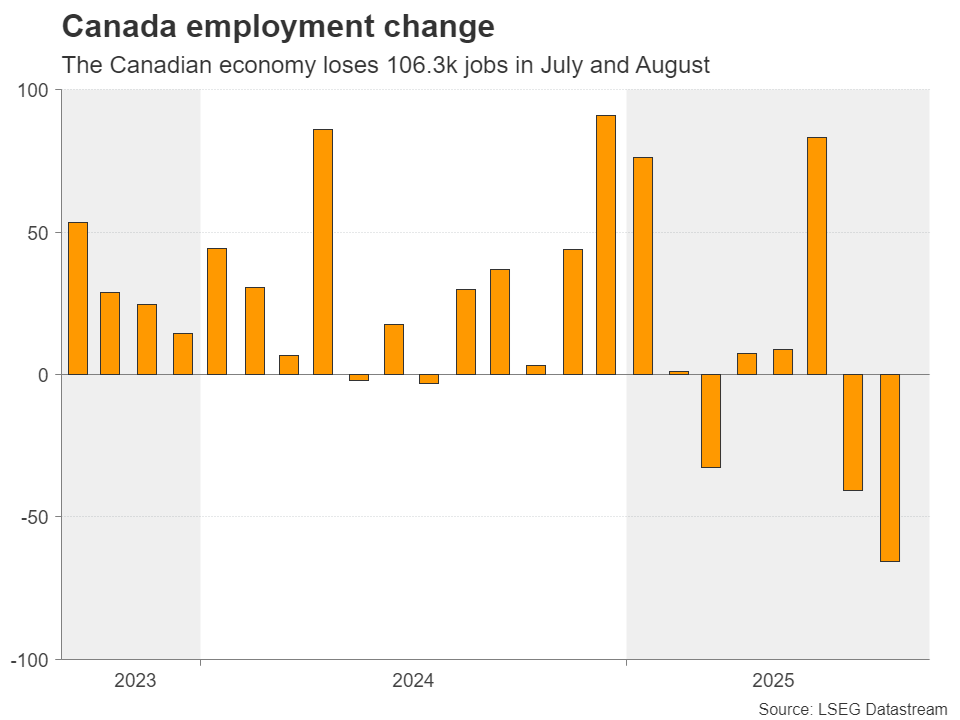
Since then, data revealed that the unemployment rate jumped to 7.1% from 6.9%, with the labor market losing a cumulative of 106.3k jobs in July and August together, while GDP for Q2 pointed to a 0.4% q/q contraction. The CPI rate for July dropped to 1.7% y/y from 1.9%, but the trimmed mean rate held steady unchanged at 3.0%. The August inflation report will be released on Tuesday, a day ahead of the rate decision.
Despite the stickiness in underlying inflation metrics, the economic weakness has led investors to turn dovish, assigning an 85% probability of a quarter-point reduction at this meeting and nearly fully pricing in another one by the end of the year.
If indeed the BoC cuts rates as expected and sounds more dovish than in July due to the deepening economic wounds, the Canadian dollar is likely to tumble, with dollar/loonie extending the decent recovery it started on September 1.
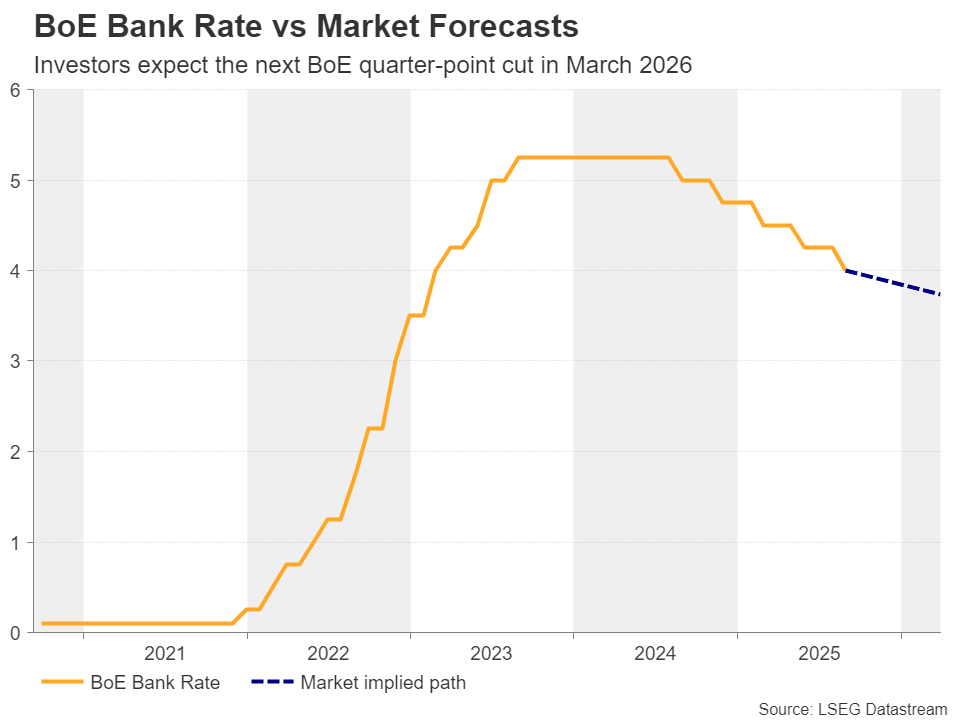
BoE to stay on hold, next rate cut seen in March
On Thursday, the central bank torch will be passed to the BoE, and during the Asian session on Friday, to the BoJ.
Getting the ball rolling with the BoE, British policymakers lowered borrowing costs to 4% in August, the lowest level for more than two years. However, the decision was so close that it took a second round of voting to be sealed.
In its Monetary Policy Report, the Bank projected inflation to peak at 4% in September, twice its target, while last week Governor Bailey said that “There is now considerably more doubt about when and exactly how quickly we can make those further steps."
Now, investors are nearly certain that the Bank will refrain from acting on Thursday. However, due to last month’s close call, the voting pattern could prove market moving for the pound as even one or two officials voting for a rate cut could prompt investors to bring forward their rate cut bets and thereby hurting the British currency. Currently, they are fully pencilling in the next quarter-point reduction to be delivered in March.
It is worth mentioning that ahead of Thursday’s decision, the UK CPI numbers for August will be released on Wednesday, and they could very well impact how policymakers will vote the next day. UK retail sales data are due out on Friday.
Will the BoJ remain willing to hike before year-end?
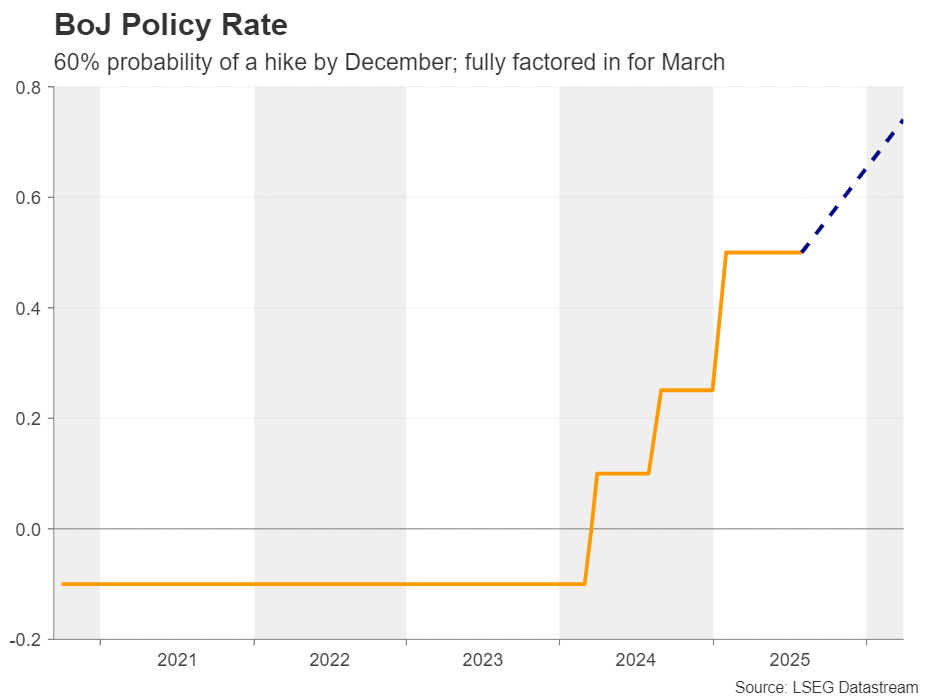
Passing the ball to Japan, following the resignation of prime minister Ishiba, there has been speculation that he will be replaced by someone who advocates looser fiscal and monetary policy, and thus the probability of a 25bps rate increase by the BoJ fell to below 50%.
However, investors were quick to recalibrate their BoJ hike bets following a report that the BoJ maintained the view that it may be possible to raise interest rates again this year despite the political turmoil, mainly due to economic conditions developing as expected.
Although the Bank is widely anticipated to refrain from acting next week, investors are now baking into the cake a 60% chance of a hike by the end of the year, while they are fully pricing in a quarter-point increase by March. Thus, all the attention will be on the forward guidance and Governor Ueda’s press conference.
If BoJ policymakers remain committed to take borrowing costs higher, the yen is likely to gain. However, delivering a clear message may be a difficult task. The Liberal Democratic Party (LDP) will hold an election on October 4 for Ishiba’s successor, a choice that could prove influential for monetary policy thereafter. Yes, the BoJ is independent, but alongside the government they issued a statement back in 2013 highlighting the importance of cooperation to fight deflation and spur economic growth.
One of the strongest candidates for taking Ishiba’s place is former economic security minister Sanae Takaichi, who is seen as pro-monetary easing. Therefore, anything suggesting that the BoJ will proceed at a slower pace or even dismiss future rate hikes, could prove quite negative for the Japanese currency.
Forward Guidance: Another Close Call for BoC But Not So Much for Fed
Recent softening in North American labour market data has brought back prospects for additional and earlier interest rate cuts from central banks.
The U.S. Federal Reserve is now widely expected to cut rates on Wednesday for the first time since December in the wake of softening job reports over the summer. U.S. job growth has essentially stalled since April, leaving a much less resilient backdrop to initial tariff impacts than previously estimated. It’s also overriding concerns about inflation holding above the Fed’s 2% objective.
In Canada, we expect the decision will be a closer call, and closer than the high likelihood of a cut currently priced into markets. The Bank of Canada is weighing signs of softening in the economy (higher unemployment, lower exports) against broader inflation concerns. We look for the central bank to narrowly opt for a hold on interest rates. Although, that will also depend on the August consumer price data out on Tuesday—the day before the decision.
Economic data in Canada has deteriorated, but not significantly more than the BoC expected. A 1.6% decline in Q2 gross domestic product was broadly in line with the 1.5% decline assumed in the July Monetary Policy Report. Early data for Q3 suggests that the Q2 decline—driven largely by a pullback in net trade, and concentrated in the manufacturing sector—is unlikely to be repeated. Export volumes stabilized into July, and the preliminary estimate of July’s manufacturing sales showed a 1.8% increase.
There are still sectors that are being significantly impacted by trade disruptions, but that has yet to spread broadly across the economy. Labour markets have softened, but with job losses largely concentrated in heavily trade-exposed sectors. There is clearly an argument for policy support to those sectors, but fiscal policy (federal and provincial government spending) is better suited to provide targeted and timely support than across-the-board interest rate cuts.
Inflation reading could be the decider
Federal and provincial spending plans are already ramping up, and lowering interest rates further risks adding to inflation pressures in other parts of the economy where activity has been more resilient. Consumer spending grew sharply in Q2 despite an overall GDP decline, and housing markets have been showing signs of life.
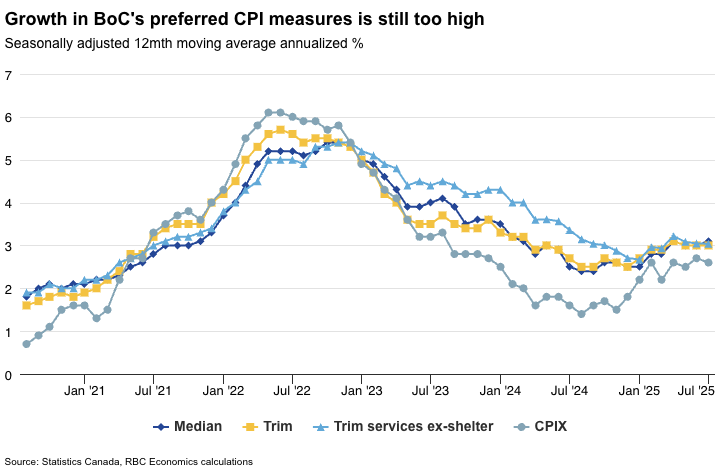
August’s CPI could be the deciding factor between a cut and hold for the BoC. Year-over-year CPI growth is still being biased lower by a drop in energy prices, in large part due to the removal of the consumer carbon tax from gasoline prices in most provinces in April. But, we expect headline price growth to tick up to 2.1% from 1.7% in July, and for price growth, excluding food and energy products, to rise to 2.8%. The BoC’s own preferred median and trim core CPI measures are expected to have held around 3% (the top end of the central bank’s inflation target), extending the trend seen over the summer.
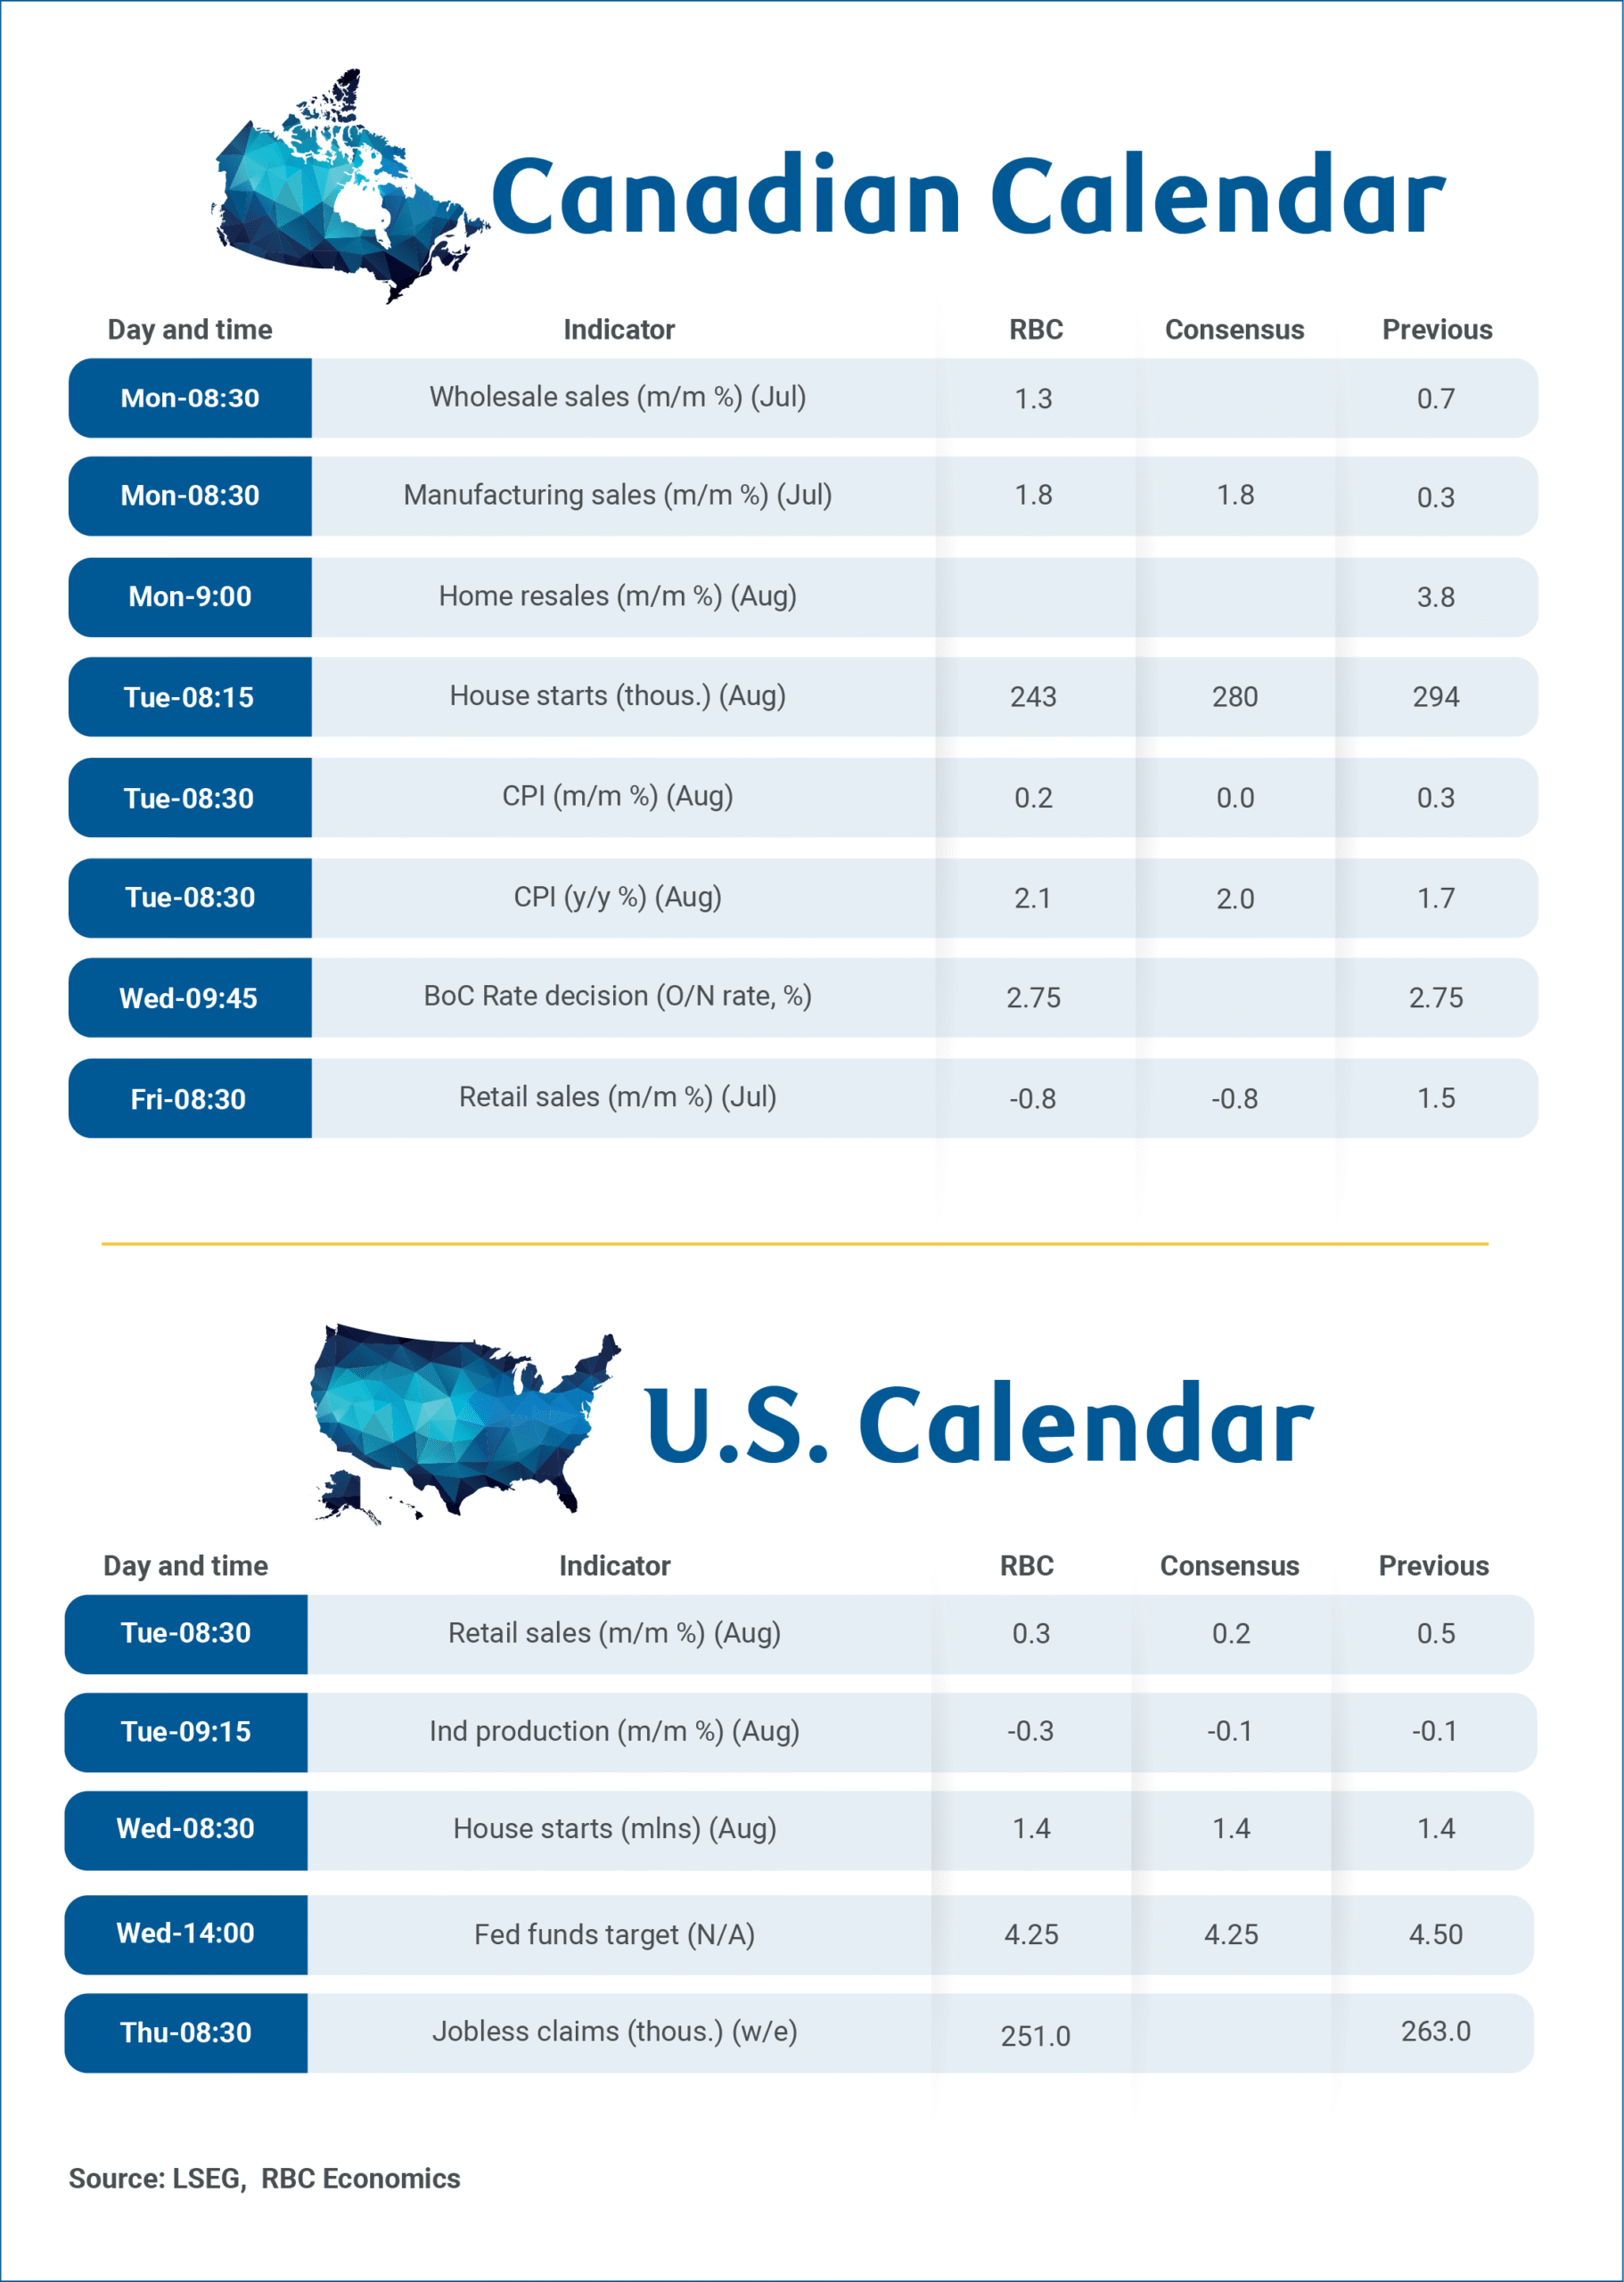
Week ahead data watch:
The early estimate of July Canadian manufacturing sales showed a 1.8% increase from June. Producer price index data for July suggests roughly a percentage point of that increase came from higher prices
The early estimate of Canadian July retail sales was down 0.8% – partially retracing a 1.5% increase in June and with details that we expect will remain broadly consistent with resilient consumer spending trends in the spring extending into the summer. We expect core (excluding the volatile motor vehicle and gasoline components) was stronger with sales at both auto dealerships and gasoline stations tracking lower in July.
We expect U.S. retail sales edged higher (+0.3%) in August but production in the heavily trade exposed manufacturing sector is expected to continue to show the strain from tariffs. Manufacturing hours worked fell by 0.5% in August and we expect industrial production declined 0.3%.
Canada’s August home resales report should show further signs of stabilization in housing markets over the summer based on early market reports.
Weekly Focus – Road Clear for US Rate Cut
The stage is set for the Federal Reserve to deliver its first rate cut this year on Wednesday after having been on pause since December. This week, we had the final big data release before the meeting, and it showed CPI inflation of 0.4% m/m, higher than expected and still some way from the Fed's inflation target. However, focus is much more on the labour market currently, and here we had a negative surprise as the weekly initial jobless claims number was 263,000 for the first week of September, the highest since 2021. Even before this release, a rate cut next week was fully expected, and expectations of two additional cuts this year are becoming increasingly widespread.
Note, though, that most indicators for the US labour market are still consistent with the view that job growth is low because workforce growth is low, not because more demand stimulus is urgently needed. The jobless claims number is an exception, but these weekly numbers can be volatile and affected by one-off factors, which could well be the case this time around, as half the spike was driven by a single state, Texas. With inflation still on the high side - before the tariffs really impact consumer prices - the Fed could well choose to move more slowly after next week's cut. Complicating the picture is of course also the pressure for lower rates from the Trump administration. This week, a court ruled that Lisa Cook can stay on the Fed's Board of Governors for now despite President Trump's attempt to fire her.
In contrast to the Fed, the ECB seems done with rate cuts, and that view was confirmed at this week's meeting. The ECB staff actually delivered some ammunition to those arguing for one more rate cut, in that the updated economic projection shows inflation being below 2% on both headline and core measures in both 2026 and 2027. However, ECB president Lagarde downplayed this at the press conference, arguing that the 2027 forecast was very close to 2% and that inflation is being temporarily dragged down by a stronger EUR. In France, the prime minister lost a confidence vote as expected and the president has appointed his close ally Sébastien Lecornu as new head of government. It is highly doubtful that he will be more successful than his predecessors in improving public finances, but markets did not react further, following the recent relative weakness of French bonds.
While the FOMC meeting is clearly the main event in the coming week, other central banks are also worth watching. The Bank of England is widely expected to keep rates unchanged but there is considerable uncertainty over the path forward see also Bank of England Preview - Guidance in focus as cutting cycle is nearing its end, 12 September. Just ahead of the meeting, we will get labour market and inflation data which could also be key. Also, the Bank of Japan is expected to be on hold, but expectations are that a rate hike is drawing near, although the uncertain political situation could affect the outlook. In Japan, there will also be an important inflation data release ahead of the meeting. Norges Bank is expected to cut rates, see Market Movers Scandinavia below. In China, we will get the monthly release of most economic data on Monday morning with focus especially on retail sales and housing market indicators.
Bank of England Preview: Guidance in Focus as Cutting Cycle Nearing Its End
- We expect the Bank of England (BoE) to keep the Bank Rate at 4.00% on Thursday in line with consensus and market pricing. We now pencil in just two additional rate cuts through 2025-26.
- Data has come in on the hawkish side since the August meeting and both CPI and labour market report will follow next week ahead of the meeting.
- We expect a muted market reaction and remain bearish on GBP
We expect the BoE to keep the Bank Rate unchanged at 4.00% on Thursday 18 September in line with consensus and market pricing. Note, this meeting will not include updated projections or a press conference. The labour market report for July/August and CPI for August will be released just prior to the meeting next week and has the potential to heavily influence guidance at next week's meeting. It will also be worth keeping an eye on the vote split, which caught a lot of attention at the previous meeting.
We expect the BoE to condition further rate cuts on disinflationary pressures, as we saw it in August. Since the last meeting, data has come into the hawkish side. Payrolls decline was less steep in July with 8K fewer jobs, the least since January. The weak development in previous months was also revised up, although the big picture is still a cooling labour market. Q2 GDP data was stronger than expected at 0.3% q/q, although largely driven by public spending. Retail sales data later showed a quite pronounced downward revision of H1, which indicates Q2 GDP-data could also be up for a revision lower. That said, July data showed a decent pickup. The notion of a continued modest recovery is supported by solid PMI data, particularly for services, while manufacturing remains quite weak. July CPI inflation came in higher than the BoE's expectation. Headline inflation increased to 3.8% y/y in July with particularly service and food prices remaining elevated.
We will also look out for the annual decision on QT. The BoE has reduced its holdings by an annual pace of GBP100 bn. for two years now. Consensus is for slowing the pace to GDP72 bn. according to a Reuters survey.
BoE call. We expect the BoE to cut rates again in November, leaving the Bank Rate at 3.75% by YE2025, but we acknowledge that inflation will need to cool in August-September data for that to happen and see a substantial risk the next rate cut could be postponed. With the economy holding up better than expected and inflation still quite sticky above target, we revise our expectations for the bank rate next year and now expect one more cut in February leaving the Bank Rate at 3.50%.
Market reaction. We think the BoE is in wait and see mode which should imply a preference for not rocking the boat. That should mean a tempered market reaction. However, circumstances could change depending on upcoming data ahead of the meeting. More broadly, we stay negative on GBP. We therefore expect EUR/GBP to move higher towards 0.89 on a 6-12-month horizon.
Fed Preview: Quarterly 25bp Cuts Still the Base Case
- We expect the Federal Reserve to cut policy rates by 25bp at the September meeting. The market is pricing a slim 5-10% risk of a larger 50bp cut.
- Updated dots will provide key insight into whether the FOMC majority prefers quarterly or sequential cuts. We still call for only two cuts this year (Sep & Dec) and expect the median dot to signal a terminal rate of 3.00-3.25% by end-2026.
- We see upside risks to short-end USD rates and downside risks to EUR/USD if the majority of participants favour quarterly cuts over sequential reductions.
Markets have flirted with the idea of the Fed delivering a larger 50bp cut at the September meeting after disappointing jobs growth over the summer, but we still think a more gradual approach is better suited for the current environment.
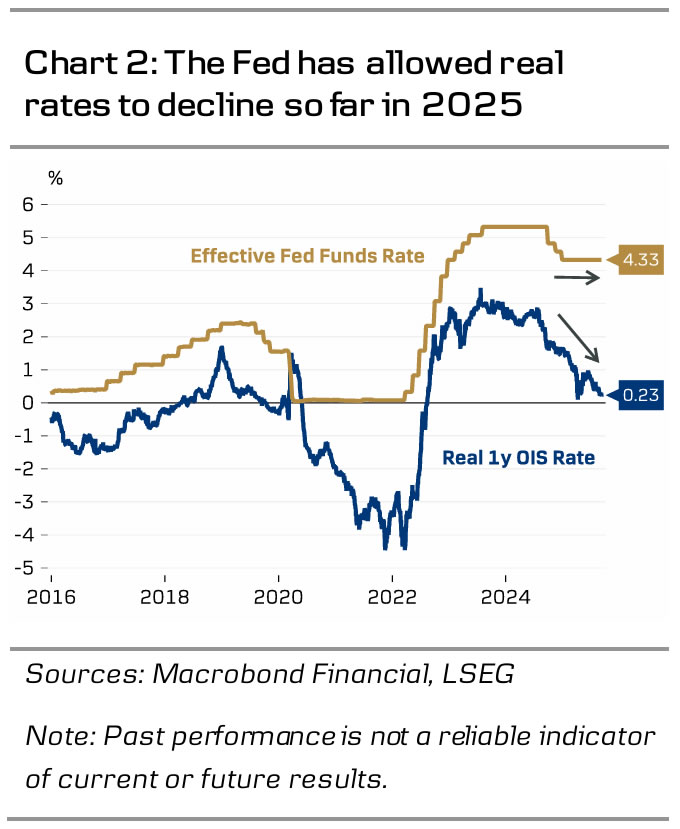
Many of the hawkish arguments that Powell presented in June and July still hold today. Monetary policy is not as restrictive as it was a year ago when the Fed kicked off the easing cycle with a 50bp move. The nominal policy rate is 100bp lower and 1Y real rate is 190bp lower than a year ago, while overall financial conditions have eased tremendously. There is simply less need for additional easing to reach neutral.
Furthermore, while Powell is likely to repeat his earlier view that tariff-driven inflation will remain temporary in nature, the still elevated level of inflation expectations increases the risk of more persistent price pressures. Recent CPI and PPI data showed that tariff costs are making their way through the economy, even if pass-through to consumer prices has so far been limited, see Global Inflation Watch - Tariff pass-through still in progress, 11 Sep.
The updated economic projections, and particularly the rate expectations (or 'dots'), will provide important insight into participants' preferences about the pace of future rate cuts. Those calling for only one additional cut this year likely prefer a more gradual pace in 2026 as well, while those calling for two more cuts would likely prefer continuing sequential cuts into early 2026. We think the median terminal rate forecast will remain at 3.00-3.25% - a level we think will be reached by September 2026.
Based on recent commentary, at least governors Waller and Bowman likely prefer more aggressive sequential cuts. Regional Fed presidents Williams, Kashkari and Bostic have favoured a more gradual approach in their recent remarks, though participants have generally refrained from laying out precise rate paths.
The FOMC's September composition still remains somewhat unclear. Federal court blocked Trump from firing governor Cook based on alleged mortgage fraud. While this was not a ruling on whether Cook had committed wrongdoings or not, and even though Trump has already appealed the decision, it looks likely that Cook will be able to participate in next week's meeting. The temporary nomination of Stephen Miran is currently being debated in Senate, and while it is likely that Senate will confirm Trump's pick, it remains unclear whether Miran will be eligible to vote already next week. Confirmation vote has been scheduled for Monday (according to Reuters). In any case, we do not expect Cook's and/or Miran's participation to affect next week's rate decision itself.