
Sample Category Title
Sunset Market Commentary
Markets
Core bonds sold off today with German Bunds extending yesterday’s underperformance against US Treasuries and UK gilts. The ECB kept its policy rate unchanged at 2% for a second consecutive meeting with President Lagarde declaring the disinflation process being over and upgrading the risk balance around growth prospects to “more balanced”. This change in tone prompted a scaling down of remaining ECB rate cut bets, opening the discussion of what might come next after the current, likely extended, pause. Several ECB members added to the debate in overall fairly neutral comments. Summing up their views: the ECB decided by consent that doing nothing is the modus operandi from now on unless any other significant development challenges the outlook and calls for action. Depending on where the governor stood at the dove-hawk scale that might imply cutting or hiking. Anyway, markets consider the “cutting” door closed for now with the market implied probability of action before year-end dropping as low as 15% and the chance that we see another 25 bps rate cut in 2026 dipping to 40%. EU swap rates today add 2.2 bps (2-yr) to 5.9 bps (10-yr) with the belly of the curve outperforming the wings. The 2-y rate extends yesterday’s technical break to levels (2.15%) last seen around Liberation Day early April. The euro fails to profit from the interest rate support with EUR/USD slightly ceding ground at 1.1715. Daily change on the US yield curve range between +0.8 bps (2-yr) and +3.4 bps (10-yr) as US markets wait for more guidance coming from the Federal Reserve next week. A 25 bps rate cut – first since December – is the discounted base case but visibility about the path afterwards remains rather low. All else equal, we assume follow-up action in both October and December.
Later today, attention shifts to the US independent Congressional Budget Office which publishes its current view of the economy from 2025 to 2028. This report will present the CBO's latest short-term projections for major economic indicators—including GDP growth, inflation, unemployment, interest rates, and consumer behavior. It will also discuss the agency's updated demographic projections, effects of recent tariff policies, and effects of the 2025 reconciliation act. At the end of August, the CBO already updated projections of the budgetary effects of tariffs. The agency suggested that tariffs implemented (until August 19) will decrease primary deficits by $3.3tn if the higher tariffs persist for the 2025-2035 period. By reducing the need for federal borrowing, those tariff collections will also reduce federal outlays for interest by an additional $0.7tn. As a result, the changes in tariffs will reduce total deficits by $4tn altogether. This compares with an estimated $2.5tn impact in June prognosis. Together with Fed Chair Powell’s dovish pivot in Jackson Hole, this might help explain the recent outperformance at the long end of the US yield curve with the 10-yr tenor yesterday touching 4% for the first time since early April.
News & Views
The Bank of England’s quarterly survey on consumer inflation expectations showed the gauge for the year ahead rising from 3.2% to 3.6%, the highest in exactly two years. The two-year barometer picked up to 3.4% from 3.2% in the May questionnaire, a 14-year high. Asked about inflation over the longer-term, say five years, the respondents’ answer was 3.81%. That’s more than in the May survey (3.6%) and just enough for a new record high in the 16-year old series. The previous high dated from November 2013 (3.8%). When asked about the future path of interest rates, 33% of respondents expected rates to rise over the next 12 months, the same as in May, vs 29% saying they expected rates to decline, down from 34% in May 2025.
France’s statistical agency INSEE is forecasting marginally faster GDP growth than previously expected. Key sector such as the aeronautics industry, tourism, real estate and agriculture would rebound, allowing the economy to grow by 0.8% instead of 0.6% earlier. The good news came with an important disclaimer though. INSEE said growth was merely benefiting from a temporary boost of companies rebuilding inventories after two years of drawdowns. The French economic power engine, the consumer, is still idling. The shaky political situation isn’t helping to revive confidence either and combined with rising unemployment fears have instead caused consumers to save any spare cash rather than spending.
US UoM confidence falls to 55.4, long-term inflation expectation rises
U.S. consumer confidence weakened in September, with the University of Michigan index falling to 55.4 from 58.2 in August. The Current Economic Conditions index edged down to 61.2 from 61.7, while the Expectations index slumped to 51.8 from 55.9.
On inflation, short-term expectations were unchanged at 4.8% for the year ahead, but long-term expectations ticked up again to 3.9%. The back-to-back rise in long-run expectations signals lingering concern among households that price pressures may prove persistent.
The UoM noted that consumers continue to flag multiple vulnerabilities across the economy, including business conditions, labor markets, and inflation.
EUR/USD Daily Outlook
Daily Pivots: (S1) 1.1682; (P) 1.1714; (R1) 1.1766; More...
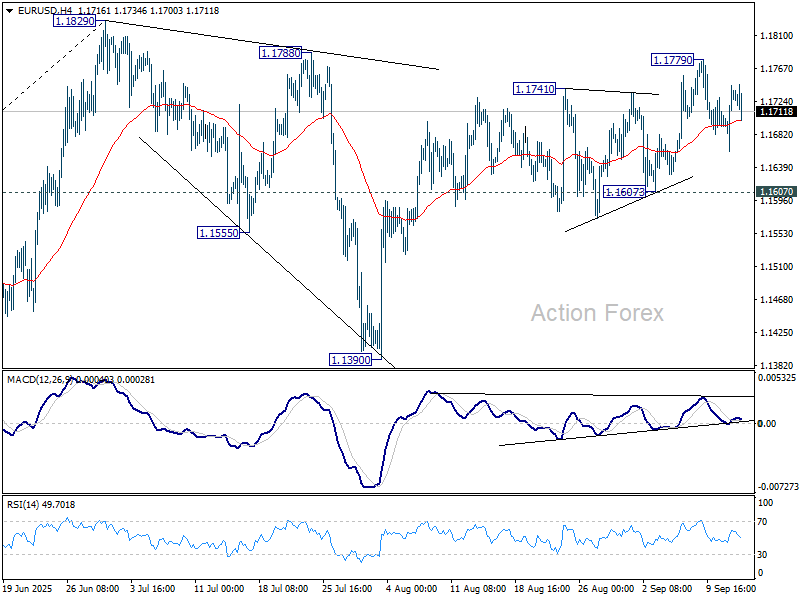
Range trading continues in EUR/USD and intraday bias stays neutral. Further rise is expected with 1.1607 support intact. Above 1.1779 will bring retest of 1.1829 high. Firm break there will resume larger up trend to 1.1916 projection level.
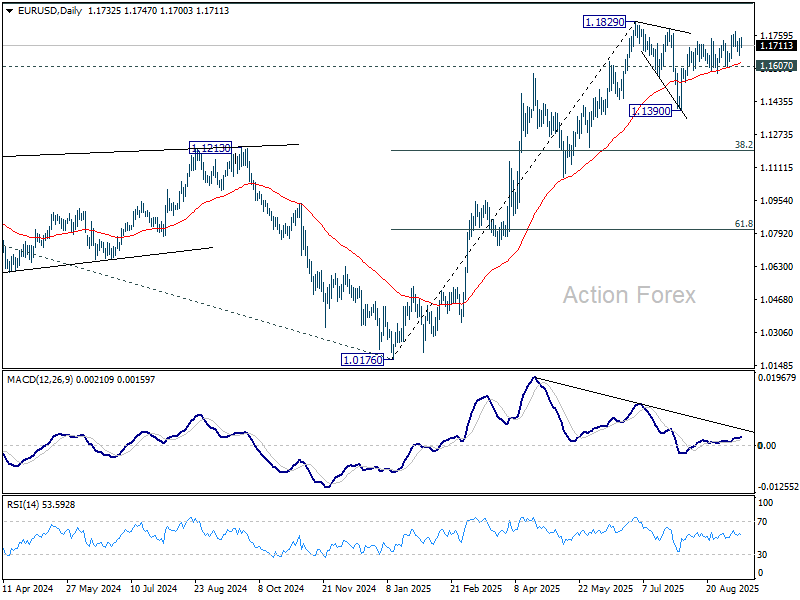
In the bigger picture, rise from 0.9534 (2022 low) long term bottom could be correcting the multi-decade downtrend or the start of a long term up trend. In either case, further rise should be seen to 100% projection of 0.9534 to 1.1274 from 1.0176 at 1.1916. This will remain the favored case as long as 1.1604 support holds.
USD/CHF Mid-Day Outlook
Daily Pivots: (S1) 0.7935; (P) 0.7972; (R1) 0.7994; More….
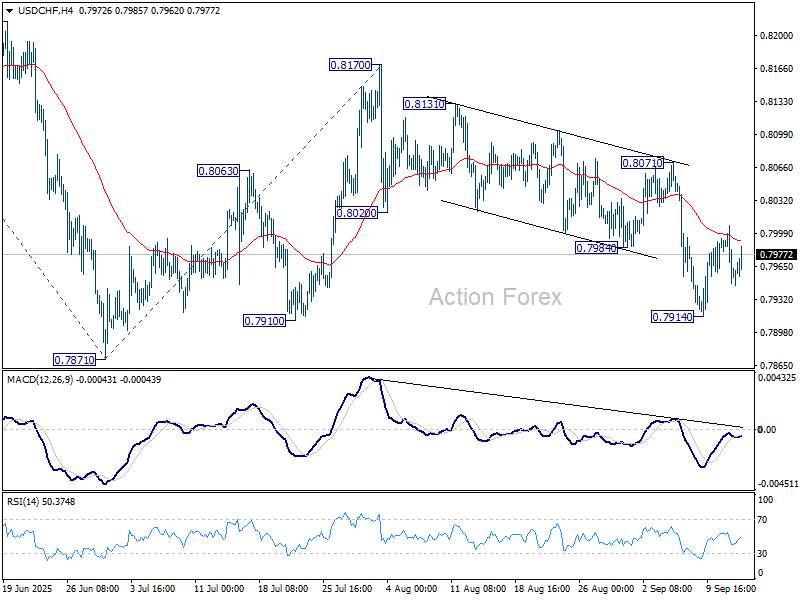
Intraday bias in USD/CHF remains neutral as range trading continues. Risk will stay on the downside as long as 0.8071 resistance holds. Below 0.7914 will bring retest of 0.7871 low. Firm break there will resume larger down trend. Next target is 61.8% projection of 0.8475 to 0.7871 from 0.8170 at 0.7797.
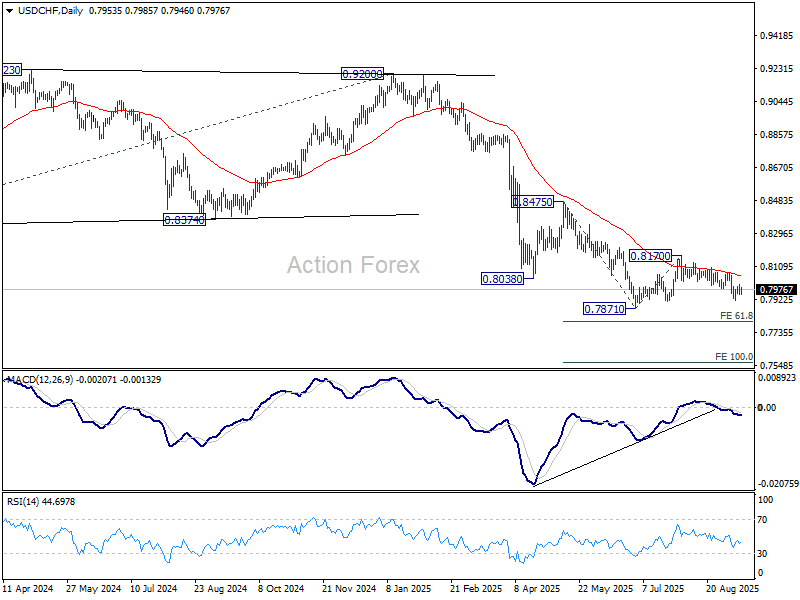
In the bigger picture, long term down trend from 1.0342 (2017 high) is still in progress. Next target is 100% projection of 1.0146 (2022 high) to 0.8332 from 0.9200 at 0.7382. In any case, outlook will stay bearish as long as 0.8475 resistance holds.
USD/JPY Mid-Day Outlook
Daily Pivots: (S1) 146.75; (P) 147.47; (R1) 147.94; More...
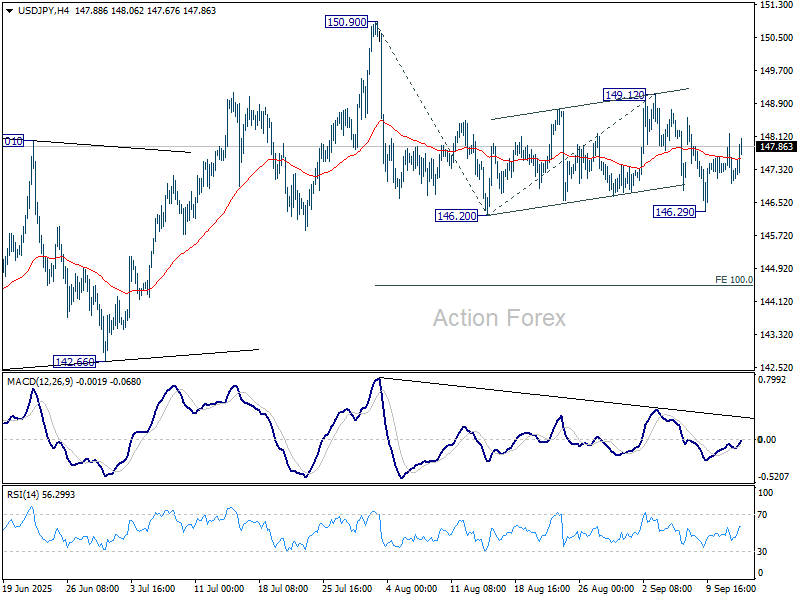
Range trading continues in USD/JPY and intraday bias stays neutral at this point. Risk will stay on the downside as long as 149.12 resistance holds. Firm break of 146.20 will target 100% projection of 150.90 to 146.20 from 149.12 at 144.42. Also, sustained trading below 55 D EMA (now at 147.16) will argue that whole rebound from 139.87 has completed with three waves up to 150.90.
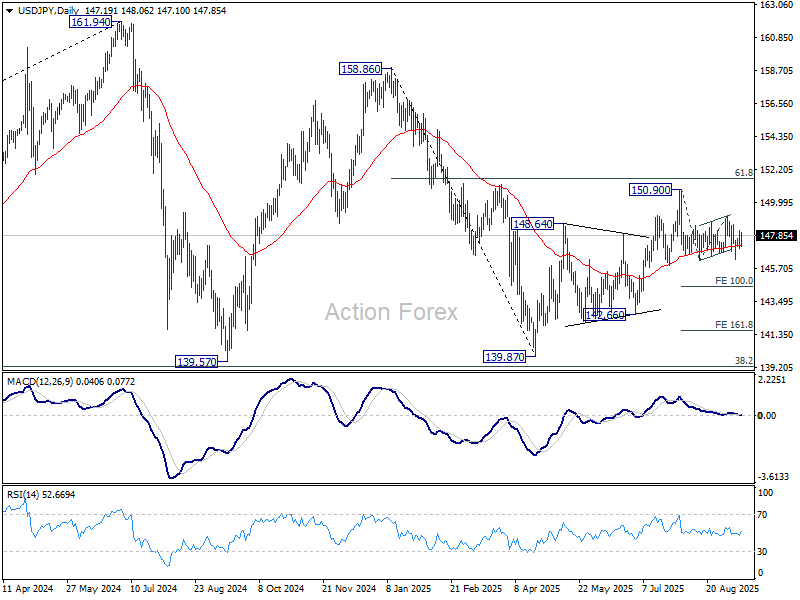
In the bigger picture, price actions from 161.94 (2024 high) are seen as a corrective pattern to rise from 102.58 (2021 low). Decisive break of 61.8% retracement of 158.86 to 139.87 at 151.22 will argue that it has already completed with three waves at 139.87. Larger up trend might then be ready to resume through 161.94 high. In case the corrective pattern extends with another fall, strong support is expected from 38.2% retracement of 102.58 to 161.94 at 139.26 to bring rebound.
GBP/USD Mid-Day Outlook
Daily Pivots: (S1) 1.3517; (P) 1.3550; (R1) 1.3606; More...
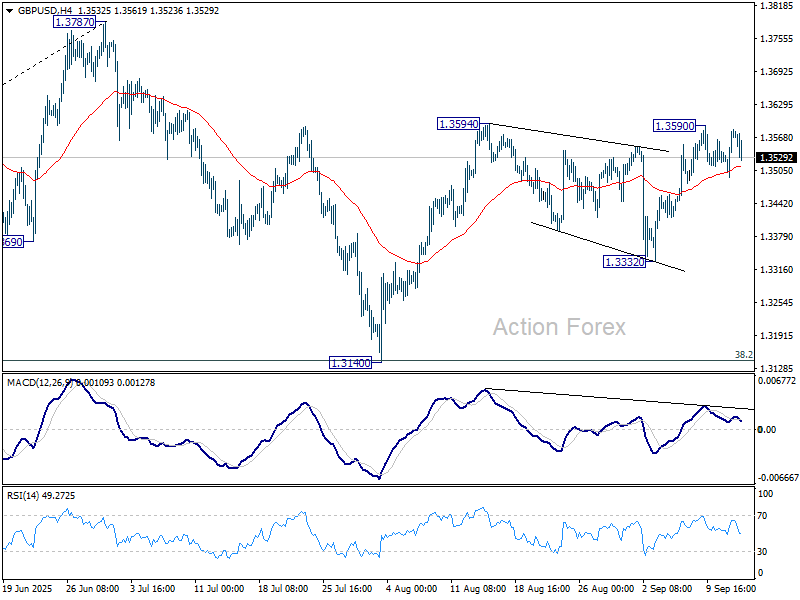
GBP/USD retreats mildly as consolidations continues below 1.3590 and intraday bias stays neutral. Further rise is expected with 1.3332 support intact. Firm break of 1.3594 will resume the rally from 1.3140 and target a retest on 1.3787 high.
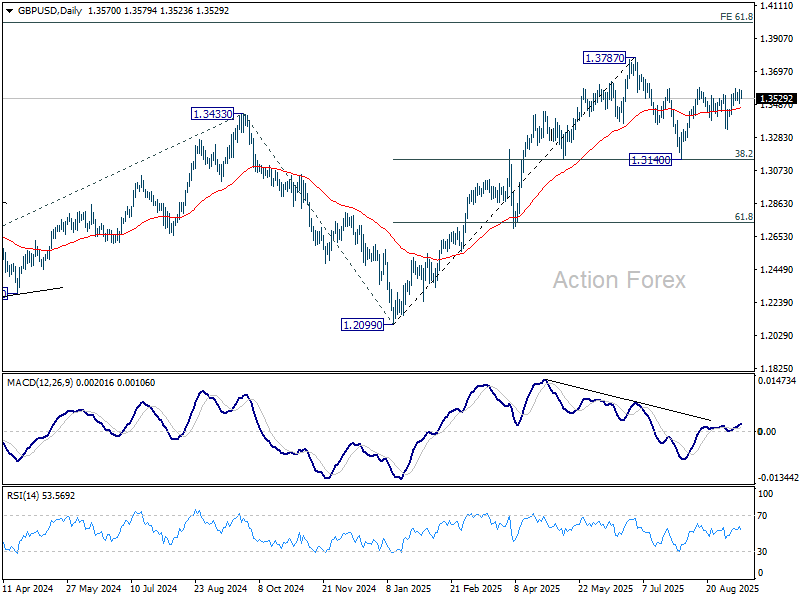
In the bigger picture, up trend from 1.3051 (2022 low) is in progress. Next medium term target is 61.8% projection of 1.0351 to 1.3433 from 1.2099 at 1.4004. Outlook will now stay bullish as long as 55 W EMA (now at 1.3132) holds, even in case of deep pullback.
Dollar Recovers Slightly, But Fed Cut Bets Cap Upside
Dollar steadied today, recovering modestly after yesterday's selling, though the move lacked conviction. With investors convinced the Fed will cut rates next week, the greenback remains capped, unable to mount a broader rebound. For now, the greenback is only outperforming Yen and Loonie. Yen remains under pressure from buoyant risk appetite, with the Nikkei setting fresh records just shy of the 45,000 mark. Loonie, meanwhile, is weighed down by expectations that the BoC will resume easing at its upcoming meeting.
Attention later in the session may briefly turn to University of Michigan consumer sentiment and inflation expectations. Still, any reaction is likely to be fleeting, as traders begin winding down ahead of the weekend and with next week’s FOMC meeting looming.
Weekly performance rankings show Aussie comfortably in the lead, followed by Kiwi and then Sterling. The Pound drew some support from a BoE survey showing rising public inflation expectations. At the bottom of the table, Yen is the weakest performer, followed by Loonie and then Euro. Dollar and Swiss Franc are positioned in the middle.
In Europe, at the time of writing, FTSE is up 0.36%. CAC is down -0.06%. CAC is down -0.26%. UK 10-year yield is up 0.047 at 4.657. Germany 10-year yield is up 0.06 at 2.72. Earlier in Asia, Nikkei rose 0.89%. Hong Kong HSI rose 1.16%. China Shanghai SSE fell -0.12%. Singapore Strait Times fell -0.27%. Japan 10-year JGB yield rose 0.024 to 1.602.
UK inflation expectations rise, BoE survey shows
The BoE/Ipsos Inflation Attitudes Survey showed UK households nudging inflation expectations higher. Median expectations for inflation over the next year rose to 3.6% from 3.2% in May, while two-year expectations climbed to 3.4% from 3.2%. Longer-term inflation expectations, five years out, also ticked up to 3.8% from 3.6%.
Concerns over rising prices were tied to broader pessimism about growth. By a margin of 69% to 6%, respondents said the economy would end up weaker rather than stronger if inflation accelerated, compared with 67% to 5% in May.
On the interest rate outlook, 33% of respondents expected rates to rise over the next 12 months, unchanged from May. But more people now expect stability, with 26% seeing no change versus 21% in May. The share expecting cuts fell to 29% from 34%, suggesting households are adjusting to the prospect of “higher for longer” rates.
When asked what would be best for the economy, 33% favored lower rates, down from 37% in May. Meanwhile, 28% preferred no change, up from 26%, and 14% wanted higher rates, up slightly from 12%. The responses suggest growing acceptance that policy will remain restrictive even as concerns about inflation remain elevated.
UK GDP stalls in July, services offset weak production
UK GDP was flat in July, matching expectations, as modest growth in services and construction offset a sharp drop in production. Services output rose 0.1% and construction gained 0.2%, while production fell -0.9%, highlighting ongoing weakness in the industrial sector.
Over the three months to July, GDP rose 0.2% compared with the previous three-month period. Services expanded 0.4% and remained the key driver of growth, while production fell -1.3% and construction rose 0.6%.
ECB officials stress uncertainty, keep options open after rate hold
Several ECB policymakers weighed in after the Governing Council held deposit rate steady at 2.00% yesterday.
Latvian member Martins Kazaks argued the central bank should not provide forward guidance given high geopolitical and economic uncertainty. He said December’s meeting will be crucial, as new staff forecasts will help determine whether inflation is deviating from target in a significant or persistent way.
Kazaks also flagged external factors, including the Euro’s strength— which can suppress import prices— and potentially deflationary Chinese exports as downside risks. “Uncertainty is high,” he said, adding this justifies a cautious, meeting-by-meeting policy stance.
Olli Rehn of Finland struck a similar note, warning about the disinflationary impact of cheaper energy and a stronger currency. He stressed the importance of avoiding inflation moving “too much below or too much above” the 2% objective,.
France’s Francois Villeroy de Galhau left the door open to further easing, saying “another rate cut is entirely possible” in coming meetings.
NZ BNZ manufacturing slips to 49.9, sector weakness persists, optimism patchy
The latest BusinessNZ PMI showed New Zealand’s manufacturing sector stalling in August, with the index slipping to 49.9 from 52.8. BusinessNZ’s Catherine Beard noted the industry “has yet to turn the corner toward sustained growth,” with the reading underscoring patchy conditions and fragile confidence despite being only marginally below the neutral threshold.
The breakdown highlighted a mixed picture. New Orders rose strongly to 55.2, the highest in two years, hinting at improving demand momentum, while raw material deliveries remained in expansion at 50.5. Offsetting this, production fell to 46.6, while employment (49.1) and finished stocks (47.1) also contracted, dragging the overall index lower.
Nearly six in ten respondents offered negative comments, citing flat sales, customer caution, rising costs, and global uncertainty as key drags. Although the proportion of negative feedback has eased from June’s high, sentiment remains weak, and businesses see recovery as tentative at best.
GBP/USD Mid-Day Outlook
Daily Pivots: (S1) 1.3517; (P) 1.3550; (R1) 1.3606; More...
GBP/USD retreats mildly as consolidations continues below 1.3590 and intraday bias stays neutral. Further rise is expected with 1.3332 support intact. Firm break of 1.3594 will resume the rally from 1.3140 and target a retest on 1.3787 high.
In the bigger picture, up trend from 1.3051 (2022 low) is in progress. Next medium term target is 61.8% projection of 1.0351 to 1.3433 from 1.2099 at 1.4004. Outlook will now stay bullish as long as 55 W EMA (now at 1.3132) holds, even in case of deep pullback.
WTI Crude Technical: Weakness Prevails Below US$64.36/Barrel as Geopolitical Risk Premium Fizzles Out
The price actions of the West Texas Oil CFD (a proxy for the WTI crude futures) have declined by -7% from the 2 September 2025 high of US$66.52 to last Friday, 5 September 2025 low of US$61.85 on the backdrop of a weaker global demand, primarily on the deteriorating US labour market.
The recent bounce of 4% from its 5 September 2025 low to Wednesday, 10 September 2025 high of US$64.27 has been attributed to OPEC+’s modest production hike of 137,000 barrels per day (bpd) from October, announced on Sunday, 7 September significantly smaller than the previous monthly hikes of about 555,000 bpd in August and September, and 411,000 bpd in June and July as well as an uptick in geopolitical risk premium factor.
Interestingly, the three consecutive days of rallies on the West Texas Oil CFD were halted on Thursday, 11 September, during the Asia session before the release of US CPI inflation and weekly initial jobless claims data.
Let’s now examine the short-term (1 to 3 days) trajectory of the West Texas Oil CFD, the key levels to watch, and key elements ahead of the release of a key demand-related US economic data, the preliminary September reading of the University of Michigan’s consumer sentiment, out later today at 14:00 GMT.
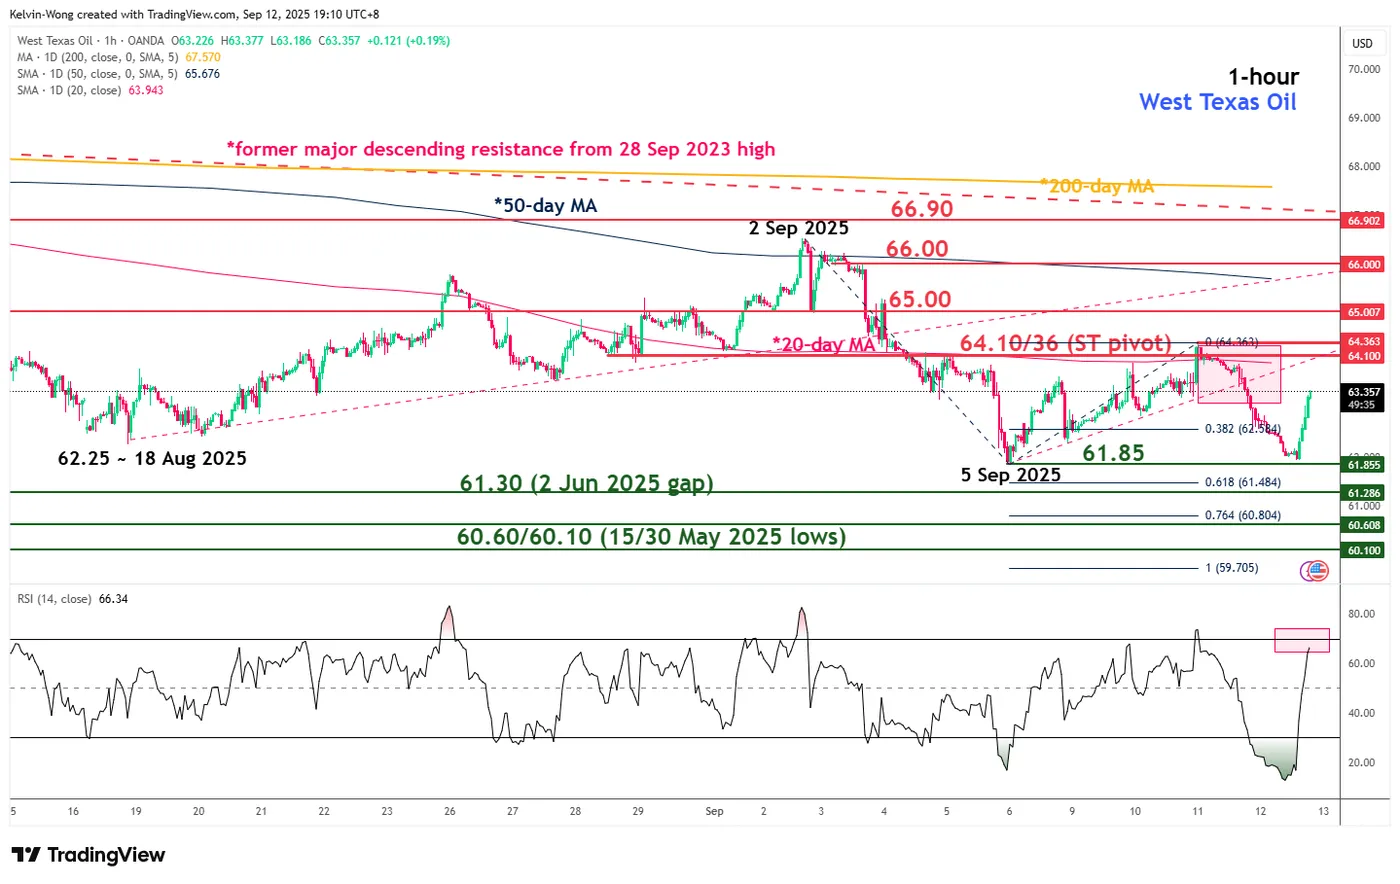
Fig. 1: West Texas Oil CFD minor trend as of 12 Sep 2025 (Source: TradingView)
Preferred trend bias (1-3 days)
A continuation of the West Texas Oil CFD’s minor downtrend phase from the 2 September 2025 high of US$66.52.
Bearish bias below US$64.10/64.36 key short-term pivotal resistance to expose the next immediate supports at US$61.30 and US$60.60/60.10 (also close to a Fibonacci extension).
Key elements
- The price actions of West Texas Oil CFD have staged a bearish reaction right at the downward sloping 20-day moving average and broken below the minor ascending support from the 5 September 2025 low.
- The hourly RSI momentum indicator has inched high, and it is now fast approaching its overbought region (above 70), which suggests that the current intraday bounce of 2.3% from today (Friday), 12 September, Asian session low of US$61.93 may fizzle out soon.
Alternative trend bias (1 to 3 days)
A clearance above US$64.36 invalidates the bearish scenario and triggers a mean reversion rebound towards the next intermediate resistances at US$65.00 and US$66.00 (also close to the downward sloping 50-day moving average).
EUR/USD Digests Data Ahead of Fed Decision
The EUR/USD pair held steady around 1.1727 USD on Friday, as the US dollar remained under pressure following the release of inflation data that largely met expectations. The figures reinforce the Federal Reserve’s scope to ease monetary policy amid growing signs of labour market softening.
The US August inflation report showed consumer prices rose 0.4% month-on-month, slightly above the forecast of 0.3%, while the annual rate came in at 2.9%, matching expectations. Meanwhile, initial jobless claims increased by 27,000 to 263,000 – the highest level since 2021 – underscoring emerging weakness in the employment sector.
Interest rate futures now indicate a 93% probability of a 25-basis-point cut at the Fed’s 17 September meeting. Market speculation around a more aggressive 50-basis-point reduction is also gradually building.
Across the Atlantic, the European Central Bank left its key rate unchanged at 2.0% for the second consecutive meeting. In political developments, the US and Japan issued a joint statement emphasising that exchange rates should be market-determined and that excessive volatility is undesirable.
Technical Analysis: EUR/USD
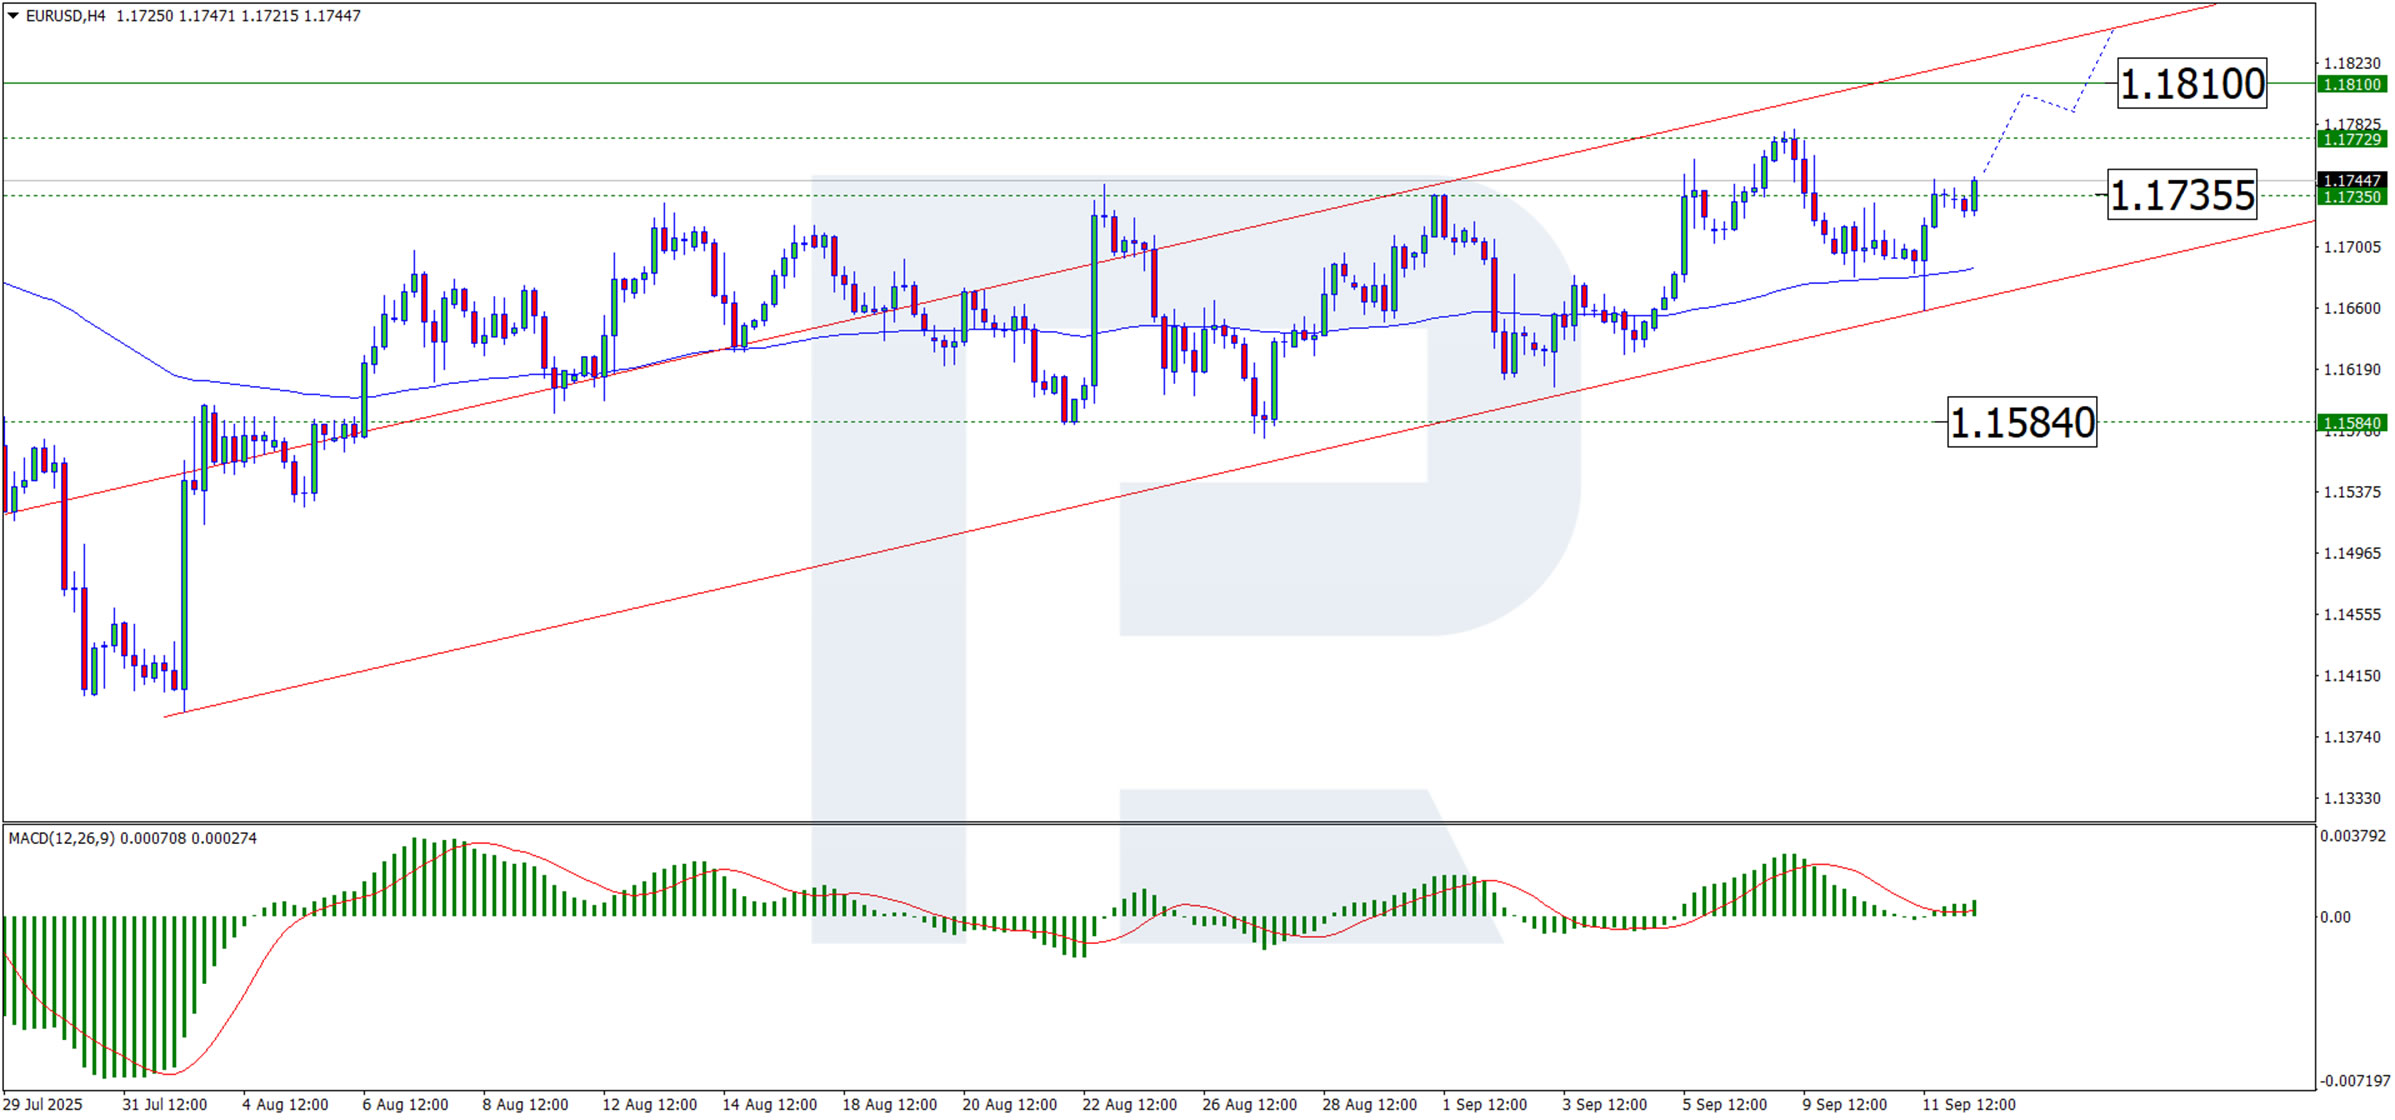
H4 Chart:
On the H4 chart, EUR/USD has completed an upward move towards 1.1735 USD. A sustained break above this resistance level signals a continuation of the broader uptrend. However, a short-term pullback toward this level – now potentially acting as support – cannot be ruled out.The MACD indicator supports further gains: both the histogram and signal line remain above zero and are rising, confirming bullish momentum. The primary outlook favours an extension towards 1.1810 USD, with a further target at 1.1870 USD, though intermittent corrections may occur.
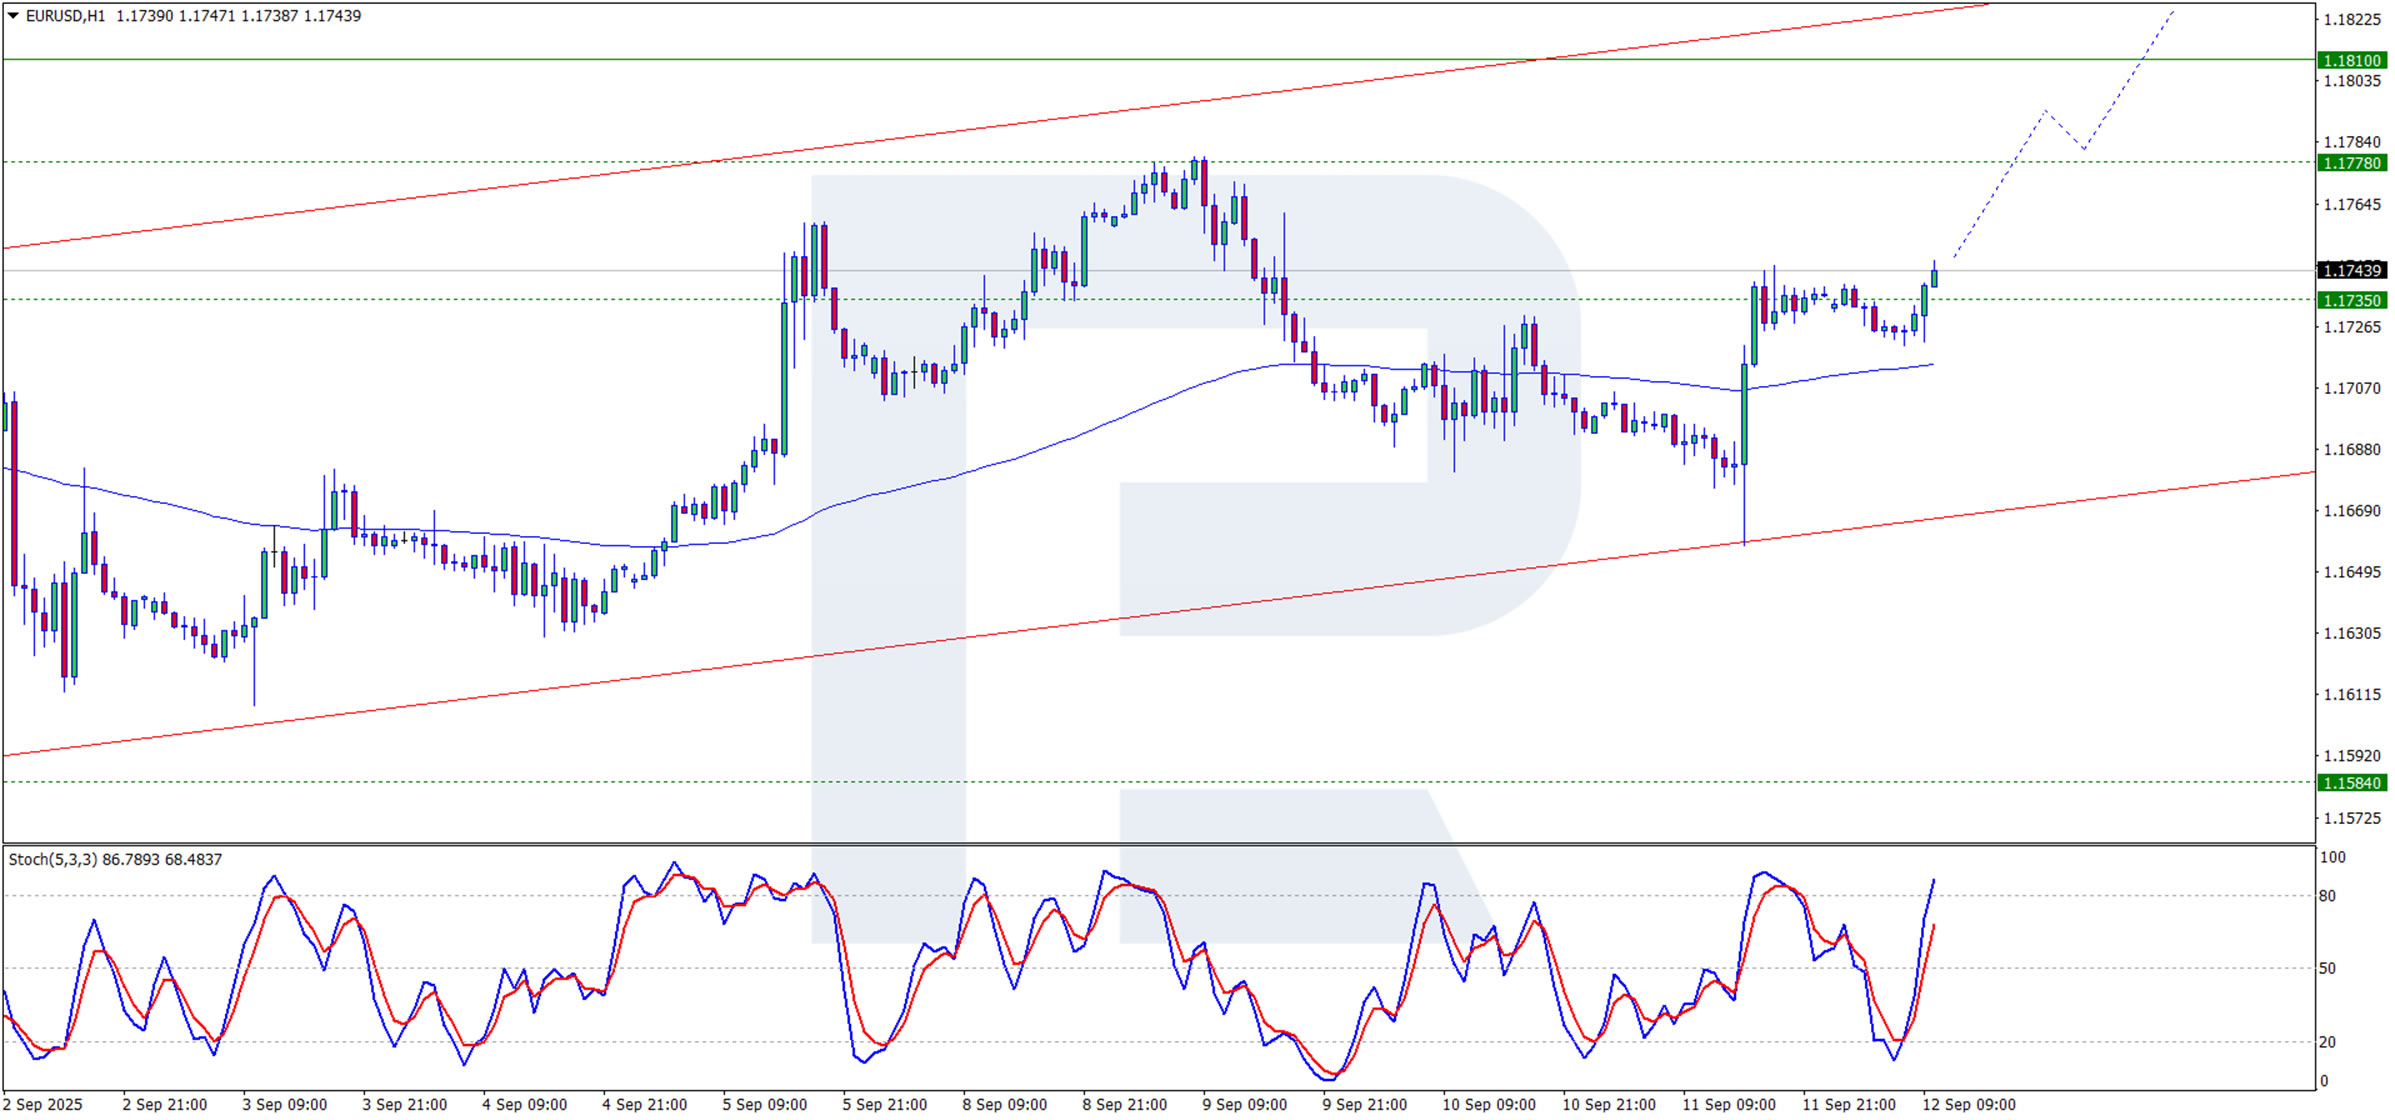
H1 Chart:
On the H1 chart, the pair is testing resistance and showing signs of consolidation. A clear break above 1.1735 USD may trigger another leg higher. The Stochastic oscillator is testing the 80 level, suggesting strong upward momentum remains intact. The near-term upside target is 1.1810 USD.
Conclusion
EUR/USD remains well-supported as markets price in growing Fed dovishness, driven by softening labour data and stable inflation. With the ECB maintaining a steady stance and risk sentiment cautiously optimistic, the pair looks poised to extend gains, pending next week’s Fed decision. Technically, the path of least resistance appears upward, though a brief retracement may offer entry opportunities ahead of further advances.
UK inflation expectations rise, BoE survey shows
The BoE/Ipsos Inflation Attitudes Survey showed UK households nudging inflation expectations higher. Median expectations for inflation over the next year rose to 3.6% from 3.2% in May, while two-year expectations climbed to 3.4% from 3.2%. Longer-term inflation expectations, five years out, also ticked up to 3.8% from 3.6%.
Concerns over rising prices were tied to broader pessimism about growth. By a margin of 69% to 6%, respondents said the economy would end up weaker rather than stronger if inflation accelerated, compared with 67% to 5% in May.
On the interest rate outlook, 33% of respondents expected rates to rise over the next 12 months, unchanged from May. But more people now expect stability, with 26% seeing no change versus 21% in May. The share expecting cuts fell to 29% from 34%, suggesting households are adjusting to the prospect of “higher for longer” rates.
When asked what would be best for the economy, 33% favored lower rates, down from 37% in May. Meanwhile, 28% preferred no change, up from 26%, and 14% wanted higher rates, up slightly from 12%. The responses suggest growing acceptance that policy will remain restrictive even as concerns about inflation remain elevated.