Sample Category Title
USD/JPY Daily Outlook
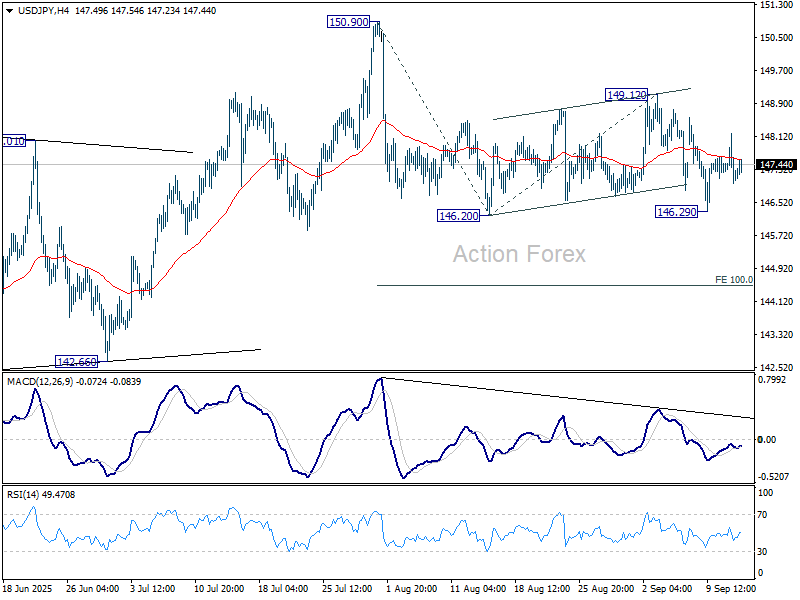
Daily Pivots: (S1) 146.75; (P) 147.47; (R1) 147.94; More...
Outlook is unchanged in USD/JPY and intraday bias remains neutral. Risk will stay on the upside as long as 149.12 resistance holds. Firm break of 146.20 will target 100% projection of 150.90 to 146.20 from 149.12 at 144.42. Also, sustained trading below 55 D EMA (now at 147.16) will argue that whole rebound from 139.87 has completed with three waves up to 150.90.
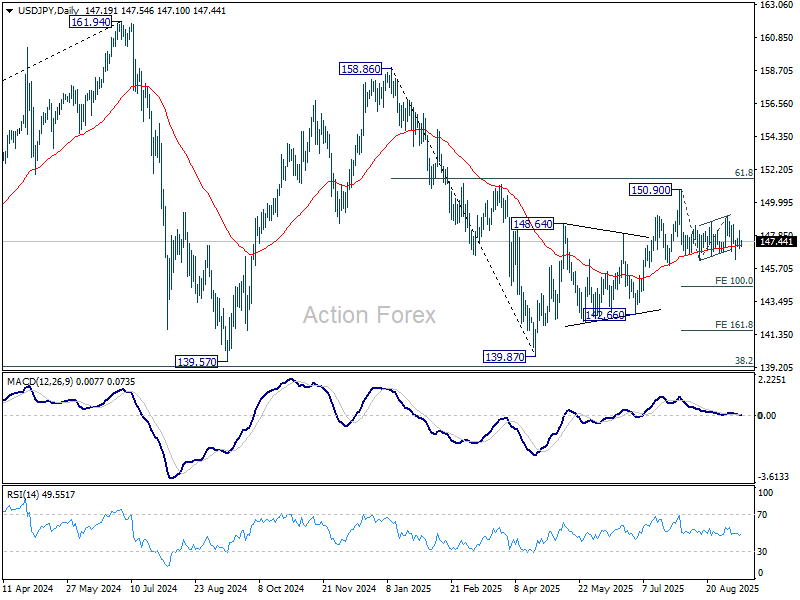
In the bigger picture, price actions from 161.94 (2024 high) are seen as a corrective pattern to rise from 102.58 (2021 low). Decisive break of 61.8% retracement of 158.86 to 139.87 at 151.22 will argue that it has already completed with three waves at 139.87. Larger up trend might then be ready to resume through 161.94 high. In case the corrective pattern extends with another fall, strong support is expected from 38.2% retracement of 102.58 to 161.94 at 139.26 to bring rebound.
GBP/USD Daily Outlook
Daily Pivots: (S1) 1.3517; (P) 1.3550; (R1) 1.3606; More...
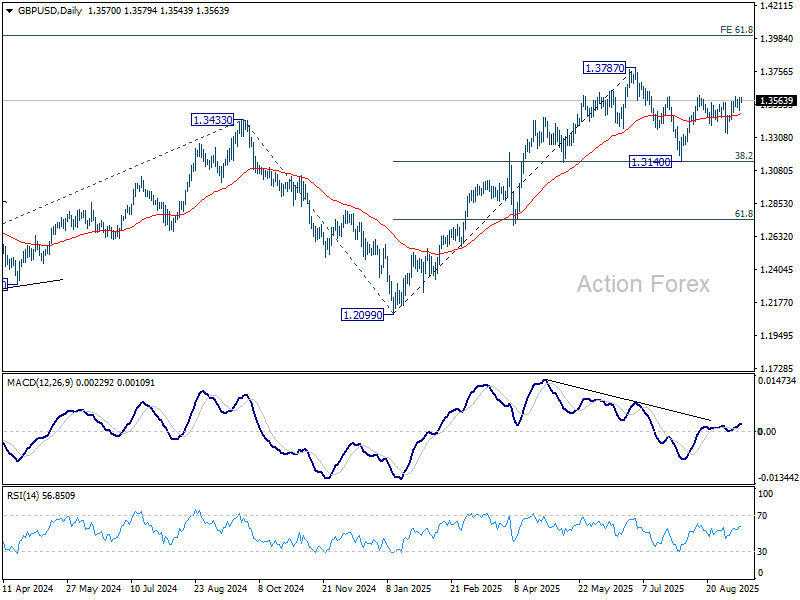
Intraday bias in GBP/USD remains neutral and more consolidations could be seen below 1.3590 temporary top. Further rise is expected with 1.3332 support intact. Firm break of 1.3594 will resume the rally from 1.3140 and target a retest on 1.3787 high.
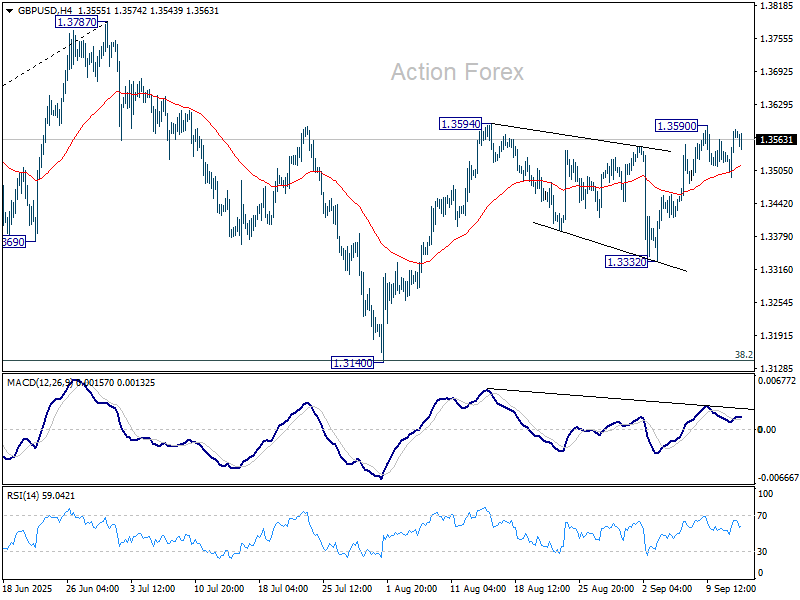
In the bigger picture, up trend from 1.3051 (2022 low) is in progress. Next medium term target is 61.8% projection of 1.0351 to 1.3433 from 1.2099 at 1.4004. Outlook will now stay bullish as long as 55 W EMA (now at 1.3132) holds, even in case of deep pullback.
USD/CHF Daily Outlook
Daily Pivots: (S1) 0.7935; (P) 0.7972; (R1) 0.7994; More….
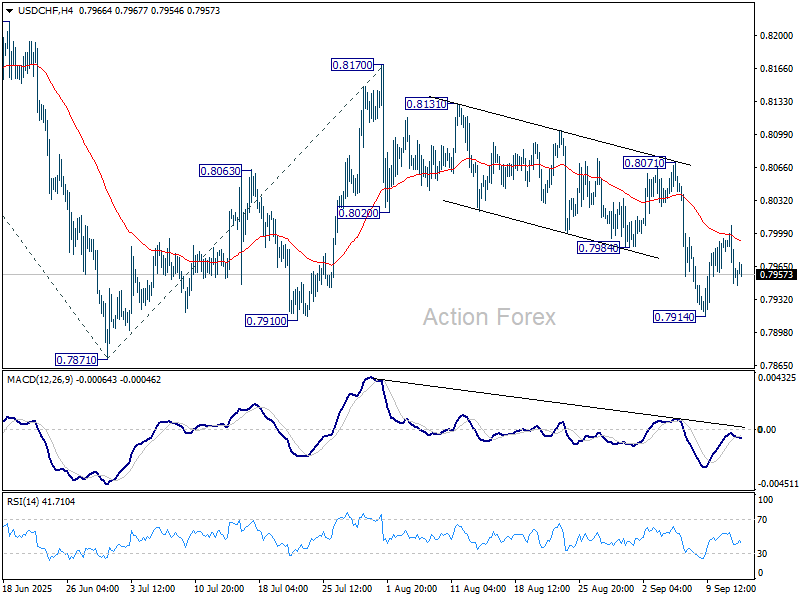
USD/CHF reversed after rejection by 55 4H EMA, but stays above 0.7914 temporary low. Intraday bias remains neutral, and risk will stay on the downside as long as 0.8071 resistance holds. Below 0.7914 will bring retest of 0.7871 low. Firm break there will resume larger down trend. Next target is 61.8% projection of 0.8475 to 0.7871 from 0.8170 at 0.7797.
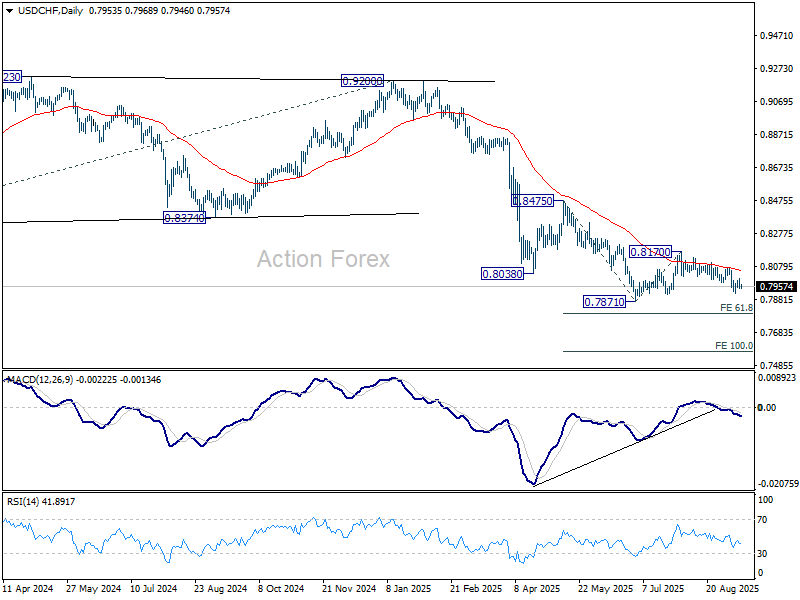
In the bigger picture, long term down trend from 1.0342 (2017 high) is still in progress. Next target is 100% projection of 1.0146 (2022 high) to 0.8332 from 0.9200 at 0.7382. In any case, outlook will stay bearish as long as 0.8475 resistance holds.
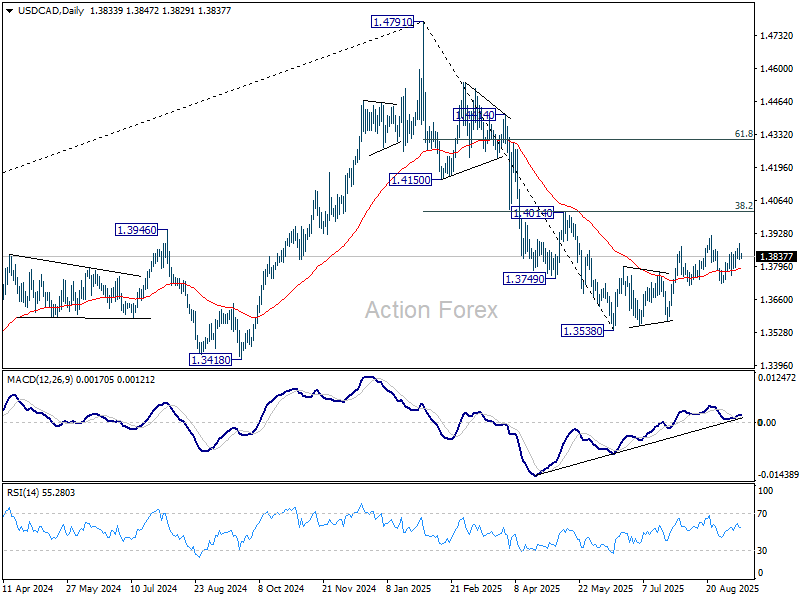
USD/CAD Daily Outlook
Daily Pivots: (S1) 1.3810; (P) 1.3850; (R1) 1.3875; More...
Intraday bias in USD/CAD remains neutral at this point. On the upside, firm break of 1.3923 resistance will resume whole corrective rebound from 1.3538. However, sustained break of 1.3725 will argue that the rebound has completed at 1.3923, and turn near term outlook bearish.
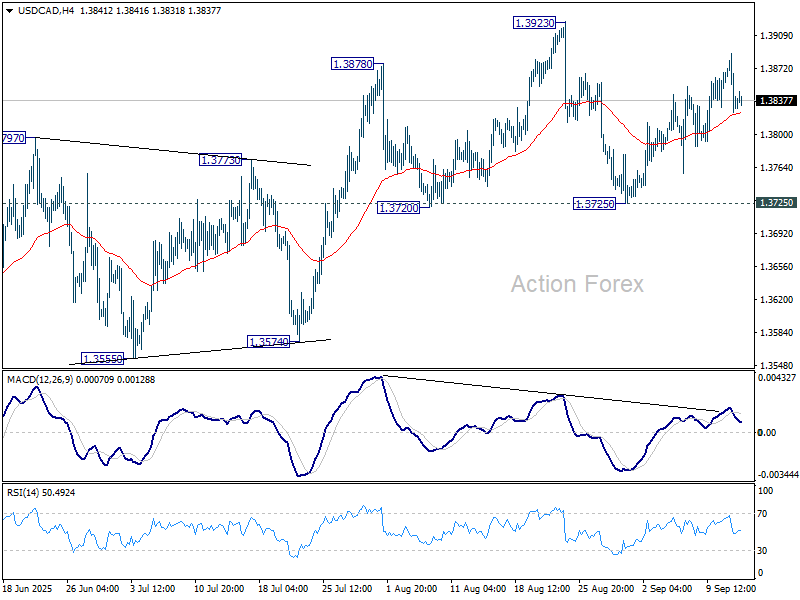
In the bigger picture, price actions from 1.4791 medium term top could either be a correction to rise from 1.2005 (2021 low), or trend reversal. In either case, further decline is expected as long as 1.4014 cluster resistance (38.2% retracement of 1.4791 to 1.3538 at 1.4017) holds. Next target is 61.8% retracement of 1.2005 (2021 low) to 1.4791 at 1.3069.
US Equities Still Gain on Mildly Bad News
Markets
Weekly jobless claims outweighed the ECB policy meeting, US CPI and a 30-y Treasury auction yesterday! The ECB as expected left its policy rate unchanged at 2%. New staff projections were little changed from June, basically confirming inflation has returned close to target and is expected to stay there over the policy horizon. (2.1% from 2% for this year; 1.7% from 1.6% in 2026 and 1.9% from 2% in 2027). Projections for core inflation were little changed and confirm 2% price stability as well. Growth was upwardly revised for this year 1.2% (due to a strong start of the year). It will ease next year to 1% .However, the context isn’t that bad with uncertainty on tariffs easing and fiscal support supporting activity further out. Interestingly, during the press conference, the ECB chair guided that risks to growth have become more balanced and, even stronger, that the ‘disinflation process is over’. Even in a data-dependent approach, this doesn’t suggest any further easing anymore. The German yield curve bear flattened with yields rising 3.4 bps at the short end (2-y). The 30-y declined marginally. Market pricing of a final ECB rate cut next year dropped to less than 50%. In the US, intraday market volatility was mainly driven by a sharp jump in US jobless claims (263k from 236k). US August CPI data didn’t bring the hoped for soft surprise as was the case for PPI on Wednesday. Headline inflation rose 0.4% M/M and 2.9% Y.Y (from 2.7%). Core prices added 0.3% M/M and 3.1% Y/Y. The follow-though of tariffs to consumers remains under control (at least of now). US yields initially spiked lower on the jobless claims (2-y below 3.5%; 10-y below 4%), but the move again couldn’t be sustained. At the end of the day, the US yield curve even slightly bull flattened with the 2-y only marginally lower (-0.2 bps) and the 30-y easing 4.25 bps supported by a solid 30-y auction. The euro outperformed but with an EUR/USD close at 1.1734, the tight sideways consolidation pattern easily holds. US equities still gain on mildly bad news/easing of financial conditions, with the three major indices closing at record levels. (Dow +1.36%).
Today’s eco calendar is thin in Europe. Even so, markets will keep a close look at Moody’s reassessing its credit rating of France (AA- with negative outlook). Will the agency reduce the rating to the A-category? In the US, the Michigan consumer confidence survey contains the closely watched inflation expectations gauges, but we don’t expect these to profoundly change the markets’ assessment for next week’s Fed meeting. Last but not least, US Congressional Budget Office updates its economic forecast to include the macro-economic effects of tariffs (period 2025-2028). Of late, markets tended to embrace a scenario that tariffs might at least partially mitigate the negative impact on budget/the debt trajectory of the Big Beautiful bill. If this is confirmed by CBO, it might, at least temporary, mitigate fiscal risk premia (at the long end of the US yield curve). Even so, we stay cautious to see the US 10-y yield settling below the 4% barrier for a long period.
News & Views
The International Energy Agency is projecting an ever bigger record oil surplus for 2026. In updated forecasts, the agency rose estimates for global oil demand this year and the next slightly to 740k bpd, citing weaker oil prices and a “somewhat improved” economic outlook. Output, however, will exceed consumption by an average of 3.33 mln bpd in 2026 with the number even higher in H1 2026 (4 mln barrels per day). The 2026 average is 360k more than expected last month’s report and a record, barring the 2020 pandemic episode. IEA’s assessment followed the OPEC+ decision this weekend to restore a new layer of halted supplies by more than a year early. Oil prices fell yesterday and continue to do so this morning. Brent returns to the lower bound of the summer trading range around $65/b..
Gold prices over the last couple of days hit another record near the $3650 area. While the precious metal has already set more than 30 nominal records so far this year, the latest surge meant it has also topped the inflation-adjusted peak set in 1980. Demand for gold has been strong with the usual suspects having sustained a blistering rally: from geopolitical uncertainty over lingering inflation woes to huge debt buildup and the prospect of Fed rate cuts. Central banks are among the major buyers while ETF inflows have shot up too..”
AUD/USD Daily Report
Daily Pivots: (S1) 0.6612; (P) 0.6639; (R1) 0.6687; More...
AUD/USD's rally continues today and intraday bias stays on the upside. Current rally from 0.5913 should target 0.6713 fibonacci level. Decisive break there will carry larger bullish implications. On the downside, below 0.6589 minor support will turn intraday bias neutral first and bring consolidations.

In the bigger picture, there is no clear sign that down trend from 0.8006 (2021 high) has completed. Rebound from 0.5913 is seen as a corrective move. While stronger rally cannot be ruled out, outlook will remain bearish as long as 38.2% retracement of 0.8006 to 0.5913 at 0.6713 holds. Nevertheless, considering bullish convergence condition in W MACD, sustained break of 0.6713 will be a strong sign of bullish trend reversal, and path the way to 0.6941 structural resistance for confirmation.

Risk-On Momentum Builds, Aussie Shines
Risk-on sentiment gripped markets on Friday, driving the Nikkei to fresh record highs in Asia after Wall Street’s main indexes closed at record levels overnight. Investors added to bets on faster Fed easing following the sharp jump in U.S. jobless claims, reinforcing the view that back-to-back cuts are on the way. The dovish shift has boosted equity markets globally, while weighing on Dollar as traders prepare for more policy support.
In FX, Aussie and Kiwi dollars are the clear outperformers for the week so far. Both are buoyed not only by risk-on flows but also by growing expectations that China will step up stimulus measures to support domestic demand. Rising Chinese equity markets and strong commodity sentiment have amplified the move. Sterling ranks as the third strongest, with its performance notable given soft UK GDP data that reinforced signs of a renewed slowdown. Traders appear to be giving more weight to global risk appetite than domestic headwinds.
On the weaker side, Loonie continues to lag as markets expect the BoC to resume its rate-cutting cycle this month. Dollar is also under pressure, followed closely by the Yen, which is weighed down by the Nikkei’s surge to new records and the accompanying outflows. Euro and Swiss Franc are trading in the middle of the pack.
On the trade front, Washington is preparing to pressure G7 partners to impose higher tariffs on China and India over their continued imports of Russian oil. According to a Kyodo report, U.S. officials will push the issue at a virtual G7 finance ministers’ meeting Friday, underscoring the White House’s push to tighten funding channels for Moscow. The U.S. has already imposed punitive duties on India, while China has been shielded by a temporary tariff truce.
Meanwhile, China warned Mexico against planned tariff hikes on Asia-made autos, calling the move a threat to free trade. The Mexican government is considering raising duties from 20% to 50%, targeting Chinese exports in particular. Separately, U.S. Treasury Secretary Scott Bessent will meet Chinese Vice Premier He Lifeng in Madrid next week, marking their fourth major dialogue this year as both sides work to maintain their tariff truce through November.
In Asia, Nikkei closed at new record, up 0.97%. Hong Kong HSI is up 1.31%. China Shanghai SSE is up 0.01%. Singapore Strait Times is down -0.23%. Japan 10-year JGB yield rose 0.014 to 1.592. Overnight, DOW rose 1.36%. S&P 500 rose 0.85%. NASDAQ rose 0.72%. 10-year yield hit intraday low of 3.966 then closed at 4.011, down -0.021.
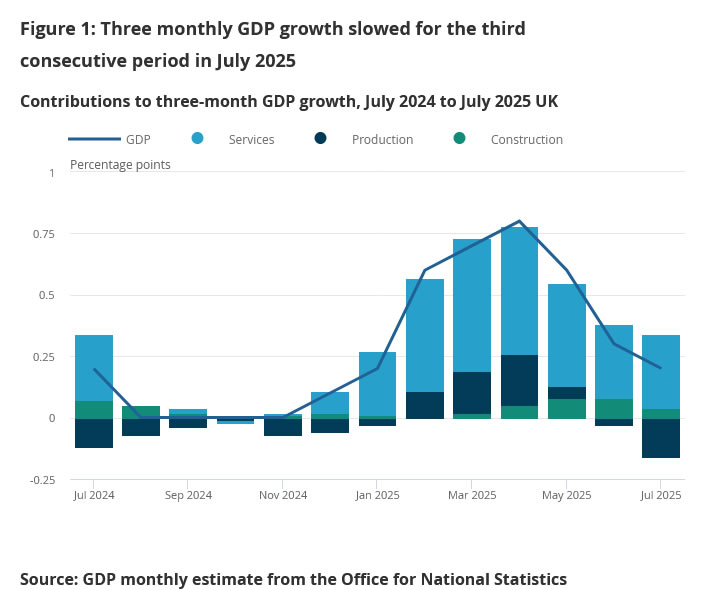
UK GDP stalls in July, services offset weak production
UK GDP was flat in July, matching expectations, as modest growth in services and construction offset a sharp drop in production. Services output rose 0.1% and construction gained 0.2%, while production fell -0.9%, highlighting ongoing weakness in the industrial sector.
Over the three months to July, GDP rose 0.2% compared with the previous three-month period. Services expanded 0.4% and remained the key driver of growth, while production fell -1.3% and construction rose 0.6%.
NZ BNZ manufacturing slips to 49.9, sector weakness persists, optimism patchy
The latest BusinessNZ PMI showed New Zealand’s manufacturing sector stalling in August, with the index slipping to 49.9 from 52.8. BusinessNZ’s Catherine Beard noted the industry “has yet to turn the corner toward sustained growth,” with the reading underscoring patchy conditions and fragile confidence despite being only marginally below the neutral threshold.
The breakdown highlighted a mixed picture. New Orders rose strongly to 55.2, the highest in two years, hinting at improving demand momentum, while raw material deliveries remained in expansion at 50.5. Offsetting this, production fell to 46.6, while employment (49.1) and finished stocks (47.1) also contracted, dragging the overall index lower.
Nearly six in ten respondents offered negative comments, citing flat sales, customer caution, rising costs, and global uncertainty as key drags. Although the proportion of negative feedback has eased from June’s high, sentiment remains weak, and businesses see recovery as tentative at best.
AUD/USD Daily Report
Daily Pivots: (S1) 0.6612; (P) 0.6639; (R1) 0.6687; More...
AUD/USD's rally continues today and intraday bias stays on the upside. Current rally from 0.5913 should target 0.6713 fibonacci level. Decisive break there will carry larger bullish implications. On the downside, below 0.6589 minor support will turn intraday bias neutral first and bring consolidations.
In the bigger picture, there is no clear sign that down trend from 0.8006 (2021 high) has completed. Rebound from 0.5913 is seen as a corrective move. While stronger rally cannot be ruled out, outlook will remain bearish as long as 38.2% retracement of 0.8006 to 0.5913 at 0.6713 holds. Nevertheless, considering bullish convergence condition in W MACD, sustained break of 0.6713 will be a strong sign of bullish trend reversal, and path the way to 0.6941 structural resistance for confirmation.
Fed Doves, AI Fuel Global Risk Rally
In just one sentence: yesterday’s fresh data from the US gave the green light for next week’s Federal Reserve (Fed) cut. It’s not that the inflation data matters much at this stage – all attention is shifting toward the weakening US jobs market – but yesterday’s CPI figures, broadly in line with expectations, combined with a jump in initial jobless claims, gave full justification to those calling for a Fed cut next week. Two more cuts are already fully priced in before year-end. That’s the good news.
The bad news is, unless a Fed official hints at the very last minute that rates could be cut by 50bp – as happened last September – next week’s move will almost certainly be limited to 25bp. Markets put the odds of that scenario above 90%, versus just 7.5% for a half-point cut. The reason is that tariff- and weather-related price pressures remain visible. Coffee prices jumped 20% in a year, beef more than 16% and apples nearly 10%. Both headline and core inflation rose to their highest levels of the year – though without the kind of surge we’ve been seeing in the jobs data for more than a month.
Jobless claims spiked yesterday to their highest in four years. Many see that as confirmation of a crumbling US labour market, though others note the rise was concentrated in Texas with declines elsewhere – which is certainly less worrying than a broad-based increase.
Long story short: inflation is rising, but not spiking. That argues for cuts at a cautious pace. Inflation risks haven’t vanished. Any sudden flare-up could spoil dovish Fed expectations.
But investors are calm: the US 2-year yield barely moved, the dollar failed to clear offers near the 50-day moving average, while the S&P 500 leapt to a fresh all-time high. On one hand, strong earnings reassure investors about corporate health. On the other, a weaker jobs market and the prospect of lower rates inflate valuations. For now, whatever the news, markets find a reason to celebrate.
Across the Atlantic, the European Central Bank (ECB) was less dovish. The Bank kept rates unchanged, as expected, and Christine Lagarde said economic risks are abating and deflation fears are mostly behind– in other words, no more cuts for now. The probability of another move before mid-next year fell below 50%, from over 60% prior to the meeting. Still, the Stoxx 600 climbed on the back of dovish Fed expectations, while the EURUSD rebounded from its 50-day moving average on Fed/ECB policy divergence. Resistance remains firm near 1.18, with French budget concerns lingering in the background.
Elsewhere, gold continues to benefit from dovish Fed bets, a softer dollar and yields, and ongoing geopolitical unease, pushing toward record highs. US crude, by contrast, slipped below $62 per barrel, shrugging off heightened tensions after Russian drones violated Polish airspace earlier this week. Next support sits near $60pb.
In Asia, Chinese equities rallied strongly. Alibaba jumped 8% yesterday after announcing a $3.2 billion convertible bond issue, with 80% of proceeds going into data centers and 20% into international commerce. Normally, such fundraising weighs on shares. But this time, investors cheered the signal of heavier investment in AI – now the company’s fastest-growing business line amid weakness in e-commerce and trade war headwinds. Despite a 140% rally this year, Alibaba still trades at half its 2020 valuation. The shift toward local chips to keep Beijing’s support also fueled gains at SMIC, up around 10% this week.
Speaking of chips: South Korea’s SK Hynix rose nearly 7% after announcing completion of the world’s first HBM4 memory development – a technology that stacks memory chips vertically with ultra-wide input/output paths, enabling massive data throughput at far higher energy efficiency. The company says it is now ready for mass production. For investors eyeing opportunities beyond US tech, SK Hynix trades on a modest ~7 PE ratio.
Weak Jobless Claims Leave a Tricky Backdrop for the Fed
In focus today
In the US, rounding off this week's series of inflation releases, the University of Michigan's preliminary September consumer sentiment survey is due for release today. Markets will focus on consumers' inflation expectations, which have remained clearly elevated amid tariff concerns.
In China, early Monday brings the release of the monthly data dump, covering key areas of the economy. Focus will again be on retail sales and housing, which have weakened in recent months in contrast with government goals. We look for data to remain weak, as confidence is low and no decisive new stimulus has been introduced to lift household demand.
Have a great weekend!
Economic and market news
What happened yesterday
In the US, August CPI surprised slightly to the topside, with headline inflation coming in at 0.4% m/m SA (forecast: 0.3%, prior: 0.2%) and core inflation at a 'high' 0.3% m/m SA (forecast: 0.3%, prior: 0.3%). Inflation was primarily driven by housing and food prices, while core goods and other services remained steady. There were no strong indications of tariff pass-through in the data. Read more in Global Inflation Watch - Tariff pass-through still in progress, 11 September. Initial jobless claims rose to 263k (prior: 237k) - the highest level since 2021. Over half of the uptick stemmed from Texas, while declines in other large states suggest a potential one-off. The combination of rising claims and increasing inflation presents a tricky backdrop for the Fed.
In the euro area, the ECB kept policy rates steady with the deposit rate at 2.00%, as widely expected. Staff projections revealed a dovish twist, with the 2027 inflation forecast revised down to 1.9% y/y (prior: 2.0%) and core inflation to 1.8% (prior: 1.9%). However, President Lagarde downplayed the revisions at the press conference, highlighting a balanced growth outlook for the first time since September 2023. Markets reacted hawkishly, and we expect no policy rate changes from the ECB in 2025 or 2026. Read more in our ECB Review - Confident despite inflation below target in 2027, 11 September.
In Norway, the Regional Network Survey aligned with expectations. Capacity utilisation remained unchanged at 35%, reducing the risk of upward pressure on the rate path. While the labour shortage edged up from 23% to 25%, its impact was diminished by stable employment prospects and unchanged wage growth expectations of 4.5% this year and 4.0% next year. Growth was also steady, with the production index at 0.4% for both this and next quarter, matching forecasts. Overall, the report suggests domestic demand will not influence the rate path, keeping Norges Bank on track for a September rate cut.
In Sweden, final inflation details for August aligned broadly with flash estimates. Clothing prices were slightly higher and furniture prices somewhat lower, while key seasonal components (car rentals, air tickets, package holidays) followed the expected large m/m declines. However, these declines were insufficient to meet the Riksbank's forecast, slightly denting their "summer inflation" narrative. That said, the Riksbank may find reassurance in the potential for further seasonal declines in September. We still expect the Riksbank to hold rates steady in September, with a 25bp cut likely in November.
Also in Sweden, the PES unemployment rate ticked slightly lower to 7.0% (prior 7.1%).
Equities: Equities extended their surge yesterday with fresh ATHs across several indices. Importantly, the rally was not narrowly driven but broad-based (tech underperforming) and unsurprisingly led by cyclicals.
The equity narrative is narrowing further around the Fed. With just over three months left of the year, markets now price close to three consecutive cuts one at each remaining FOMC meeting. This remains the key driver for equity sentiment, regardless of whether the cuts are growth- or inflation-driven, which in itself is not entirely comforting. Still, experience shows that fighting this type of momentum is costly as long as the fundamental backdrop remains intact. As flagged yesterday, the investor focus was not on the ECB but on US data. In the US yesterday, Dow +1.4%, S&P 500 +0.9%, Nasdaq +0.7%, Russell 2000 +1.8%. Asian markets are higher this morning, European futures point higher as well, while US futures trade broadly flat.
FI and FX: It was a very eventful session yesterday in both global and Scandi FI and FX markets. Returning labour market concerns in the US dominated higher-than-expected CPI which in turn drove a further bullish flattening of the USD swap curve with USD 2s10s now back to 21bp. The EUR curve also flattened amplified by ECB's hawkish hold which also aided EUR/USD back above 1.17. In the Scandies markets are now speculating whether Norges Bank could refrain from cutting rates next week which in turn has contributed to also sending EUR/NOK to a new multi-month low. A stronger NOK has also spilled over to SEK with EUR/SEK revisiting the low 10.90s.
UK GDP stalls in July, services offset weak production
UK GDP was flat in July, matching expectations, as modest growth in services and construction offset a sharp drop in production. Services output rose 0.1% and construction gained 0.2%, while production fell -0.9%, highlighting ongoing weakness in the industrial sector.
Over the three months to July, GDP rose 0.2% compared with the previous three-month period. Services expanded 0.4% and remained the key driver of growth, while production fell -1.3% and construction rose 0.6%.