
Sample Category Title
US initial jobless claims spike to 263k, highest since 2021
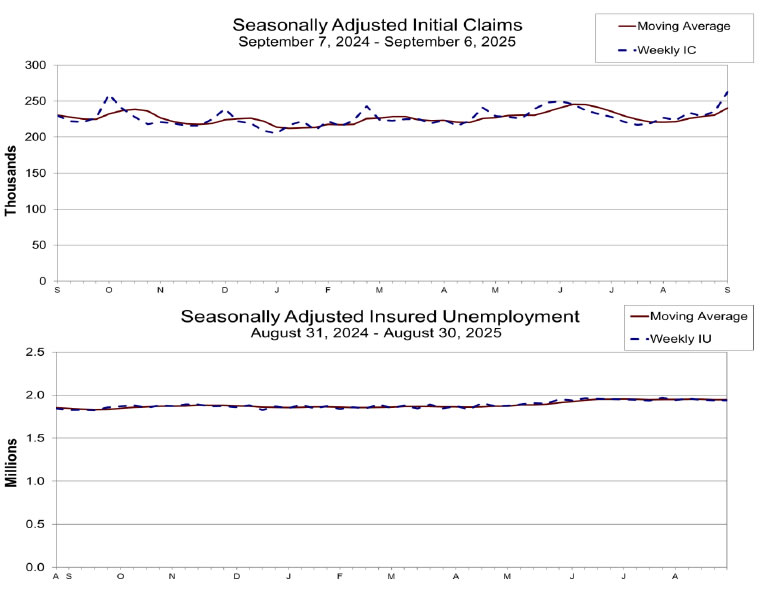
U.S. initial jobless claims surged by 27k to 263k in the week ending September 6, well above expectations of 240k and marking the highest level since October 2021. The four-week moving average rose 10k to 241k, pointing to a clear softening trend in labor market conditions.
Continuing claims were steady at 1.939 million for the week ending August 30, with the four-week average slipping slightly to 1.936 million. Still, the rise in new claims highlights a labor market that is starting to cool more decisively, adding pressure on the Fed as it weighs the pace of policy easing.
US CPI rises to 2.9% in August, core CPI unchanged at 3.1%
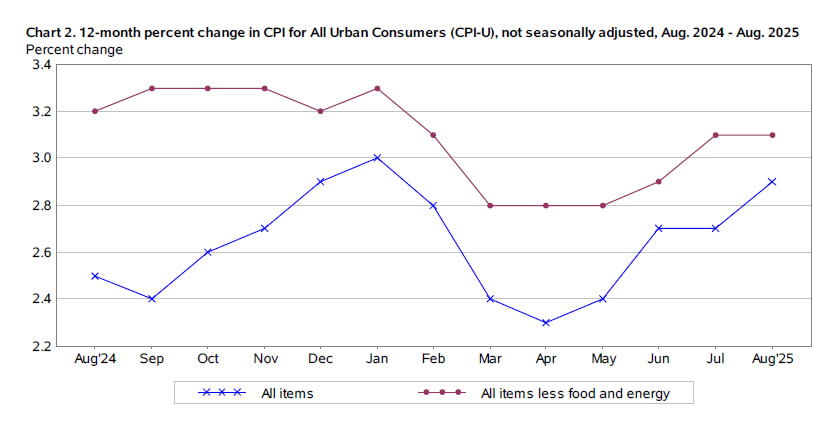
U.S. consumer prices rose more than expected on the month in August, with CPI up 0.4% mom versus forecasts of 0.3% mom. Core CPI rose 0.3% mom, matching expectations. Shelter costs climbed 0.4% mom and were the largest contributor to the monthly increase, while food prices rose 0.5% mom and energy gained 0.7% mom.
On a year-over-year basis, headline CPI accelerated to 2.9% from 2.7% in July, in line with forecasts. Core inflation held steady at 3.1%, also as expected. The data show underlying price pressures remain stable even as headline measures edge higher. Food inflation rose 3.2% over the past year, while energy prices were up a modest 0.2%. Overall, the report points to steady but not accelerating inflation.
ECB holds at 2.00% Again, upgrades 2025 growth outlook
The ECB left its deposit rate unchanged at 2.00% as widely expected, marking a second consecutive hold. The Governing Council reiterated its commitment to stabilizing inflation at 2% over the medium term and stressed a "data-dependent and meeting-by-meeting" approach. Policymakers emphasized they are "not pre-committing to a particular rate path", leaving flexibility to respond to incoming data.
Fresh staff projections showed little change from June, with headline inflation expected to average 2.1% (prior 2.0%) in 2025, 1.7% (1.6) in 2026, and 1.9% (2.0%) in 2027.
Core inflation, excluding food and energy, is projected at 2.4% in 2025 before easing to 1.9% in 2026 and 1.8% in 2027. The figures reinforce the view that price pressures are gradually converging toward target.
On growth, the ECB revised up its 2025 forecast to 1.2% from 0.9%, but cut its 2026 estimate slightly to 1.0% (prior 1.1%). The 2027 projection was left unchanged at 1.3%.
(ECB) Monetary policy decisions
11 September 2025
The Governing Council today decided to keep the three key ECB interest rates unchanged. Inflation is currently at around the 2% medium-term target and the Governing Council’s assessment of the inflation outlook is broadly unchanged.
The new ECB staff projections present a picture of inflation similar to that projected in June. They see headline inflation averaging 2.1% in 2025, 1.7% in 2026 and 1.9% in 2027. For inflation excluding energy and food, they expect an average of 2.4% in 2025, 1.9% in 2026 and 1.8% in 2027. The economy is projected to grow by 1.2% in 2025, revised up from the 0.9% expected in June. The growth projection for 2026 is now slightly lower, at 1.0%, while the projection for 2027 is unchanged at 1.3%.
The Governing Council is determined to ensure that inflation stabilises at its 2% target in the medium term. It will follow a data-dependent and meeting-by-meeting approach to determining the appropriate monetary policy stance. In particular, the Governing Council’s interest rate decisions will be based on its assessment of the inflation outlook and the risks surrounding it, in light of the incoming economic and financial data, as well as the dynamics of underlying inflation and the strength of monetary policy transmission. The Governing Council is not pre-committing to a particular rate path.
Key ECB interest rates
The interest rates on the deposit facility, the main refinancing operations and the marginal lending facility will remain unchanged at 2.00%, 2.15% and 2.40% respectively.
Asset purchase programme (APP) and pandemic emergency purchase programme (PEPP)
The APP and PEPP portfolios are declining at a measured and predictable pace, as the Eurosystem no longer reinvests the principal payments from maturing securities.
***
The Governing Council stands ready to adjust all of its instruments within its mandate to ensure that inflation stabilises at its 2% target in the medium term and to preserve the smooth functioning of monetary policy transmission. Moreover, the Transmission Protection Instrument is available to counter unwarranted, disorderly market dynamics that pose a serious threat to the transmission of monetary policy across all euro area countries, thus allowing the Governing Council to more effectively deliver on its price stability mandate.
The President of the ECB will comment on the considerations underlying these decisions at a press conference starting at 14:45 CET today.
Euro in Holding Pattern Ahead of ECB Decision, US CPI Next
The euro is virtually unchanged on Thursday, trading at 1.1692 in the European session.
ECB expected to maintain rates
The European Central Bank meets later on Thursday and the money markets have priced in a hold at close to 100%, which would keep the key deposit rate at 2.0%. The ECB has cut rates by more than half since last July but has hinted that there is no rush to continue lowering rates.
Has inflation in the eurozone become too much of a good thing? Inflation is under control, but there is now a risk of inflation undershooting the 2% target, which would put pressure on the ECB to respond by reducing rates.
There are differing opinions within the ECB with regard to the impact of the US tariffs. The hawks,, who are against more rate cuts argue that the economy has weathered the tariffs well. The doves, who favor more cuts, are concerned that the tariffs are yet to be fully felt and could dampen growth. The money markets are in agreement with the hawks and don't anticipate another rate cut this year.
All eyes on US CPI
The US releases the August inflation report later on Thursday. CPI is expected to rise to 2.7% y/y from 2.9% y/y in July. Monthly, the market estimate is 0.3%, compared to 0.2% in July. Core CPI is expected to remain unchanged at 3.1% y/y and 0.3% m/m.
The core rate is well above the Federal Reserve's 2% target but that isn't expected to stop the Fed from lowering rates next week for the first time since December 2024. Although a rate cut has been fully priced in, we could see downward pressure on the US dollar if the Fed cuts, especially if the Fed's tone at the meeting is dovish.
The US economy is showing signs of cooling, especially the labor market. The August nonfarm payrolls fell to 22 thousand and annual revisions for the year prior to March 2025 were revised downwards by a massive 911 thousand, much more than expected. The weak nonfarm payrolls report has raised the odds of a half-point cut to 10%, with a 90% chance of a quarter-point reduction.
EUR/USD Technical
- EURUSD tested resistance at 1.1703 earlier. Above, there is resistance at 1.1722.
- 1.1674 and 1.1655 are providing support
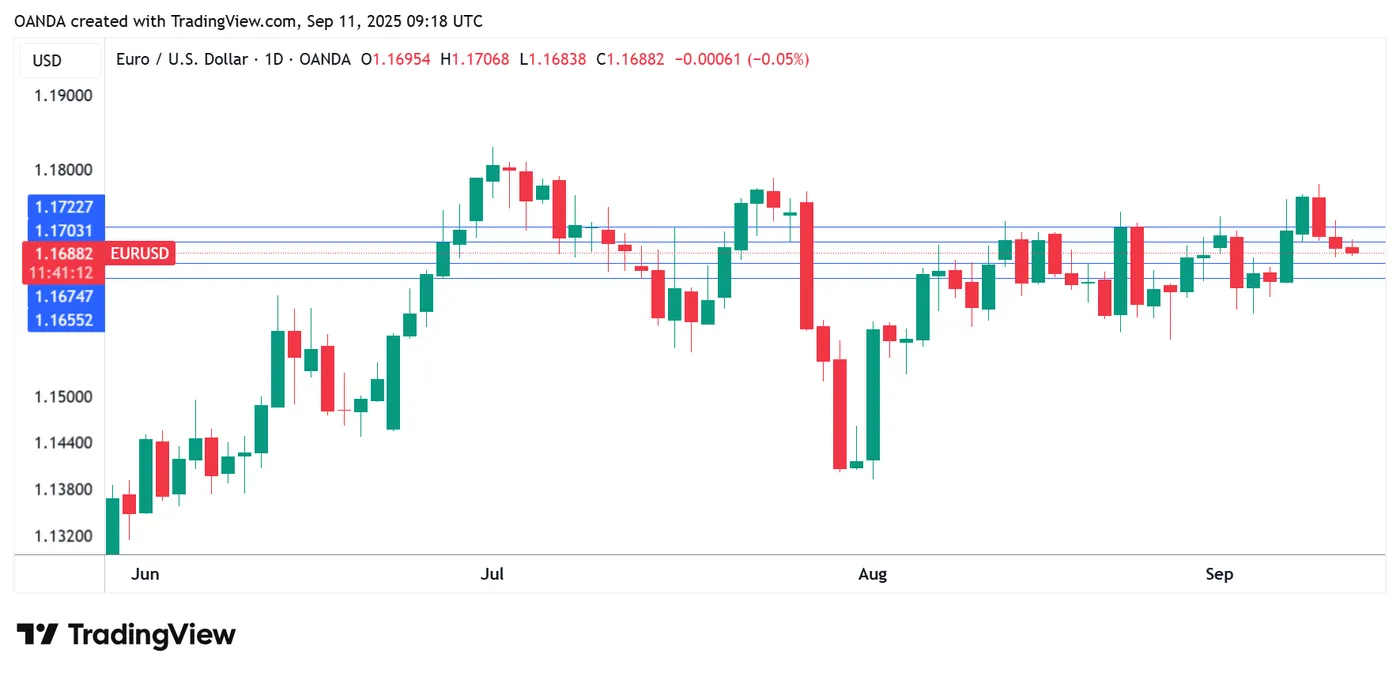
EURUSD 1-Day Chart, September 11, 2025
Crypto Market Has Returned to $4 Trillion Mark
Market Overview
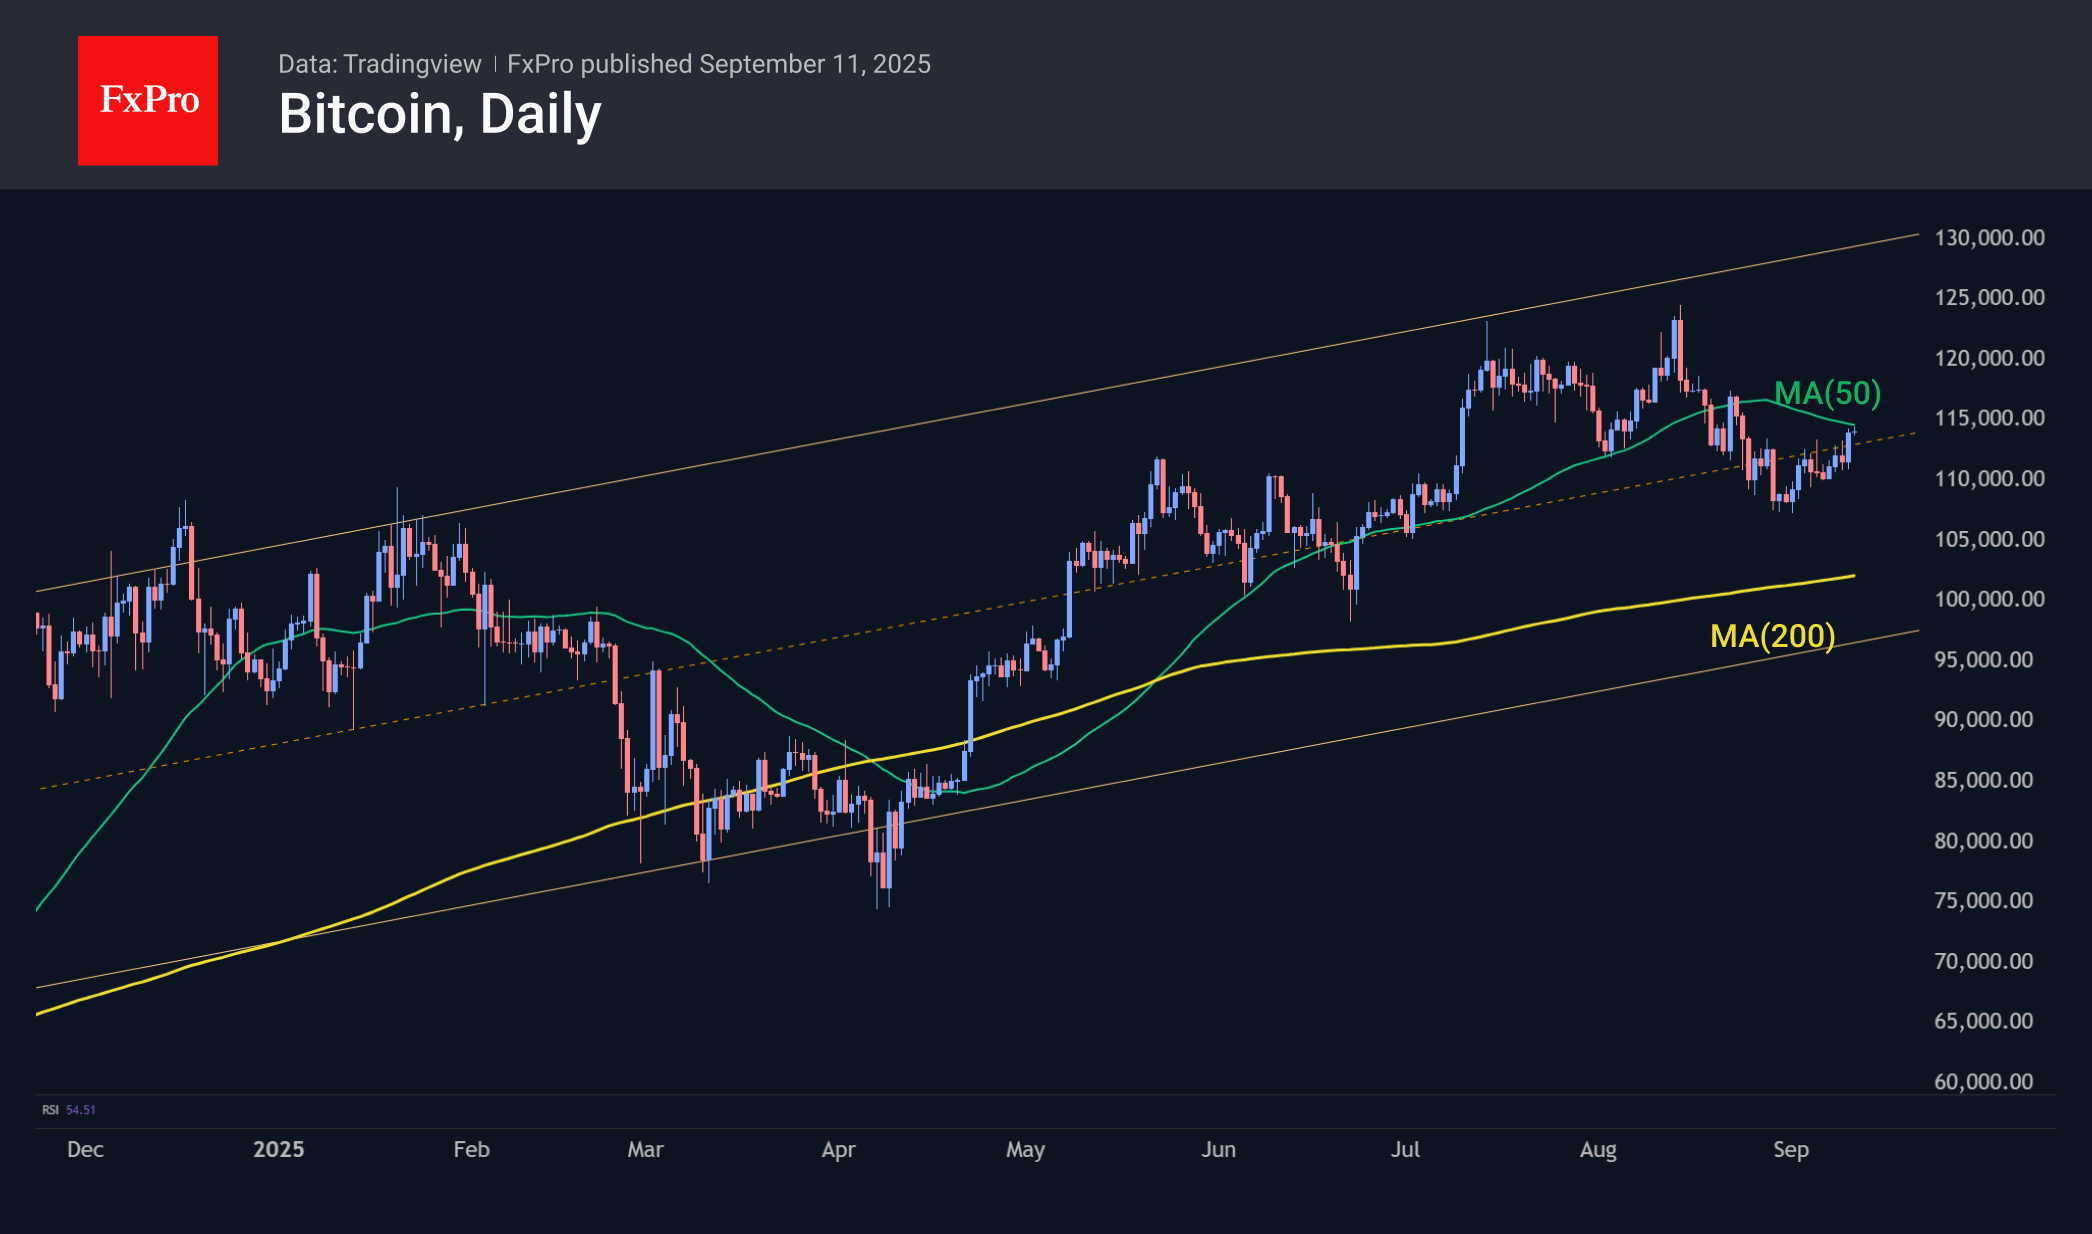
Once again, the crypto market capitalisation has approached $4 trillion, rising by more than 2% over the past 24 hours. The whole market is managing to gain above the 50-day moving average, which the first cryptocurrency is unable to do. There are no super rallies or confetti like before, but these are still signs of an altcoin season with heavy altcoins leading the way.
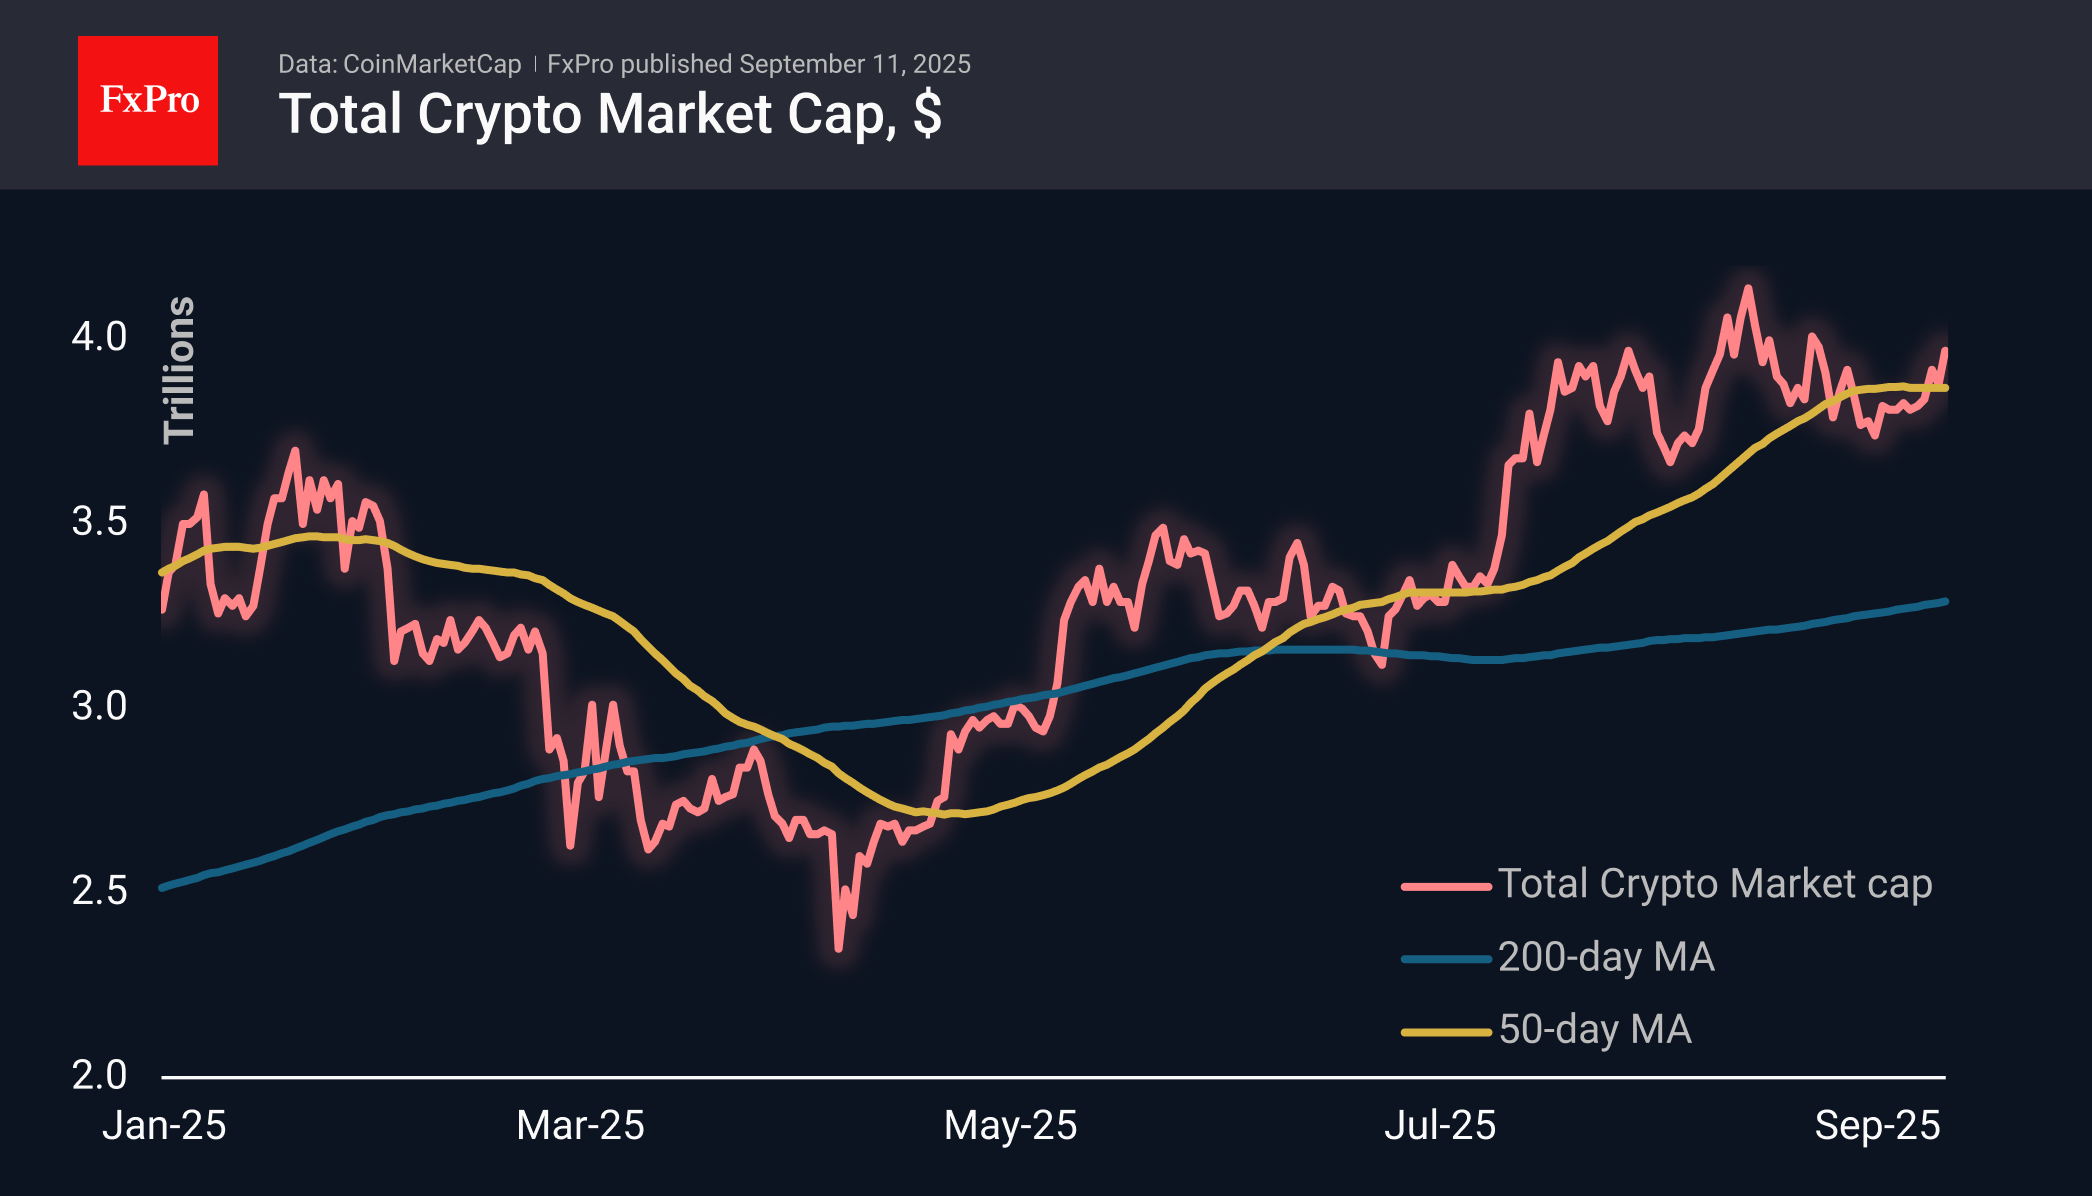
Bitcoin exceeded $114K on Wednesday for the first time in 2.5 weeks after the release of weak US producer price data. On Thursday, US consumer inflation data will be released, which could also influence interest rate decisions in the coming months, thereby affecting the markets. The BTC price has approached the 50-day moving average, and the upcoming data could provide momentum for both a breakout of this resistance and an end to the recent uptrend.
News Background
According to Santiment, traders have turned negative, expecting Bitcoin to fall to $100K, Ethereum to $3,500 and altcoins to pull back. As markets move contrary to crowd expectations, this pullback may not happen.
Japan’s Metaplanet will allocate $1.45 billion to buy Bitcoin this year. The company has completed its share offering, increasing the volume from 185 million to 385 million shares.
According to Bitwise, banks need to raise deposit rates to compete with increasingly popular stablecoins.
The Kyrgyz Parliament has approved a bill on ‘Virtual Assets,’ which provides for the creation of a state cryptocurrency reserve.
The Vietnamese authorities have approved the launch of a legalised cryptocurrency market in the country on a trial basis for the next five years.
Cardano founder Charles Hoskinson said the Ethereum ecosystem is doomed to collapse in the next 10-15 years due to a large number of fundamental flaws. Among the shortcomings of ETH are an inefficient virtual machine, an incorrect accounting model, and a flawed consensus system.
Bitcoin Price Rises to Its Highest Level Since 24 August
On 1 September, in the article Bitcoin Price Chart Analysis: Are the Bulls Lifting Their Heads?, we:
→ drew a long-term upward (blue) and short-term downward (red) channel;
→ highlighted a series of bullish signals and suggested that the price could climb towards the median of the red channel.
Indeed, since then Bitcoin’s price has not only reached the median of the red channel but has also moved into its upper half. Since the start of the month, the leading cryptocurrency has gained more than 5%.
Why Is Bitcoin Rising?
The main factors include:
→ Expectations of US Federal Reserve rate cuts, which create favourable conditions for risk assets.
→ News of a strategic partnership between Nasdaq and crypto exchange Gemini.
→ Inflows of corporate investment. For example, Metaplanet announced plans for large-scale Bitcoin purchases.
→ Reduced regulatory uncertainty has also played an important role, with SEC leadership statements in support of innovation being welcomed by the market.
Technical Analysis of the BTC/USD Chart
The chart suggests that Bitcoin’s price is still in a corrective phase (marked by the red channel) within the broader uptrend. In other words, we may be “inside” a bull flag pattern, with the potential for renewed growth within the blue channel in the coming weeks.
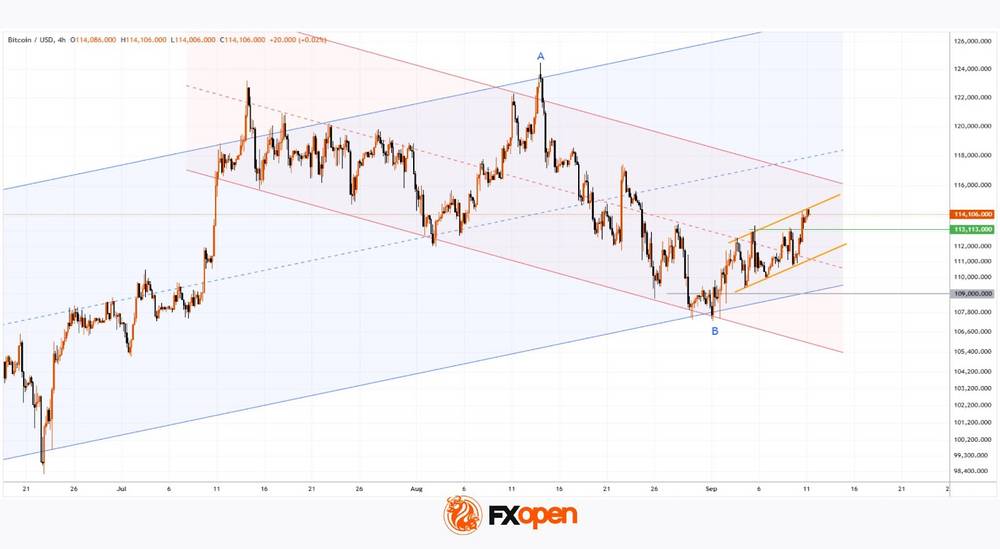
From a bullish perspective:
→ demand is showing strength, as the price has reached its highest level since 24 August;
→ higher highs and higher lows form a steady upward trajectory, marked by orange lines, with the lower one potentially continuing to act as support in the coming days;
→ the red median, once broken, may now serve as support, along with the former local resistance at $113,113.
From a bearish perspective, Bitcoin’s price has approached key resistance levels:
→ the upper boundary of the red channel;
→ the psychological mark of $115,000;
→ the 50% retracement level of the A→B impulse, around $116k.
Taking the above into account, we could assume that the bulls still hold the upper hand, though their momentum may be weakening. We might see BTC/USD consolidating near the $115k level, with a decisive shift in sentiment potentially occurring next week, when several central banks are set to announce interest rate decisions.
FXOpen offers the world's most popular cryptocurrency CFDs*, including Bitcoin and Ethereum. Floating spreads, 1:2 leverage — at your service. Open your trading account now or learn more about crypto CFD trading with FXOpen.
*Important: At FXOpen UK, Cryptocurrency trading via CFDs is only available to our Professional clients. They are not available for trading by Retail clients. To find out more information about how this may affect you, please get in touch with our team.
This article represents the opinion of the Companies operating under the FXOpen brand only. It is not to be construed as an offer, solicitation, or recommendation with respect to products and services provided by the Companies operating under the FXOpen brand, nor is it to be considered financial advice.
Dollar Consolidates Ahead of Inflation Data
The US dollar is showing cautious dynamics: the USD/JPY pair is holding within a range, reflecting the market’s wait-and-see stance, while USD/CAD is gradually approaching August highs. This divergence highlights that investors are carefully allocating positions amid uncertainty over the Federal Reserve’s next steps.
The main focus is on a block of US statistics — consumer price indices, jobless claims, and inflation expectations from the University of Michigan. Weak inflation and labour market figures would increase pressure on the dollar, while stronger data could temporarily restore support.
Thus, the market remains in search of fresh momentum: whether levels are broken or consolidation persists will depend on whether macro data confirm the scenario of policy easing or, conversely, postpone its implementation.
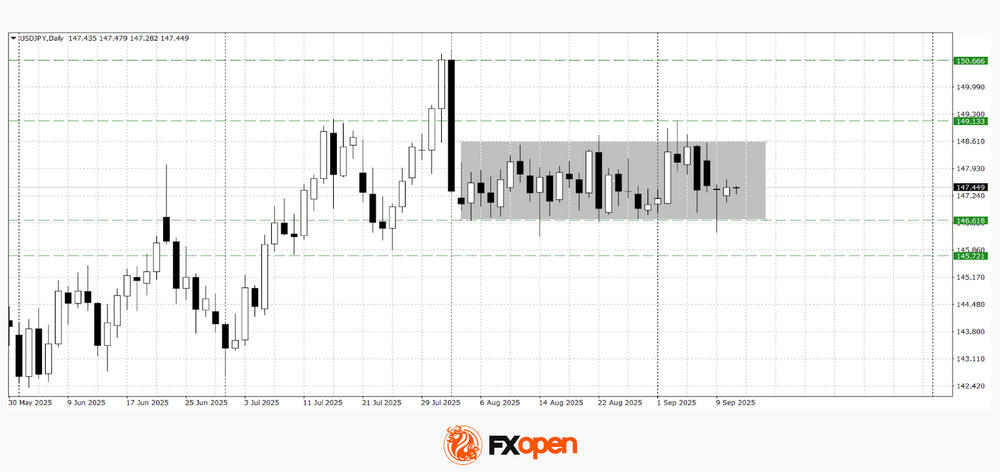
USD/JPY
Despite disappointing US employment data released at the end of last week, USD/JPY continues to trade within a six-week range of 146.40–148.60. Early this week, sellers attempted to break through the lower boundary of the corridor but have so far been unsuccessful. Technical analysis of USD/JPY suggests a possible strengthening towards 148.00–148.60, as a hammer candlestick has formed following the rebound. A bounce from current levels could also lead to a retest of support at 146.30–146.60.
Events that could influence the direction of USD/JPY:
- Today at 15:30 (GMT+3): US Consumer Price Index (CPI)
- Today at 15:30 (GMT+3): US Initial Jobless Claims
- Today at 21:00 (GMT+3): US Federal Budget Statement
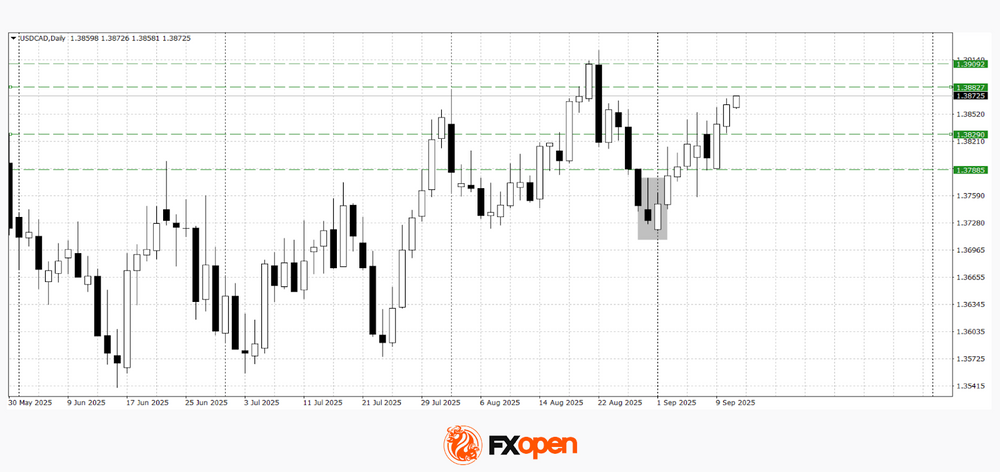
USD/CAD
As expected, following the formation of a bullish engulfing pattern, USD/CAD managed to test the key 1.3800–1.3860 range. Should the dollar receive a positive news driver, the pair might strengthen towards 1.3880–1.3900. The nearest support could be within the 1.3790–1.3830 area.
Events that could influence the direction of USD/CAD:
- Today at 15:30 (GMT+3): Canadian Building Permits
- Today at 17:00 (GMT+3): University of Michigan Consumer Sentiment Index
- Today at 19:00 (GMT+3): US Department of Agriculture (USDA) Report
Trade over 50 forex markets 24 hours a day with FXOpen. Take advantage of low commissions, deep liquidity, and spreads from 0.0 pips. Open your FXOpen account now or learn more about trading forex with FXOpen.
This article represents the opinion of the Companies operating under the FXOpen brand only. It is not to be construed as an offer, solicitation, or recommendation with respect to products and services provided by the Companies operating under the FXOpen brand, nor is it to be considered financial advice.
GBP/USD Treads Water Ahead of Key Central Bank Decisions
The GBP/USD pair traded in a tight range around 1.3524 USD on Thursday, with movement constrained as markets await key US inflation data and pivotal policy meetings from both the Federal Reserve and the Bank of England next week.
The pound has managed to recover from a sell-off earlier in September, when concerns over UK fiscal sustainability pushed the currency to monthly lows and propelled long-term government bond yields to levels last seen in the late 1990s.
Sterling is supported by investor expectations that the Bank of England will refrain from aggressive rate cuts, especially as other major central banks, including the Fed, move towards easing. Another supportive factor is the UK’s elevated inflation, which remains the highest among G7 nations, with particularly persistent price growth in services and wages.
Recent data indicate the economy is proving resilient despite lingering inflationary pressures and a softening labour market. In this context, Chancellor Rachel Reeves faces mounting pressure to maintain fiscal stability without breaching the government’s borrowing rules. The upcoming budget statement in November will be closely watched.
Technical Analysis: GBP/USD
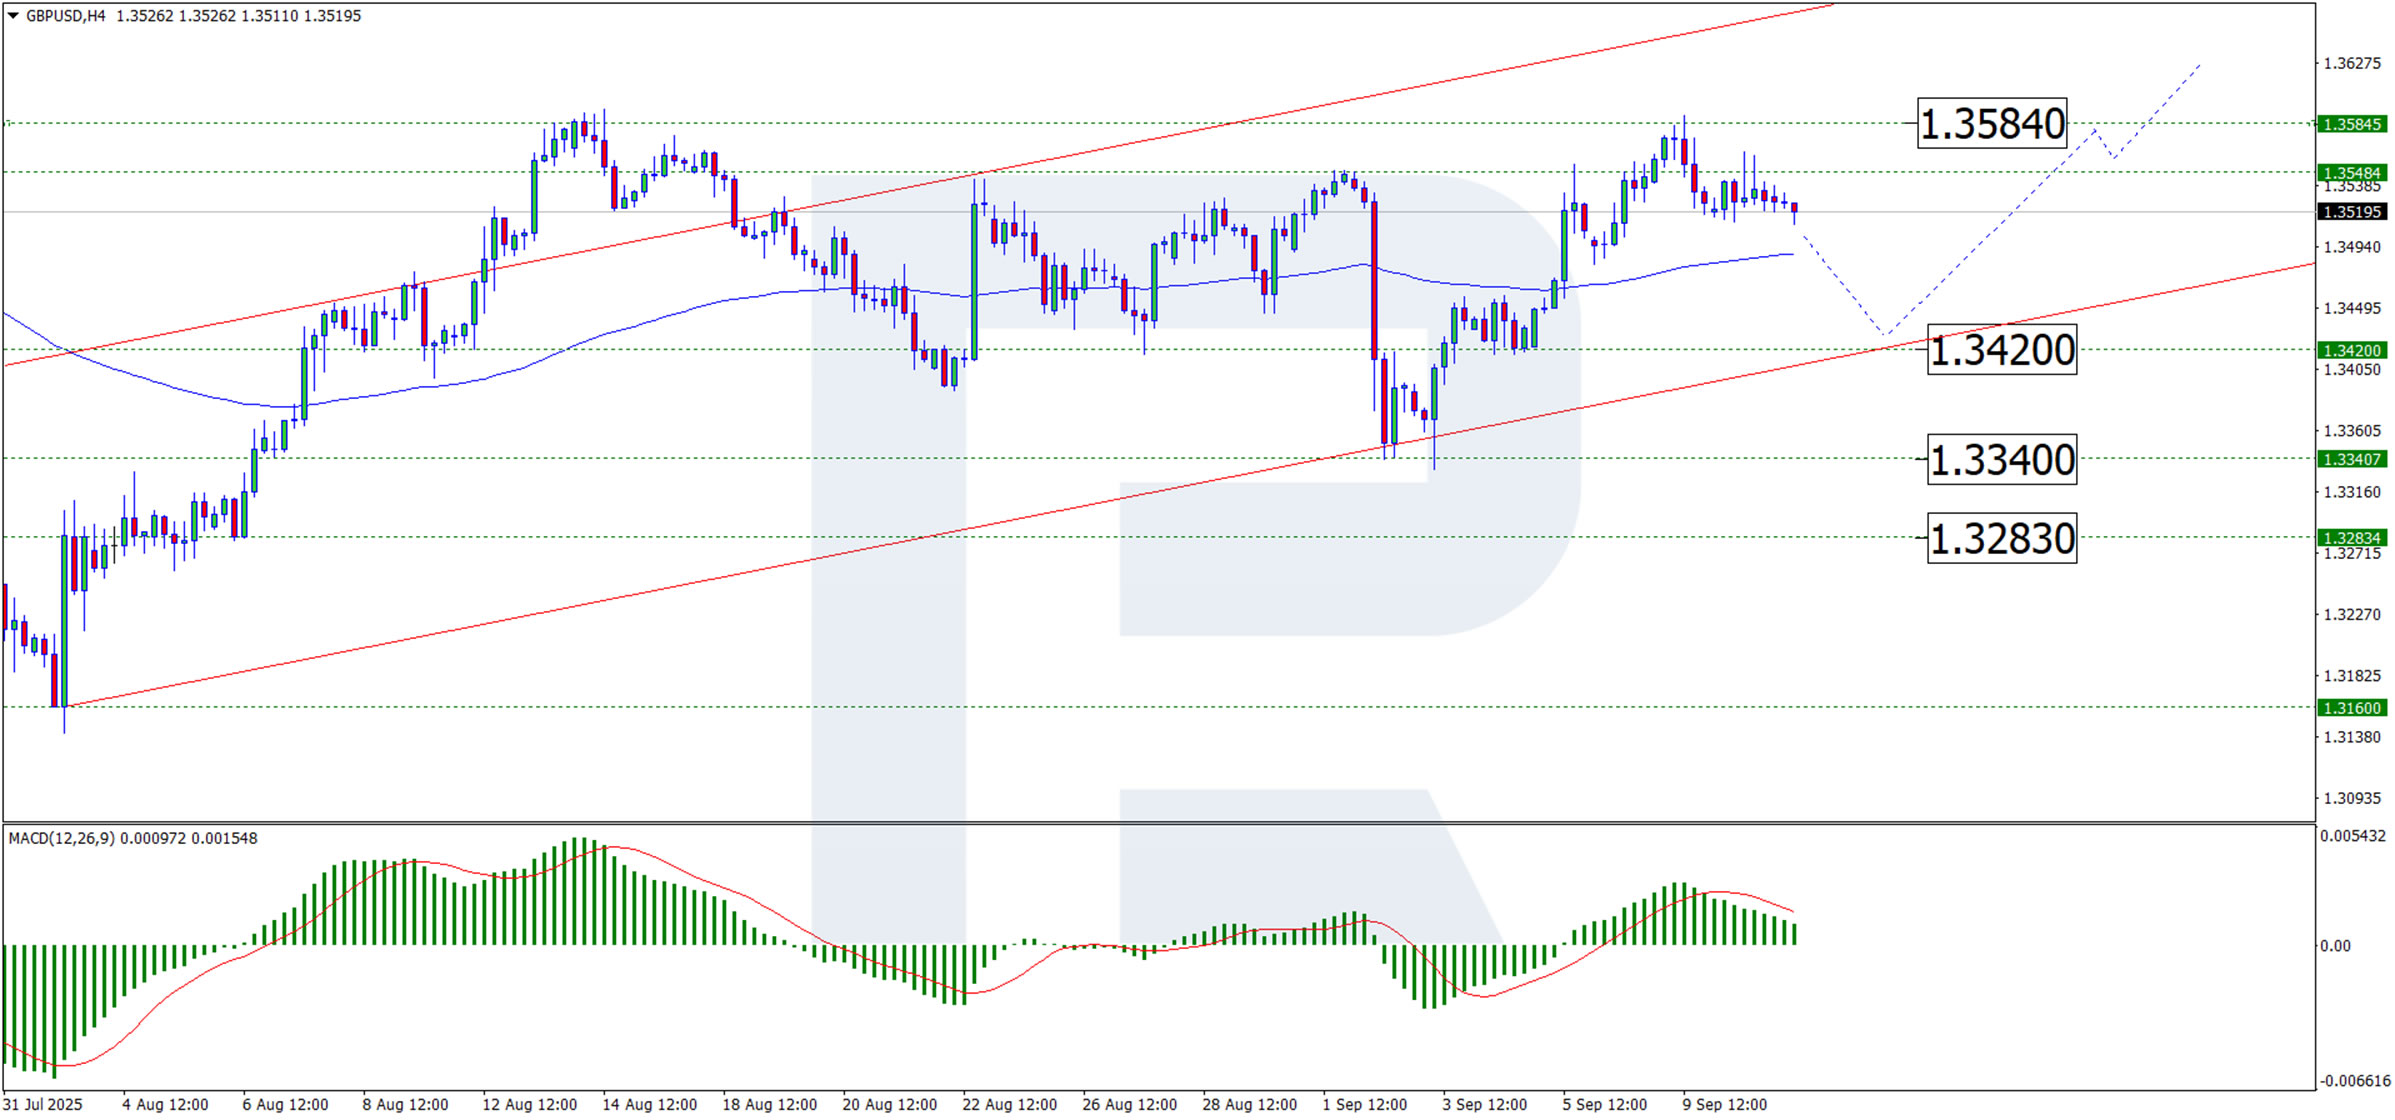
H4 Chart:
On the H4 chart, GBP/USD is continuing a corrective decline from the recent high near 1.3584 USD. The pair may extend this move towards support around 1.3420 USD. Once the correction is complete, a rebound from this level could initiate a new upward move, with initial resistance at 1.3548 USD, followed by a retest of 1.3584 USD. The MACD indicator supports this view: although the histogram and signal line remain above zero, both are declining, suggesting near-term downward momentum within a broader consolidation.
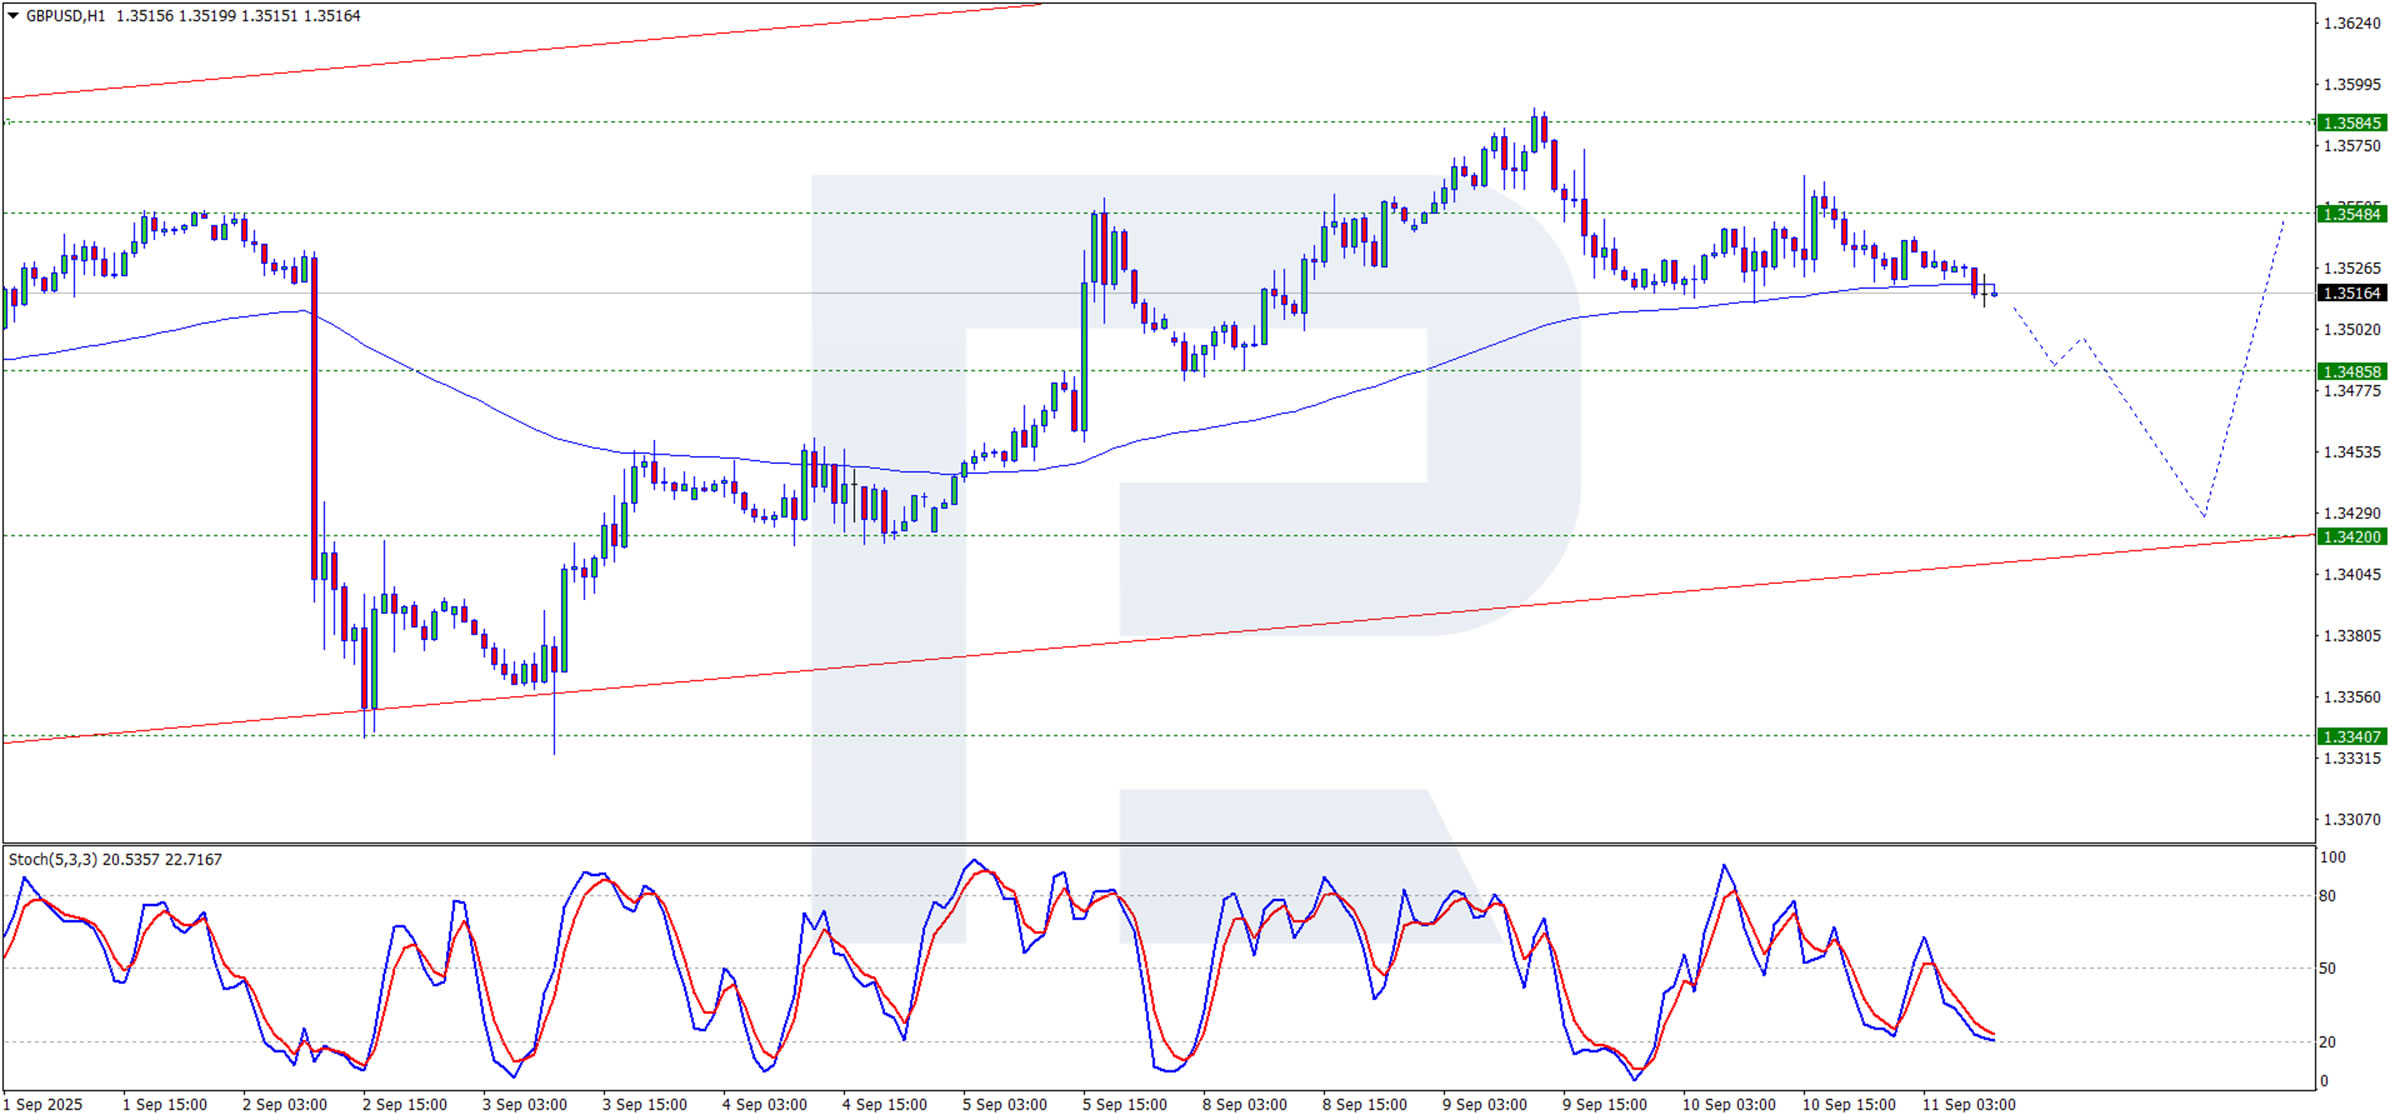
H1 Chart:
On the H1 chart, the pair has tested 1.3517 USD and continues its corrective phase. The immediate downside target is support at 1.3485 USD. A break below this level could extend the correction towards deeper supports. The Stochastic oscillator reinforces this near-term bearish bias, with its signal line hovering near 20.0, indicating oversold conditions, while continuing to trend lower.
Conclusion
GBP/USD is trading cautiously as markets brace for next week’s central bank decisions. While the pound remains supported by relatively hawkish BoE expectations and high inflation, its near-term direction will likely be determined by the Fed’s tone and upcoming UK fiscal developments. Technically, the pair is undergoing a short-term correction, which may present buying opportunities if key support levels hold.
USD/JPY Technical: Mild JPY Strength Detected Ahead of US CPI
The recent movement of the USD/JPY has been very choppy as it continues to trade within a four-month-plus “Ascending Wedge” range configuration since its 22 April 2025 low of 139.89.
The initial 0.8% intraday rally of the US dollar against the Japanese yen at the start of this week’s Asia session on Monday, 8 September 2025, to hit an intraday high of 148,58 has evaporated as the USD/JPY is now trading almost unchanged week-to-date as of Thursday, 11 September, at 147.40.
Market participants have largely looked beyond the political uncertainty stemming from Prime Minister Ishiba’s resignation, shifting their focus to factors that could shape the Bank of Japan’s ongoing monetary policy normalization path.
Let’s examine these fundamental factors.
Japan’s PPI is still evolving in an upward trend, a leading indicator of core-core CPI
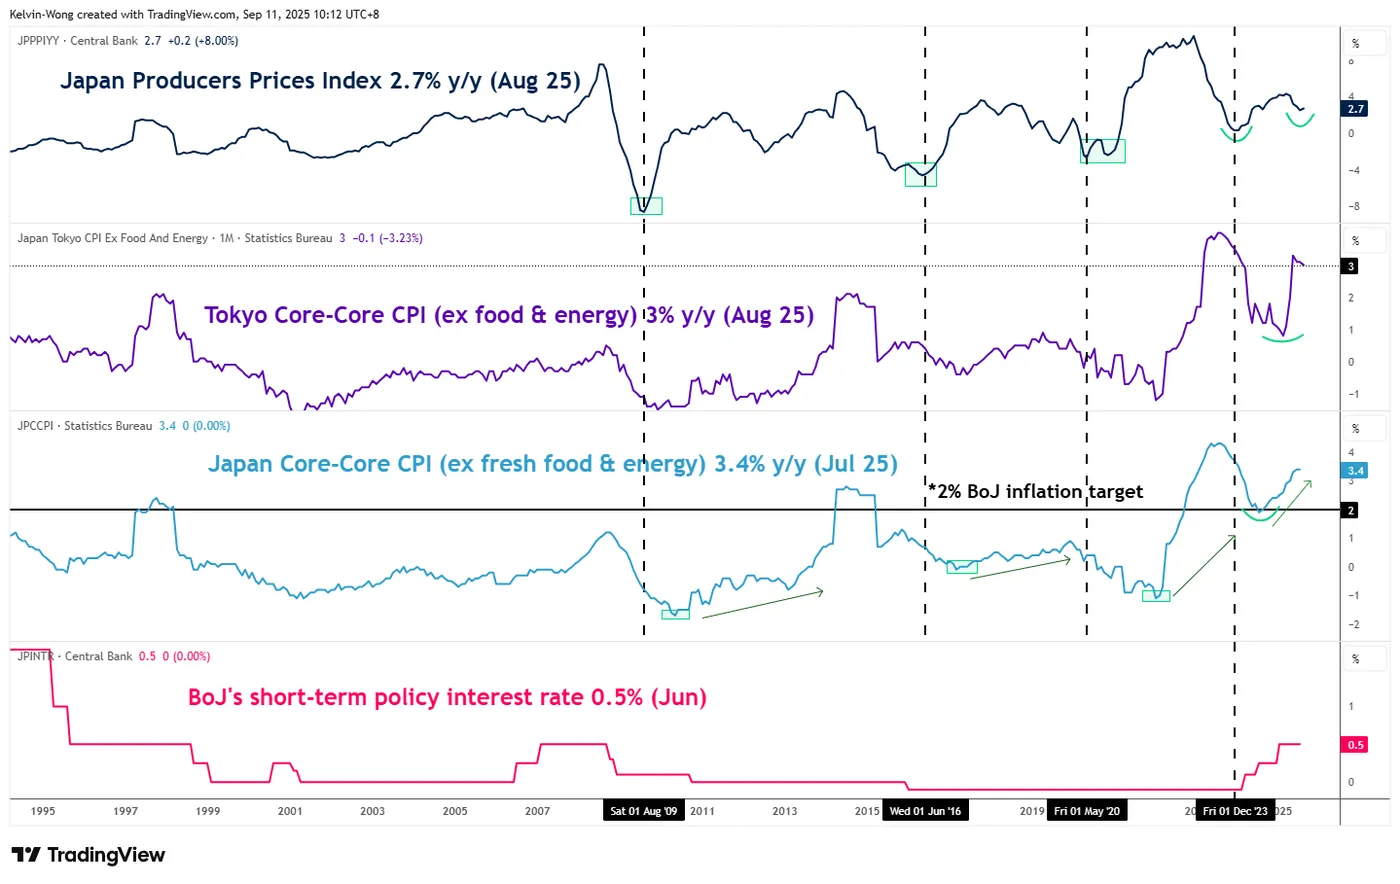
Fig. 1: Japan PPI & core-core CPI as of Aug 2025 (Source: TradingView)
One of the key economic indicators that the BoJ monitors to formulate its monetary policy decision is Japan’s nationwide core-core CPI inflation trend (excluding fresh and energy).
Interestingly, the trend of Japan’s producers’ price index (PPI), a gauge that measures companies’ input costs, has a lead time ahead of the core-core CPI.
Based on past data, Japan’s PPI bottomed out and reversed upwards ahead of Japan’s core-core CPI inflation in August 2009, June 2016, May 2020, and most recently December 2023.
The latest print of Japan’s PPI has started to firm up after a slowdown in growth of 4.3% y/y in March 2025. The PPI rose 2.7% y/y in August 2025, accelerating from 2.5% y/y in the previous month of July (see Fig. 1).
Hence, a continuation of an upward growth trend in Japan’s PPI is likely to have a trickle-down effect on the core CPI inflation trend to allow it to trend higher above the BoJ’s long-term inflation target of 2%, in support of a continuation of the BoJ’s gradual interest rate hikes in place since March 2024.
Overall, a supporting fundamental element that can assert upside pressure on the Japanese yen.
Narrowing of the longer-term yield spread between US Treasury bonds and JGBs
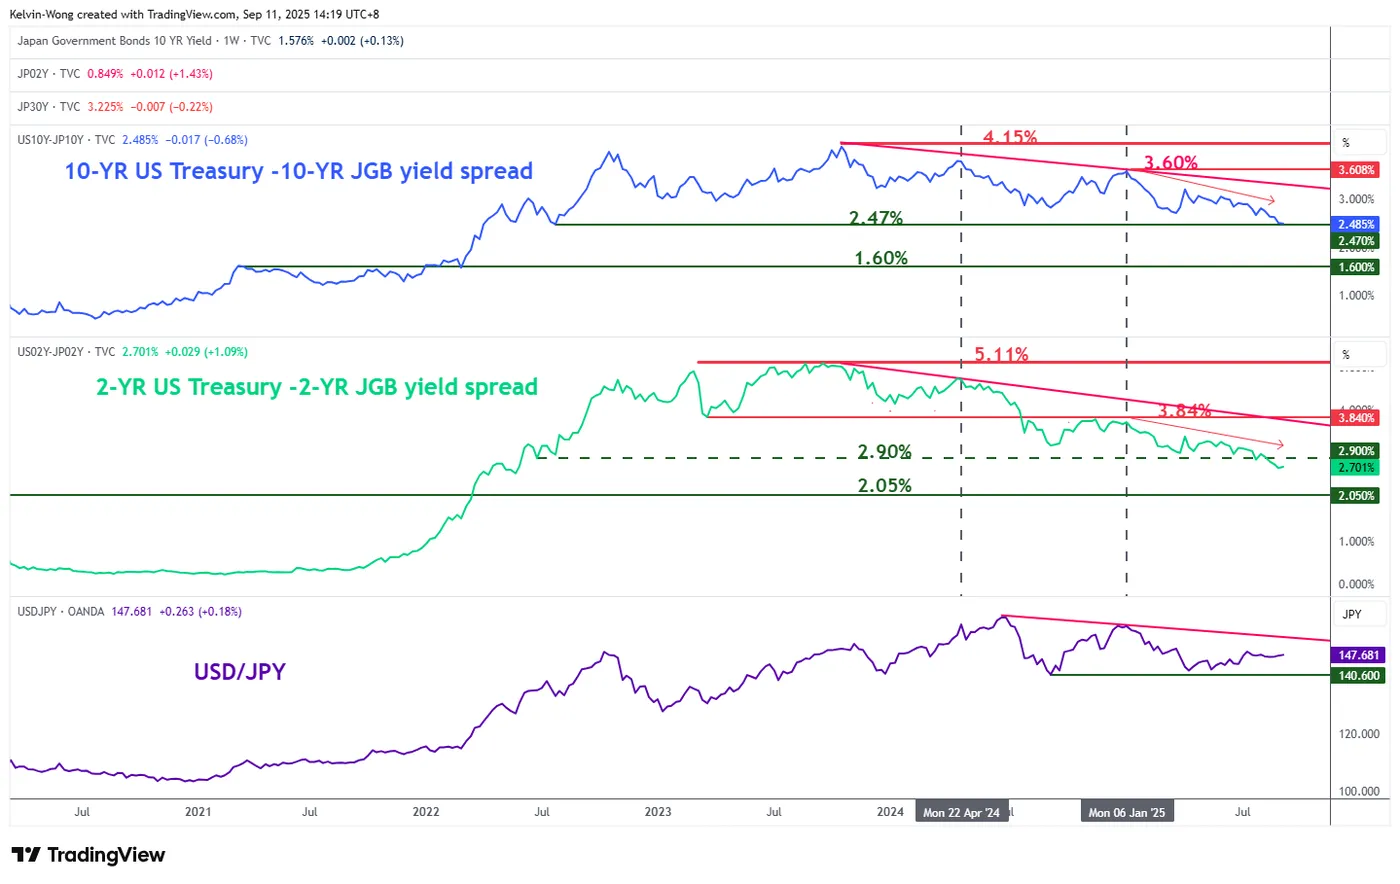
Fig. 2: 10-year and 2-year yield spreads of US Treasuries and JGBs as of 11 Sep 2025 (Source: TradingView)
The 10-year sovereign bond yield of a country often serves as a key gauge of its long-term inflation outlook and economic growth prospects.
A relative comparison of these expectations between two countries can be captured through the 10-year yield spread of their sovereign bonds.
For instance, the yield spread between the 10-year US Treasury and the Japanese Government Bond (JGB) has been narrowing since October 2025, falling from 4.15% to the current level of 2.48%, just above a critical support at 2.47% (see Fig. 2).
This narrowing suggests that US Treasuries have become relatively less attractive versus JGBs, reducing the yield premium in favour of the dollar. As a result, this dynamic may exert downside pressure on USD/JPY.
Let’s now examine the USD/JPY from a technical analysis perspective to determine its short-term (1 to 3 days) trend bias and key levels to watch.
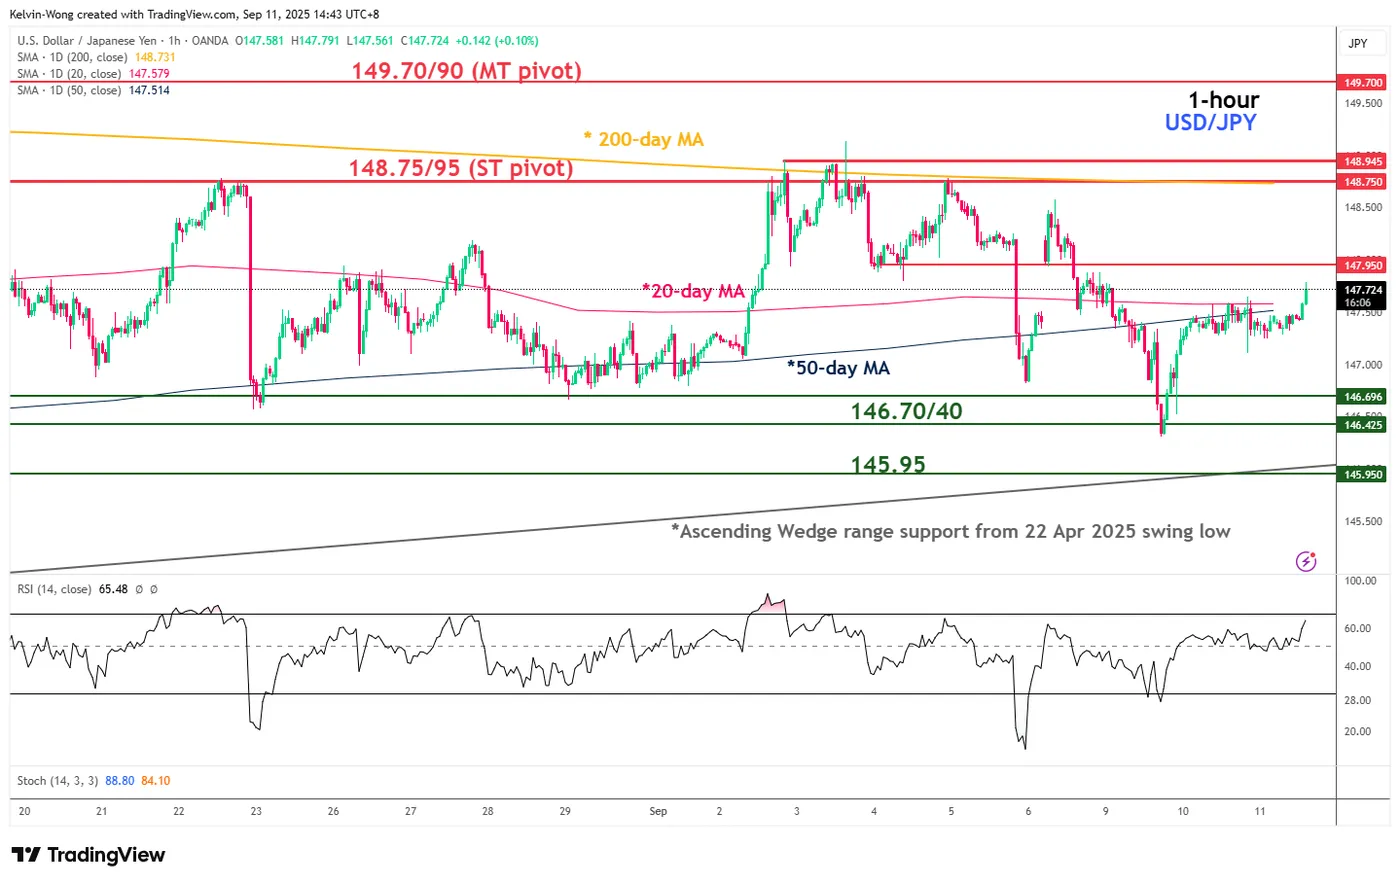
Fig. 3: USD/JPY minor trend as of 11 Sep 2025 (Source: TradingView)
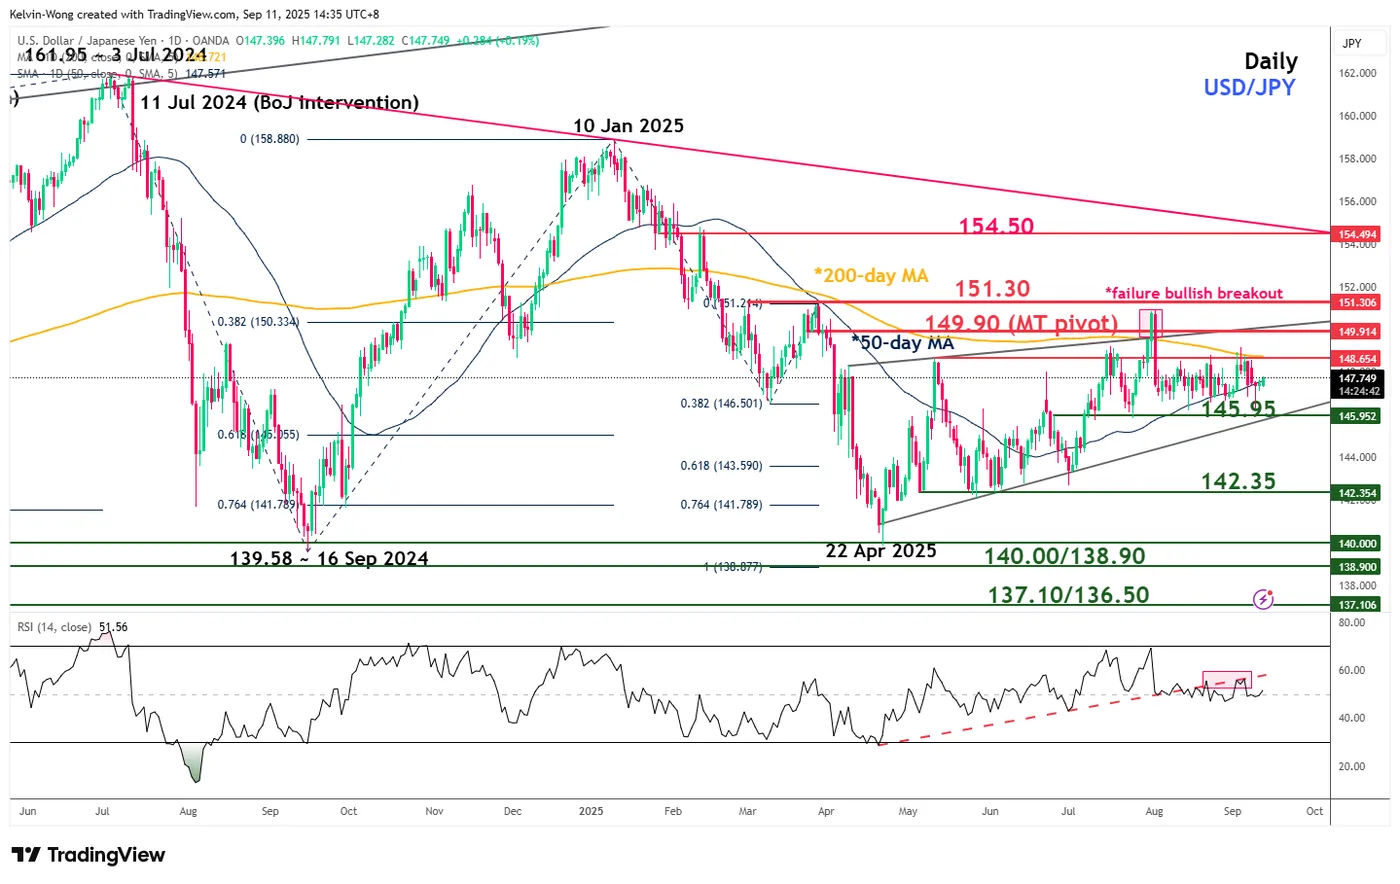
Fig. 4: USD/JPY medium-term trend as of 11 Sep 2025 (Source: TradingView)
Preferred trend bias (1-3 days)
Potential push down towards minor range support of 146.70/146.40 in place since 5 August 2025, with key short-term pivotal resistance at 148.75/148.95 (see Fig. 3).
A break below 146.40 may trigger a further drop to test the medium-term “Ascending Wedge” range support of 145.95.
Key elements
- The USD/JPY is stuck inside a medium-term “Ascending Wedge” range configuration in place since the 22 April 2025 low. The upper boundary/resistance of the range stands at 149.90, and the lower boundary/support of the range rests at 145.95 (see Fig. 4).
- The hourly RSI momentum has ticked up higher to 66, which is coming close to its overbought region (above 70), which suggests a potential imminent mean reversion downside movement for the USD/JPY within its range configuration.
- The USD/JPY is still trading below its key 200-day moving average, which is acting as a resistance at 148.75.
Alternative trend bias (1 to 3 days)
A clearance above 148.95 invalidates the bearish scenario for the USD/JPY and sees a squeeze up towards the key medium-term resistance of 149.70/149.90 (the upper boundary of the “Ascending Wedge”).