Sample Category Title
GBP/JPY Daily Outlook
Daily Pivots: (S1) 199.09; (P) 199.45; (R1) 199.89; More...
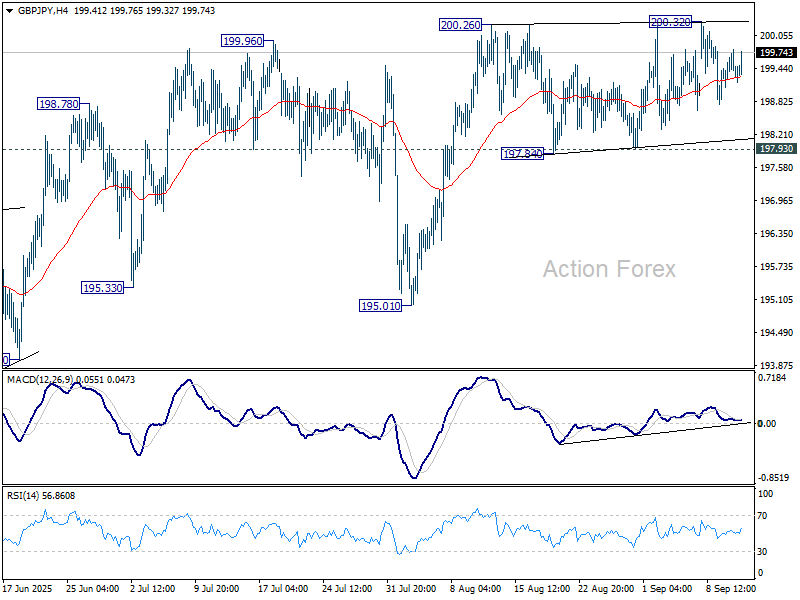
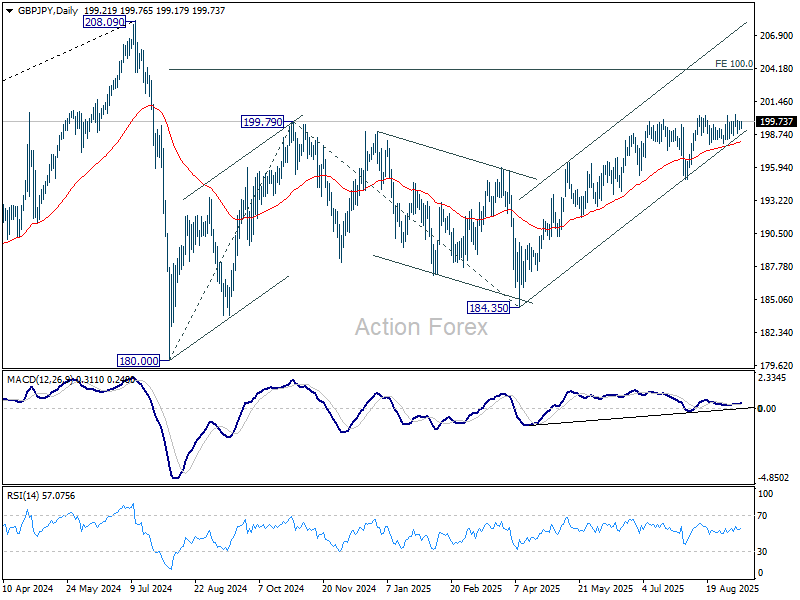
Intraday bias in GBP/JPY stays neutral at this point and more consolidations could be seen. Further rise is expected as long as 197.93 support holds. Firm break of 200.26 resistance will resume the rally from 184.35 to 100% projection of 180.00 to 199.79 from 184.35 at 204.14. On the downside, however, break of 197.93 support will turn bias to the downside for 195.01 support next.
In the bigger picture, price actions from 208.09 (2024 high) are seen as a correction to rally from 123.94 (2020 low). The pattern might still extend with another falling leg. But in that case, strong support should be seen from 38.2% retracement of 123.94 to 208.09 at 175.94 to contain downside. Meanwhile, decisive break of 208.09 will confirm long term up trend resumption.
EUR/JPY Daily Outlook
Daily Pivots: (S1) 172.19; (P) 172.56; (R1) 172.83; More...
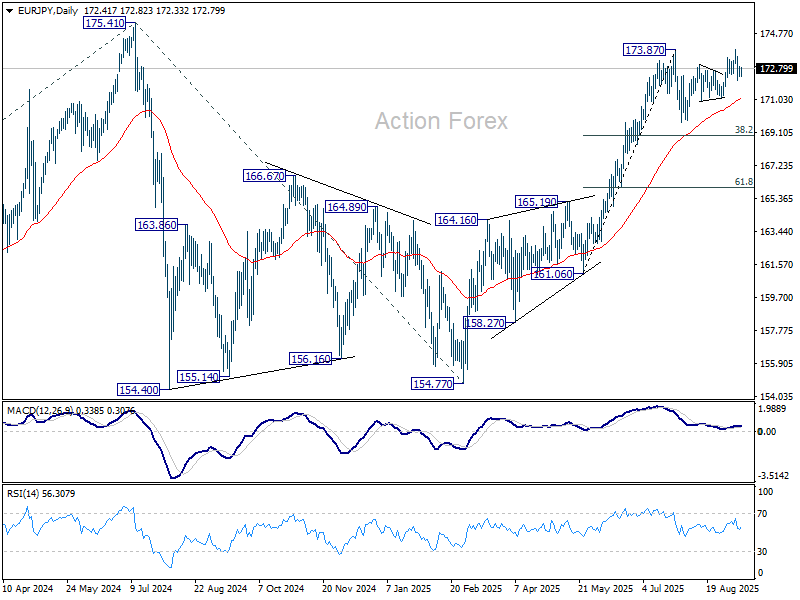
EUR/JPY's fall from 173.88 is currently seen as the third leg of the corrective pattern from 173.87. Intraday bias is mildly on the downside for 171.09 support. Break there will target 169.69. Nevertheless, decisive break of 173.87/8 will resume larger rise from 154.77 to retest 175.41 high.
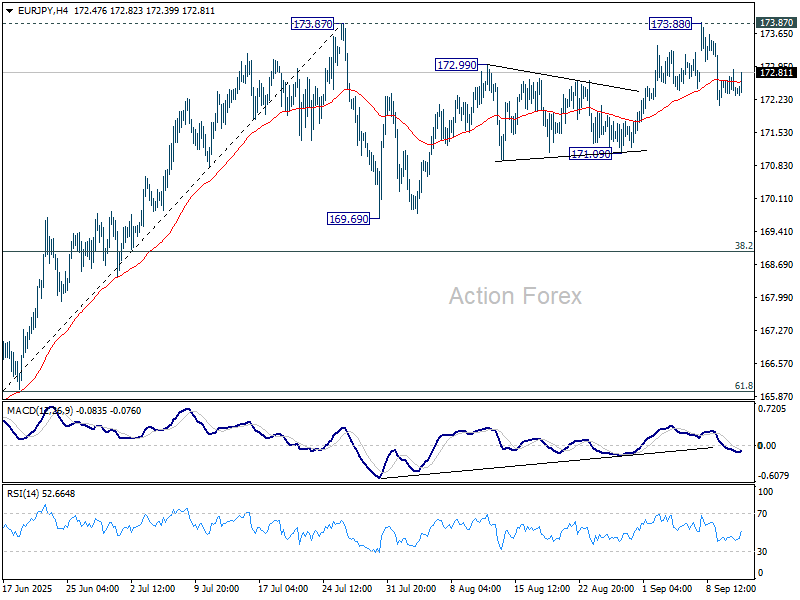
In the bigger picture, current rally from 154.77 is still tentatively seen as resuming the larger up trend. Firm break of 175.41 (2024 high) will confirm and target 61.8% projection of 124.37 to 175.41 from 154.77 at 186.31. However, sustained break of 38.2% retracement of 161.06 to 173.87 at 168.97 will delay this bullish case, and probably extend the correction from 175.41 with another fall.
EUR/GBP Daily Outlook
Daily Pivots: (S1) 0.8635; (P) 0.8648; (R1) 0.8657; More...
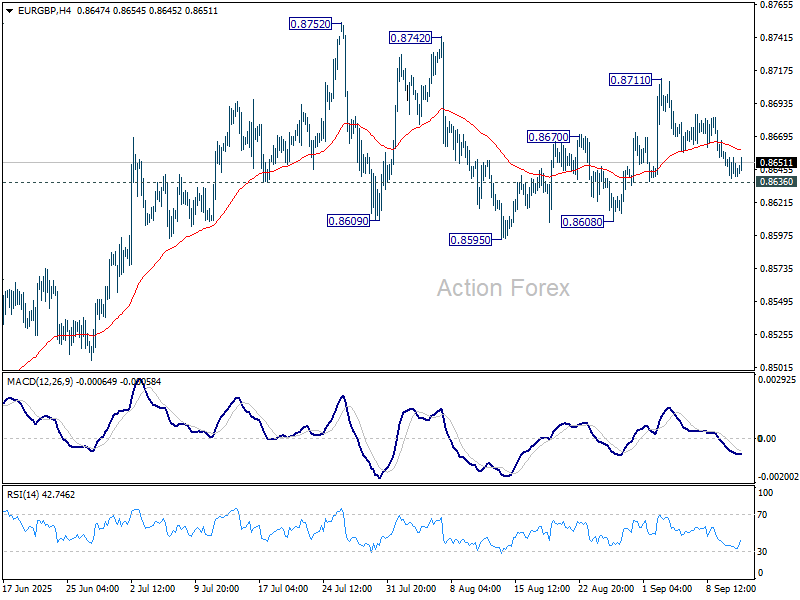
Intraday bias in EUR/GBP stays neutral and outlook is unchanged. Further rise is mildly in favor with 0.8636 minor support intact. On the upside above 0.8711 will bring retest of 0.8752 high. However, break of 0.8636 will extend the pattern from 0.88752 with another falling leg, and target 0.8959 support.
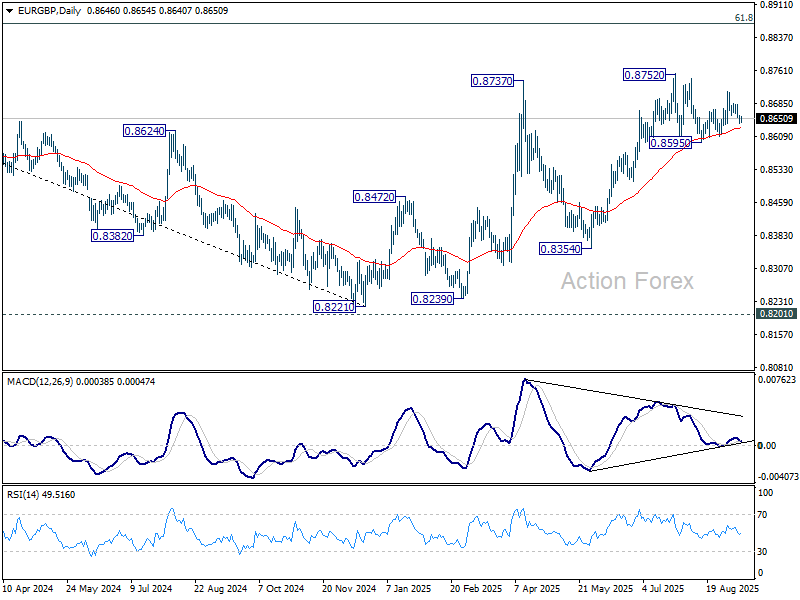
In the bigger picture, the structure from 0.8221 medium term bottom are not impulsive enough to suggest that it's reversing the down trend from 0.9267 (2022 high). But even if it's a correction, further rise could still be seen to 61.8% retracement of 0.9267 to 0.8221 at 0.8867. Nevertheless, sustained trading below 55 W EMA (now at 0.8519) will argue that the pattern has completed and bring retest of 0.8221 low.
EUR/AUD Daily Outlook
Daily Pivots: (S1) 1.7634; (P) 1.7713; (R1) 1.7755; More...
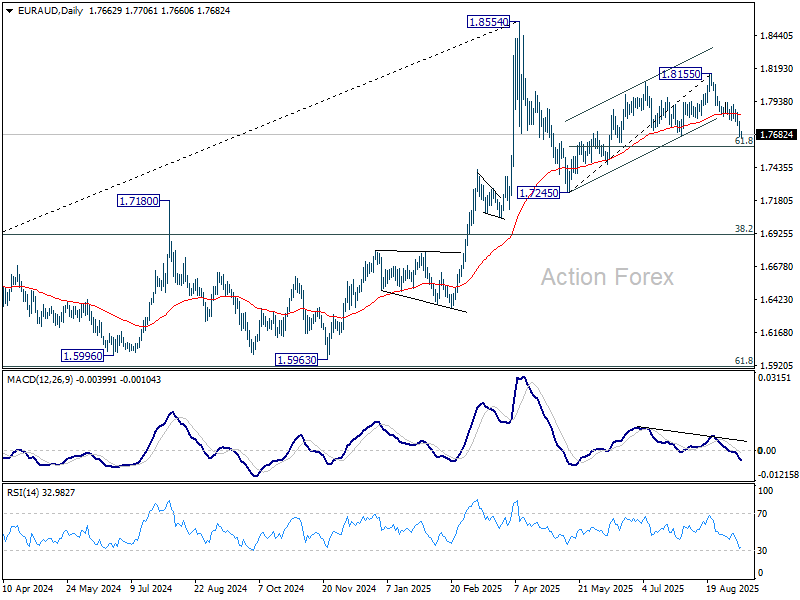
Intraday bias in EUR/AUD stays on the downside at this point. Fall from 1.8155 is seen as the third leg of the corrective pattern from 1.8554. Deeper fall should be seen to 61.8% retracement of 1.7245 to 1.8155 at 1.7593. Break will target 1.7245 support. On the upside, above 1.7796 support turned resistance will turn intraday bias neutral first.
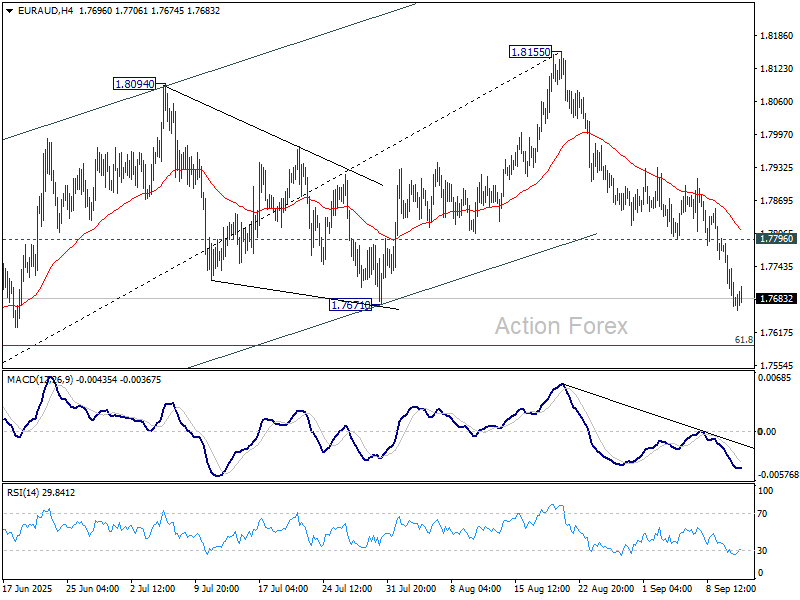
In the bigger picture, price actions from 1.8554 medium term top are seen as a corrective pattern. Such pattern could extend further with another falling leg. But even in that case, downside should be contained by 38.2% retracement of 1.4281 (2022 low) to 1.8554 at 1.6922 to bring rebound. Uptrend from 1.4281 is expected to resume at a later stage.
EUR/CHF Daily Outlook
Daily Pivots: (S1) 0.9330; (P) 0.9342; (R1) 0.9360; More....
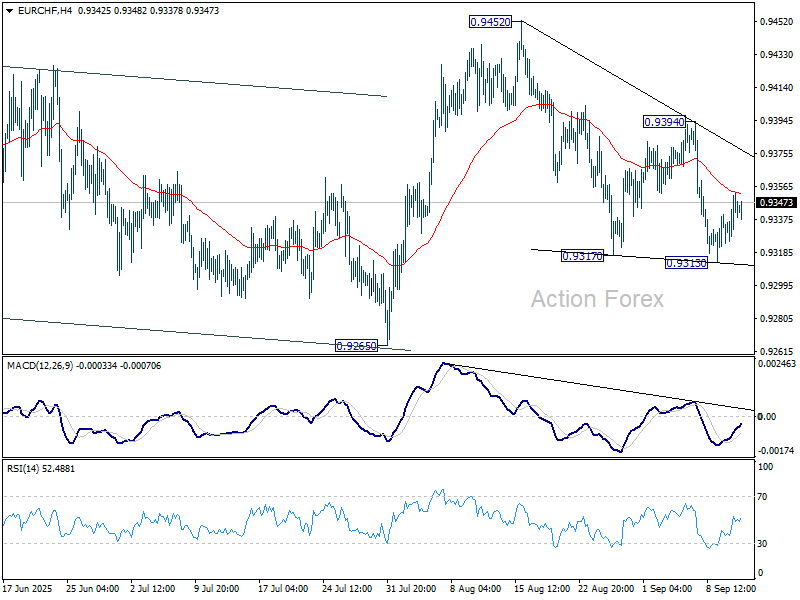
Intraday bias in EUR/CHF is turned neutral first with current recovery. Risk will stay on the downside as long as 0.9394 resistance holds. On the downside, firm break of 0.9313 support will resume the decline from 0.9452. That would also solidify the bearish case that corrective pattern from 0.9218 has completed with three waves up to 0.9452 already. Deeper fall should then be seen to 0.9265 support, and then 0.9204 low.
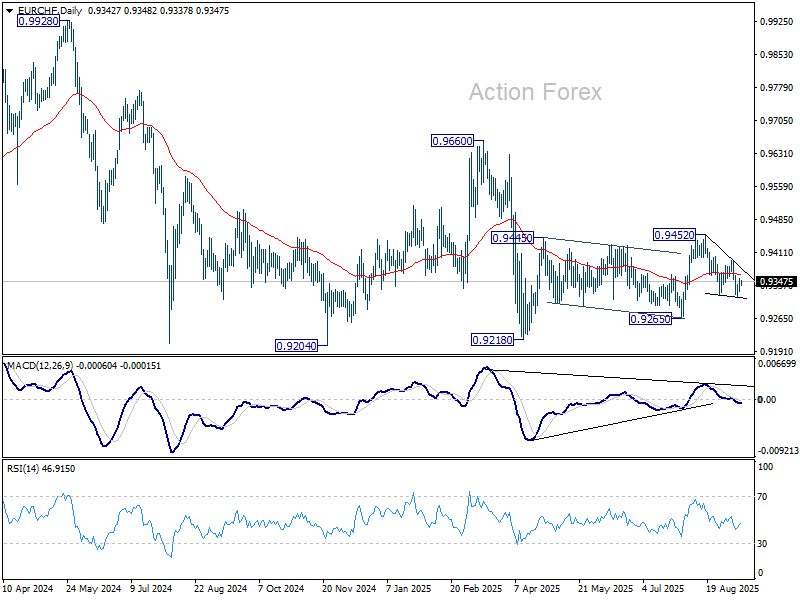
In the bigger picture, the down trend from 0.9204 (2018 high) might still be in progress considering that EUR/CHF is staying well inside the long term falling channel. However, with bullish convergence condition in W MACD, downside potential should be limited in case of another fall. Instead, firm break of 0.9660 resistance will be an important sign of medium term bullish trend reversal.
CB Lagarde Has Every Reason to Keep Communication Deliberately Uninformative
Markets
Market focus shifted from the US labour market back to inflation. Mediocre labour data last week reinforced the case for the Fed to restart easing. Still, the market reaction remained guarded, especially on the pace of normalization. This caution prevailed in the wake of softer than expected August PPI data yesterday. Both headline and core (ex-food and energy) declined 0.1% M/M (2.6% and 2.8% Y/Y respectively). Core-core (also excluding trade) was more in line with expectations (0.3% M/M and 2.8% Y/Y). After the surprise rebound in yields after Tuesday’s downward BLS payrolls revision, US yields yesterday eased 1.5 bps (2-y) to 4.2 bps (10-y). Even so, three 25 bps steps by the end of the year are still not fully discounted. Markets apparently first want more additional Fed guidance on the balance between labour and inflation. The outperformance at the long end was reinforced by a strong 10-yr Note auction later in the session. EMU interest rate markets treaded water ahead of today’s ECB meeting. A brief USD-dip after the PPI-release was soon reversed. DXY (97.78) and EUR/USD (1.1695) showed no directional bias at all. The Nasdaq and the S&P 500 closed at (minor) new record levels.
Three topics are bound to capture markets’ attention today. The ECB holds a regular policy meeting, with the assessment supported by new staff economic projections. In the US, August CPI data are providing the final key input ahead of next week’s Fed policy decision. The US Treasury sells $22bn of 30-y Bonds. More than is the case for the Fed, the ECB can tell markets that it is in a good place. Headline Inflation is perfectly on target (2.1%). Core is still slightly higher (2.3%), but in June the ECB projected inflation to ease next year, before returning to target in 2027. There is little reason to change this view. Growth recently held up better than expected. The ebbing of trade tensions and fiscal stimulation filtering through might cause a slight upward revision in growth forecasts. ECB Chair Lagarde has every reason to maintain the July strategy of keeping communication deliberately uninformative about future interest rate decisions. With markets still not completely excluding a final rate cut (65% chance) next year, the downside in short term EMU yields looks well protected. US August CPI is expected at 0.3% M/M for both core and headline to result in 2.9% Y/Y (from 2.7%) and 3.1% (unchanged) respectively. Recent price action suggests that sub-consensus CPI is needed for markets to fully embrace the idea of the Fed (re)accelerating policy easing. In case of mixed, in line CPI data, the 3.5% support (2-y) can survive for some time. The 30-y US Treasury action also deserves a closer look. High absolute yield levels and the fiscal sustainability theme moving a bit to the background, triggered renewed buying interest. Interesting to see how much easing in (fiscal) risk premia investors are prepared to accept. On FX markets, the ECB-US CPI combo probably extends the recent directionless USD (& EUR/USD) trading.
News & Views
Mexico is planning to impose tariffs of as much as 50%, applicable to more than 1400 product categories including cars, steel, toys and furniture, coming from countries that have no trade agreement with Mexico. Among the biggest to be hit are South Korea, India and China. Mexico has for example become the biggest destination for Chinese cars. Its economy minister said the decision is to protect jobs but it’s also considered a move to appease the US administration ahead of a review of the USMCA (US-Mexico-Canada) trade agreement next year. Both Canada and the US took measures in recent years to prevent Chinese vehicles from entering their markets.
The RICS’s UK house price tracker defied expectations for a slight improvement in August, dropping instead to the lowest level since January 2024. The index retreated from -13.4% to -18.5% with further price declines expected in the next three months. The surveyors said that sales are falling at an accelerated pace and buyer demand is weakening in most of the UK. Head of market research and analysis at RICS Parsons said that “Concerns over the wider economic and fiscal outlook, combined with questions around the future path of interest rates amid stubbornly high inflation, are weighing on sentiment at this time.”
EUR/USD Daily Outlook
Daily Pivots: (S1) 1.1674; (P) 1.1703; (R1) 1.1722; More...
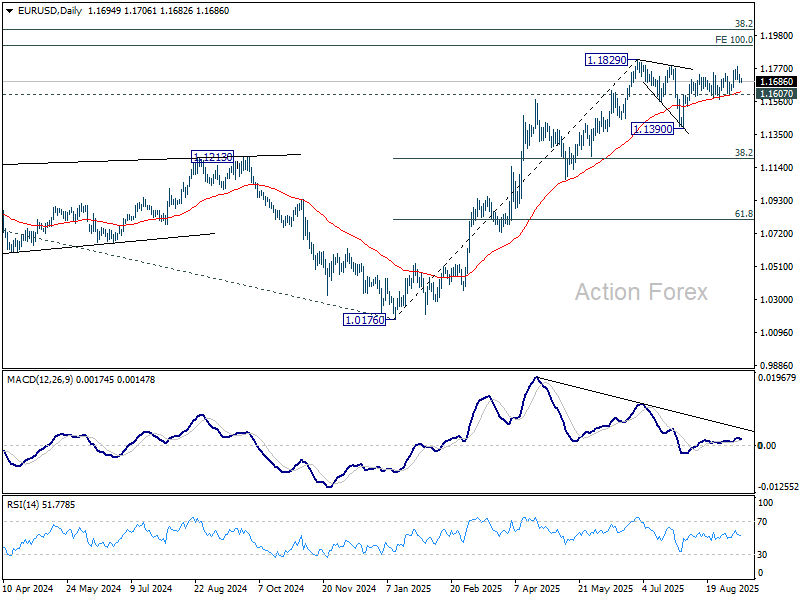
Intraday bias in EUR/USD stays neutral as consolidations continue below 1.1779 temporary top. Further rise is expected with 1.1607 support intact. Above 1.1779 will bring retest of 1.1829 high. Firm break there will resume larger up trend to 1.1916 projection level.
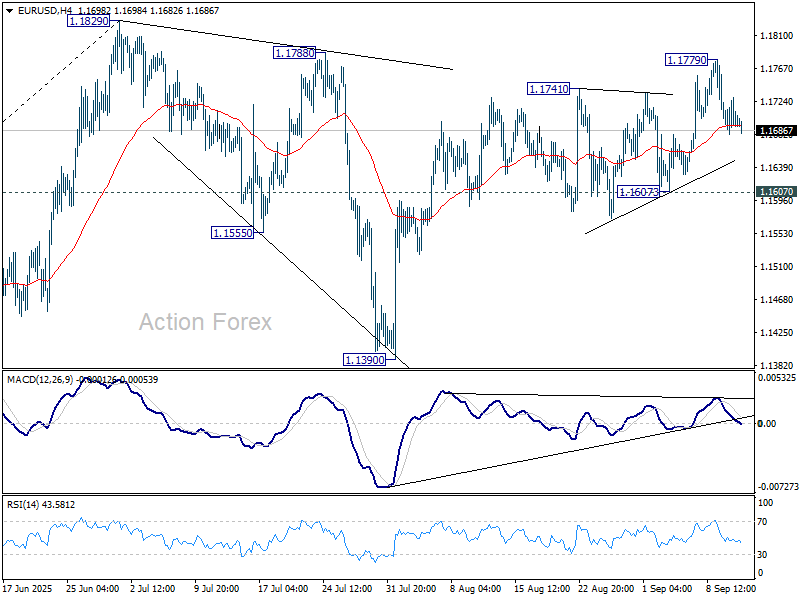
In the bigger picture, rise from 0.9534 (2022 low) long term bottom could be correcting the multi-decade downtrend or the start of a long term up trend. In either case, further rise should be seen to 100% projection of 0.9534 to 1.1274 from 1.0176 at 1.1916. This will remain the favored case as long as 1.1604 support holds.
USD/JPY Daily Outlook
Daily Pivots: (S1) 147.20; (P) 147.42; (R1) 147.69; More...
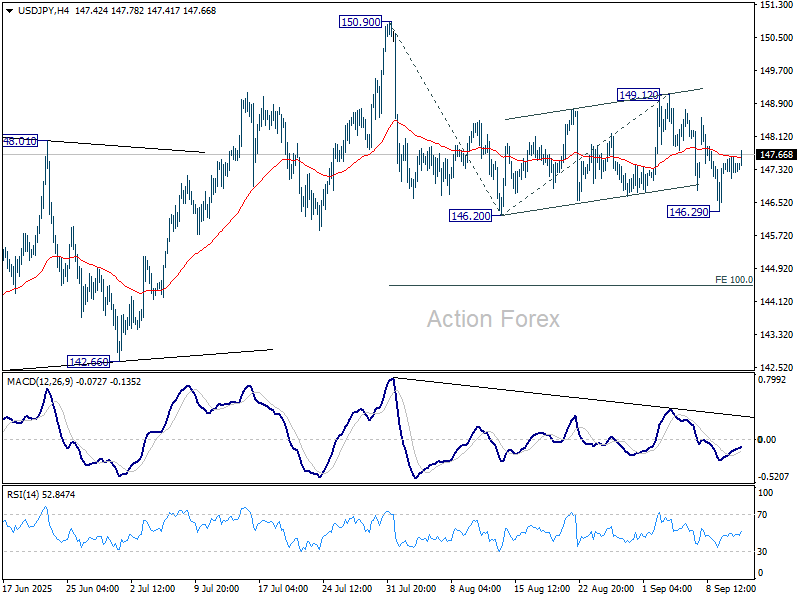
Intraday bias in USD/JPY stays neutral for consolidations above 146..29. Risk will stay on the upside as long as 149.12 resistance holds. Firm break of 146.20 will target 100% projection of 150.90 to 146.20 from 149.12 at 144.42. Also, sustained trading below 55 D EMA (now at 147.15) will argue that whole rebound from 139.87 has completed with three waves up to 150.90.
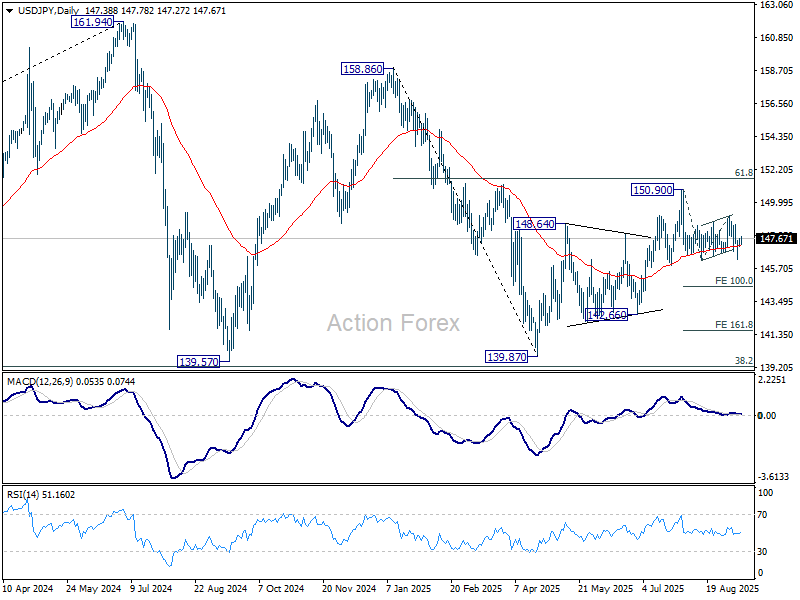
In the bigger picture, price actions from 161.94 (2024 high) are seen as a corrective pattern to rise from 102.58 (2021 low). Decisive break of 61.8% retracement of 158.86 to 139.87 at 151.22 will argue that it has already completed with three waves at 139.87. Larger up trend might then be ready to resume through 161.94 high. In case the corrective pattern extends with another fall, strong support is expected from 38.2% retracement of 102.58 to 161.94 at 139.26 to bring rebound.
GBP/USD Daily Outlook
Daily Pivots: (S1) 1.3508; (P) 1.3534; (R1) 1.3556; More...
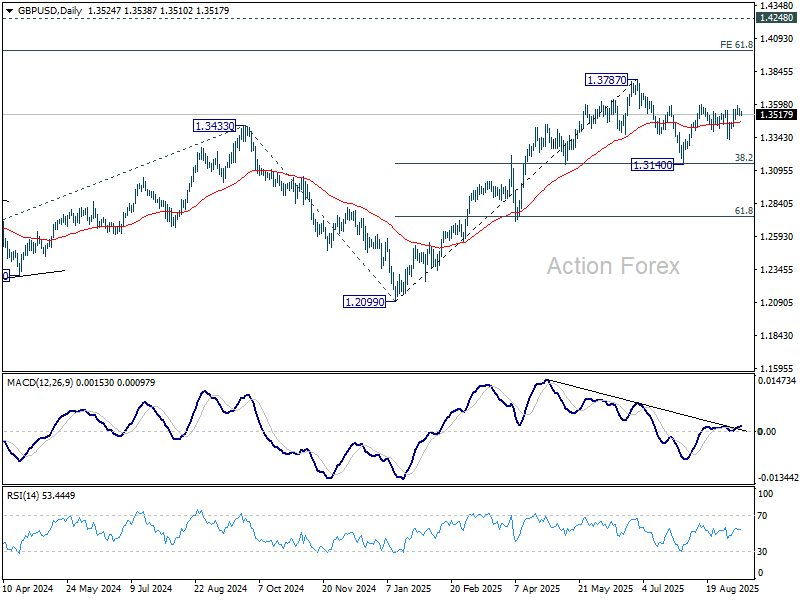
Intraday bias in GBP/USD remains neutral for consolidations below 1.3590 temporary top. Further rise is expected with 1.3332 support intact. Firm break of 1.3594 will resume the rally from 1.3140 and target a retest on 1.3787 high.
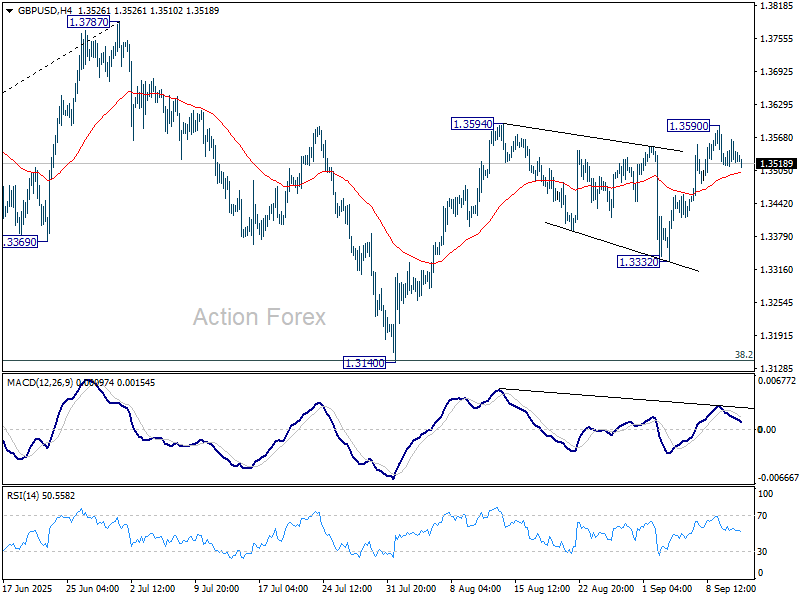
In the bigger picture, up trend from 1.3051 (2022 low) is in progress. Next medium term target is 61.8% projection of 1.0351 to 1.3433 from 1.2099 at 1.4004. Outlook will now stay bullish as long as 55 W EMA (now at 1.3132) holds, even in case of deep pullback.
USD/CHF Daily Outlook
Daily Pivots: (S1) 0.7970; (P) 0.7982; (R1) 0.8006; More….
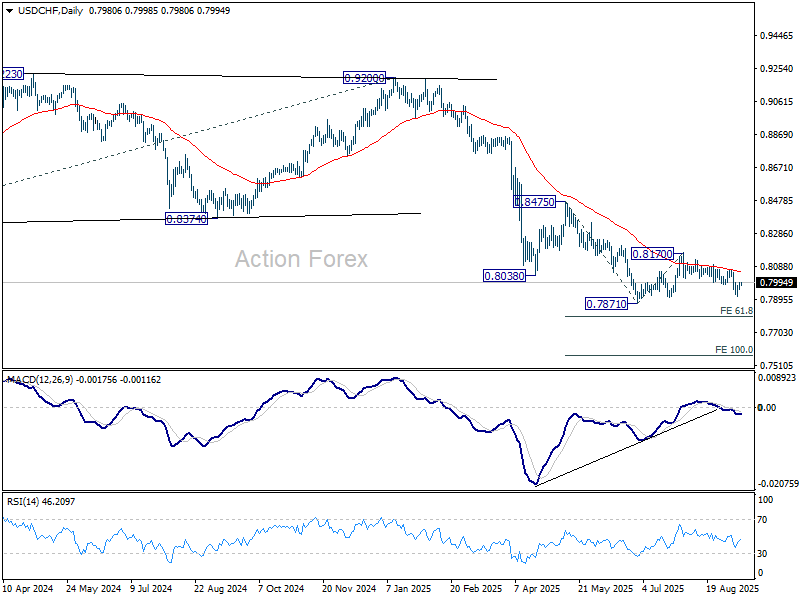
Intraday bias in USD/CHF remains neutral for consolidations above 0.7914 temporary low. Risk will stay on the downside as long as 0.8071 resistance holds. Below 0.7914 will bring retest of 0.7871 low. Firm break there will resume larger down trend. Next target is 61.8% projection of 0.8475 to 0.7871 from 0.8170 at 0.7797.
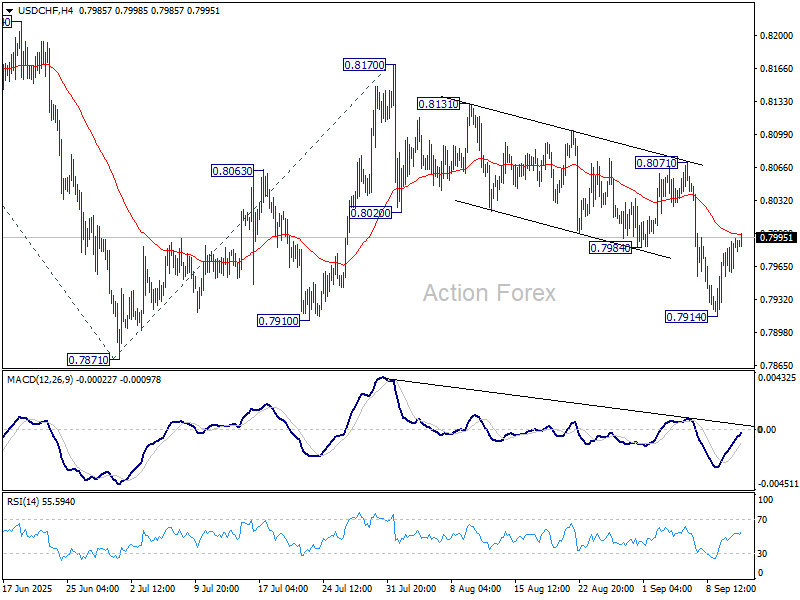
In the bigger picture, long term down trend from 1.0342 (2017 high) is still in progress. Next target is 100% projection of 1.0146 (2022 high) to 0.8332 from 0.9200 at 0.7382. In any case, outlook will stay bearish as long as 0.8475 resistance holds.