Sample Category Title
Bringing Back the Cuts to US and Canada
Log in to our mid-week North American Markets overview, where we examine the current themes in North America and provide an overview of indices and currency performances.
This week, some data dampened the economic outlook for both the US and Canada. The past four months didn't show much in that aspect, and participants started to believe that tariffs wouldn't influence activity that much.
However, it seems that the markets were too optimistic for North America. August gave a first warning sign, with the US Non-Farm Payrolls showing the first crack in the labor market, which was confirmed by last Friday's report.
Canada is also struggling with a regressing GDP in the second quarter, undoubtedly due to downbeat employment figures (-60K in August) and pressure from tariffs on key exports such as metals (aluminum, steel) and lumber.
The degrading economic outlook and slowdown in hiring are essentially bringing back hopes for cuts with a 90% priced-in Bank of Canada reduction (from 2.75% to 2.50%) at the upcoming meeting on the same day as the FOMC, September 17th.
For the Federal Reserve, a much-anticipated cut should also finally take place (Rates are currently at 4.50%), and the question from which we will get an answer tomorrow is:
Will Consumer Prices take a significant bump, barring the way for a 50 bps cut?
Any release below the expected 0.30% raise should flush the US Dollar, and markets would heavily lean towards a 50 bps (currently at 10% pricing).
On the other hand, a beat should leave the 25 bps in check but reduce odds for cuts at subsequent meetings (2 meetings after this one: October and December).
Let's dive right into a few charts to get an overview on North American Markets, from US and Canadian equity Markets performance, USD and CAD performance to USDCAD and DXY charts.
North-American Indices Performance
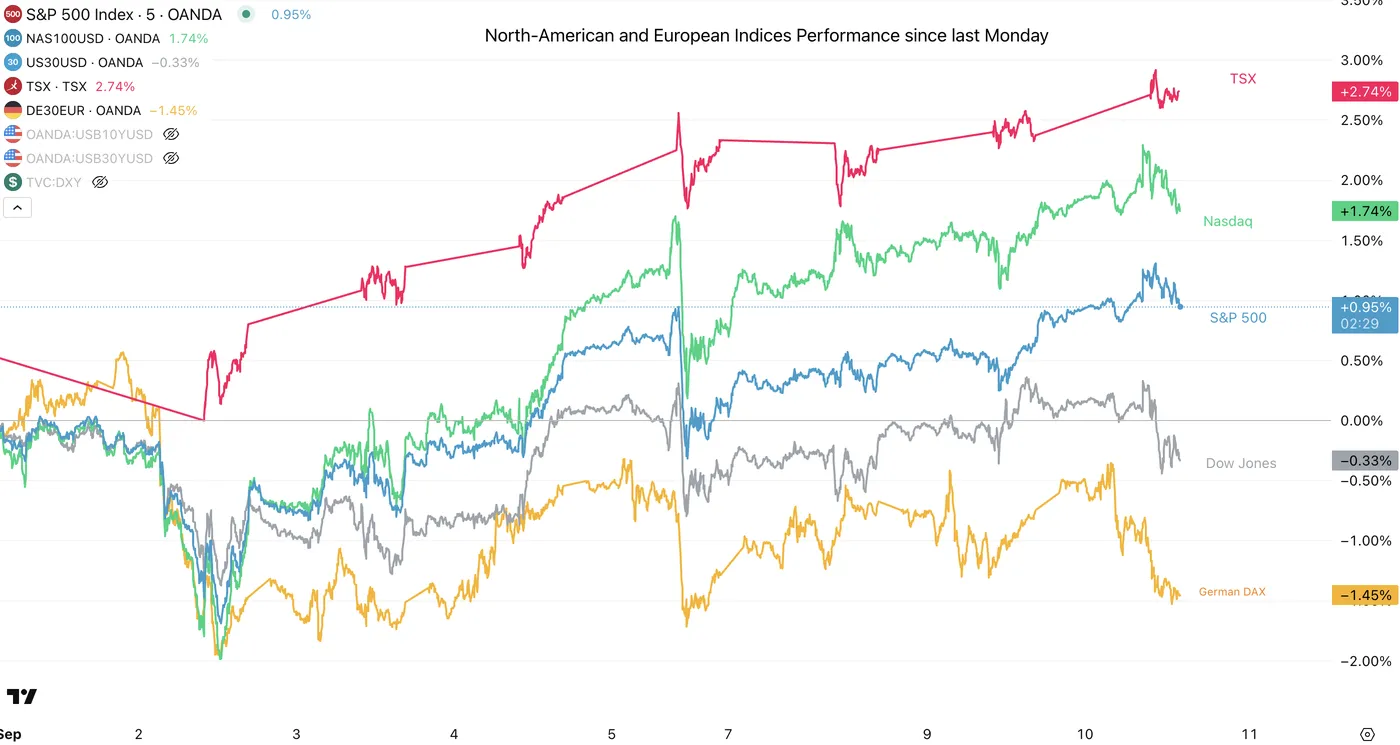
North American Top Indices performance since last Monday – September 10, 2025 – Source: TradingView
Same as in previous weeks, the TSX just seems to absolutely disregard the downbeat economic data.
Never forget that equities are forward looking and cut expectations in an economy that is still far from in shambles and expected to grow in the decades to come attract buying.
US Markets are still holding resiliently against the streak of downbeat employment data also lifted by hopes for increased rate cuts.
All indices have marked new record highs in today's session actually but have since seen some profit-taking flows ahead of tomorrow's inflation report.
Dollar Index 8H Chart
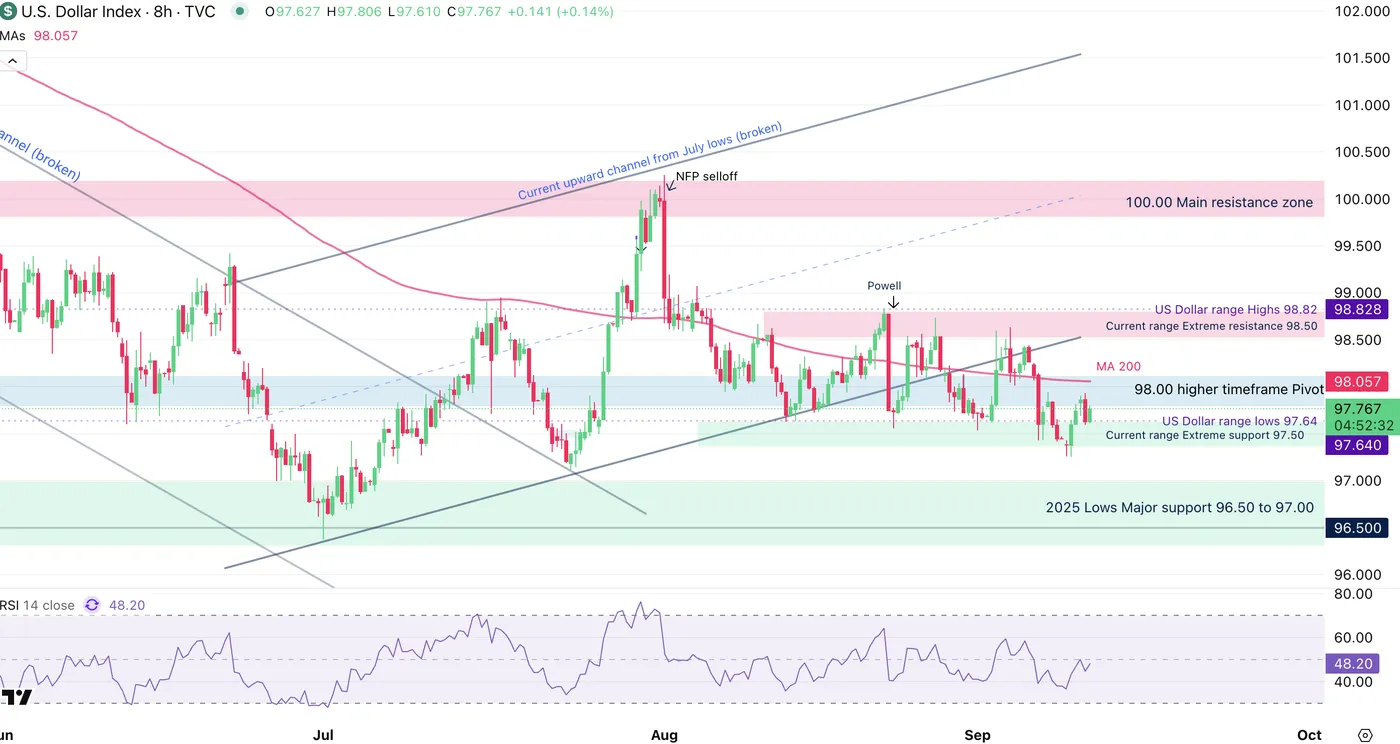
Dollar Index 8H Chart, September 10, 2025 – Source: TradingView
The US Dollar is holding its range as neither the NFP or this morning's PPI have changed the outlook for future rate cuts.
This puts that much emphasis on tomorrow's CPI report which should be one of the most important one in years. Get ready!
With the range still holding, I invite you to check out our most recent Dollar Index analysis to spot your levels of interest for the USD.
US Dollar Mid-Week Performance vs Majors
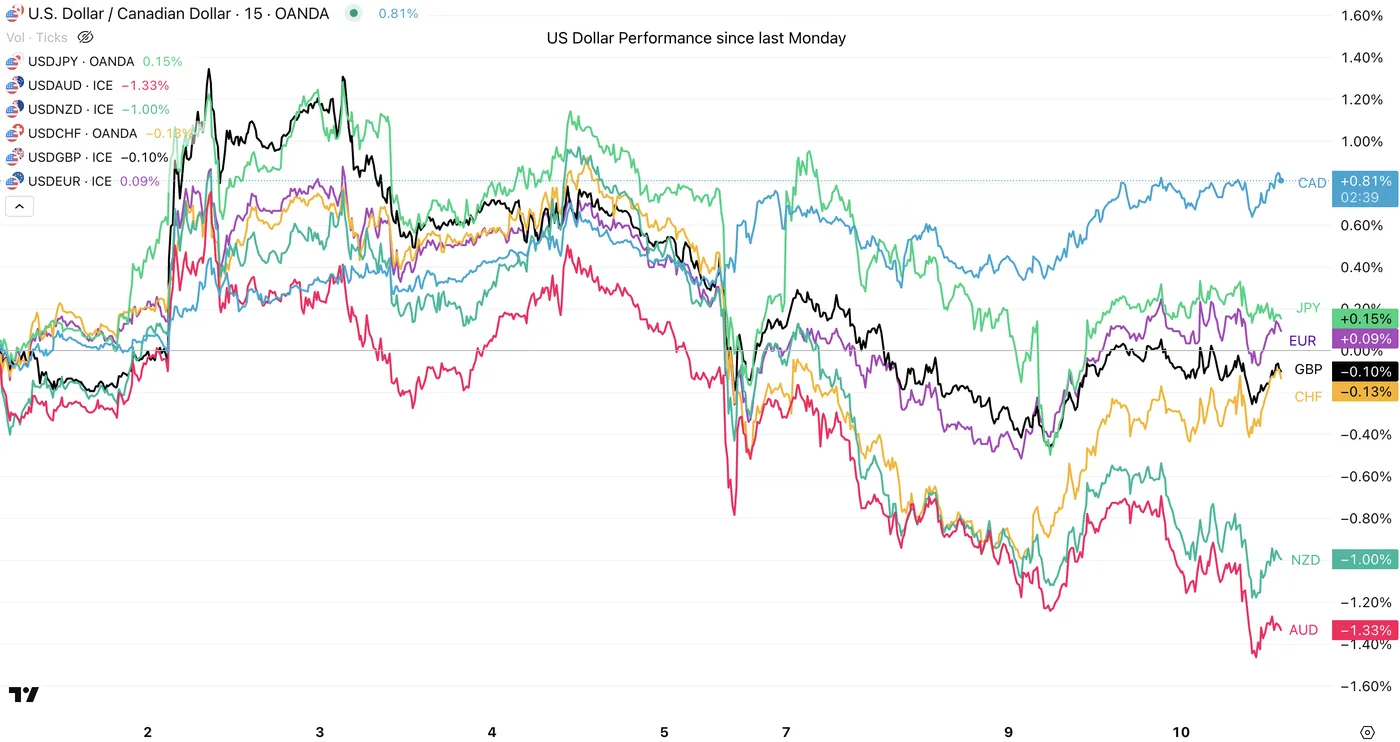
USD vs other Majors, September 10, 2025 - Source: TradingView.
The action in the US Dollar has stayed stubbornly rangebound.
The latest downward revisions to the US Labor data since March 2025 (you can check out the report right here) had initially hurt the USD, but as can be seen in the latest rebound, buyers have held its bid at new range extremes.
War headlines around the world still maintain somewhat of a US Dollar demand which slightly reduced after this morning's welcomed PPI report (are tariff-related price hikes really just a one-off??)
Expect high swings for the USD tomorrow as markets will look to confirm the outcome of next week's FOMC.
Canadian Dollar Mid-Week Performance vs Majors
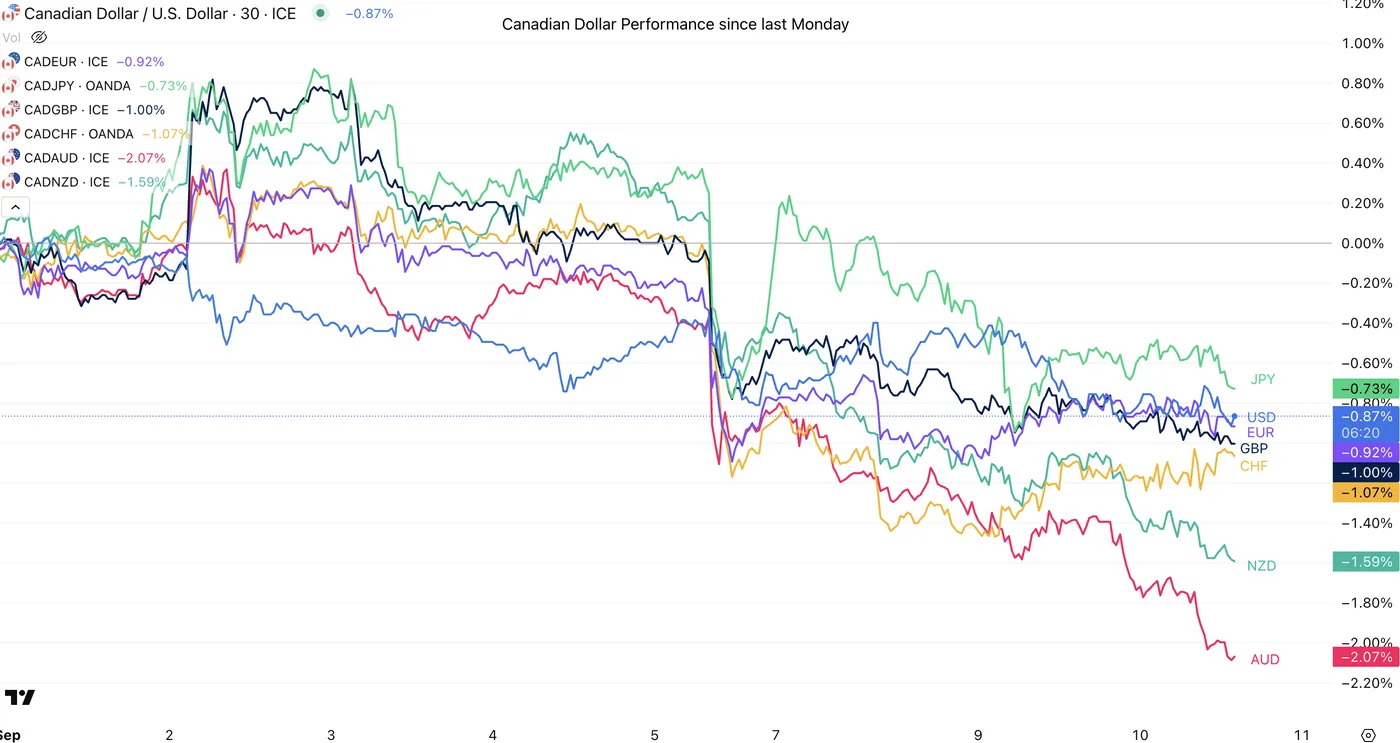
CAD vs other Majors, September 10, 2025 - Source: TradingView.
The Loonie couldn't hold its past week's strength with the aggressively low employment figures released last Friday. This week has been atrocious for the Maple Dollar.
With more cuts expected ahead, it will be very interesting to see what the Bank of Canada will have to say at next week's meeting. The BoC would also love a higher rate cut from the USD to help with the CAD's current downfall.
Intraday Technical Levels for the USD/CAD
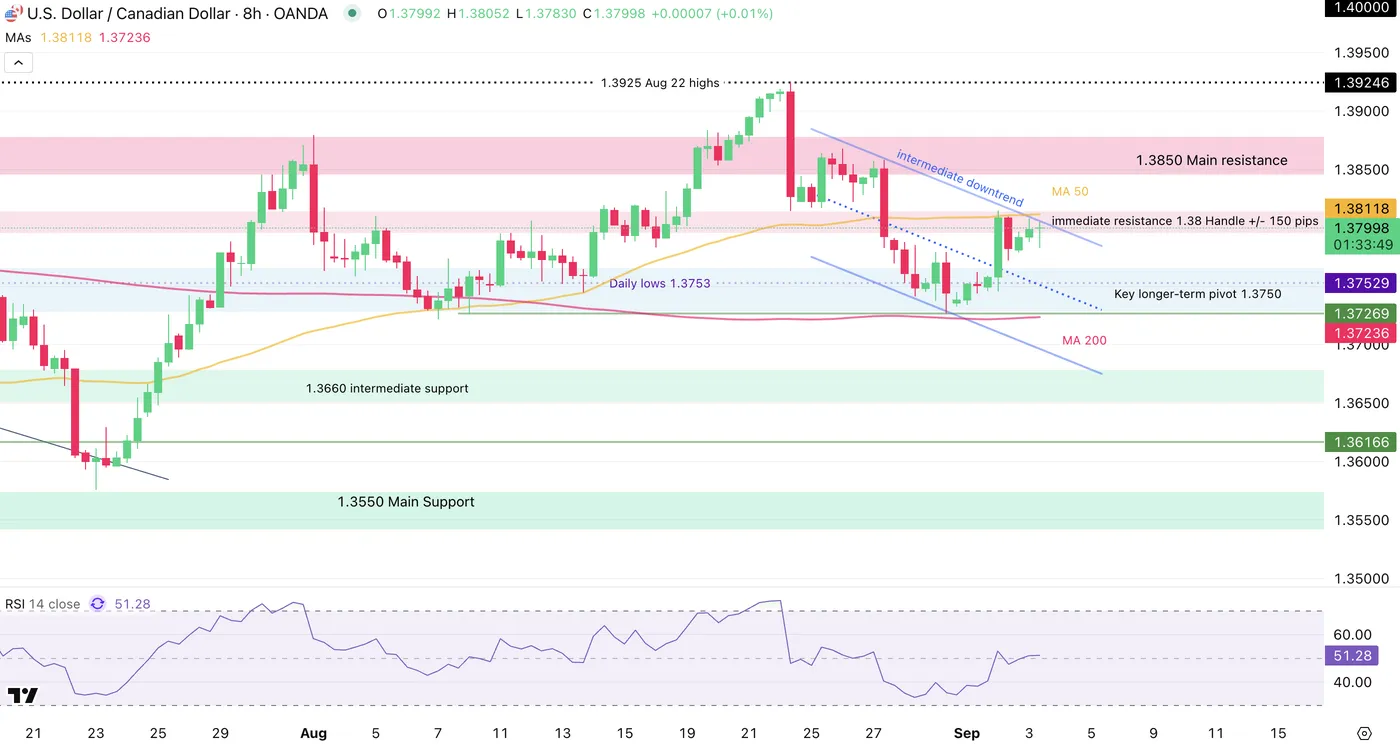
USDCAD 4H Chart, September 10, 2025 – Source: TradingView
USDCAD has freshly marked some highs at similar levels as the August 26th top, but seems to be consolidating at the current daily peak.
It will be very interesting to spot the reactions for the US Dollar and if an eventually stronger USD would also assist the CAD on its perpetual descent.
Levels to place on your USDCAD charts:
Resistance Levels:
- 1.3925 August 22 highs (most recent peak)
- 1.3850 to 1.3860 Main resistance (1.38670 daily highs)
- May Highs 1.40185
Support Levels:
- immediate Pivot 1.38 Handle +/- 150 pips
- Key longer-term pivot Zone 1.3750
- Main Support Zone 1.3675 to 1.3686
US and Canada Economic Calendar for the Rest of the Week
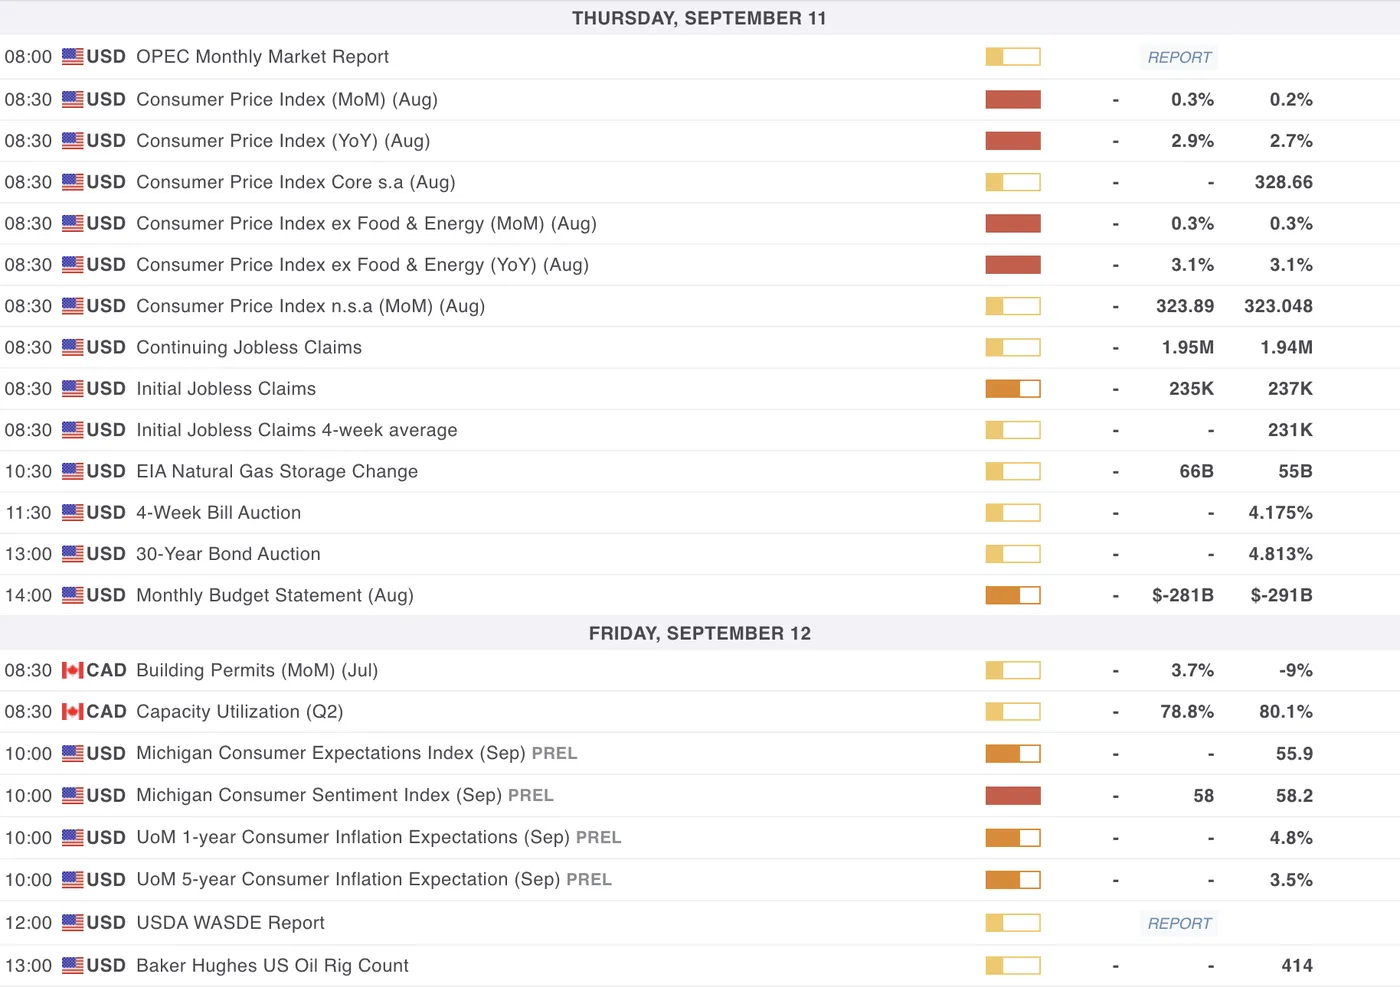
US and Canadian Data for the rest of the week, MarketPulse Economic Calendar
With Markets not budging much from the consequent NFP and PPI reports, everything will depend on tomorrow's US CPI release (8:30 A.M. ET).
With 0.3% expected for both the Headline and Core, reactions will have to be monitored closely as Markets will jump around in all directions.
To guide you with tomorrow's volatility, track the Dollar Index, the FEDWatch Tool (for Interest rate expectations) and the 2-year yield.
For the rest, look at the usual equity sentiment.
Except for tomorrow's US CPI, some other less-relevant data may still move markets with the Weekly jobless claims tomorrow, Canadian capacity utilization on Friday (8:30) and the following University-of-Michigan Consumer Sentiment at 10:00 A.M.
Safe Trades!
Gold (XAU/USD) Coils Ahead of US CPI… Are Bulls Exhausted?
Gold prices are holding in and around the $3650/oz handle. The precious metal is benefitting from the perfect combination of political uncertainty, geopolitical risk and of course Fed rate cut bets.
Russia Conflict Sees Nato Trigger Article 4... What Next?
On Wednesday, Poland, with help from its NATO allies, shot down what they believed to be Russian drones that had entered Polish airspace. This is the first time a NATO country has fired shots during the conflict between Russia and Ukraine.
Poland's Prime Minister, Donald Tusk, told parliament that this was "the closest we have been to open conflict since World War Two." However, he also added that he doesn't believe they are on the verge of war.
Tusk called the incident a "large-scale provocation" and said he had activated Article Four of NATO's treaty, under which alliance members can demand consultations with their allies.
Moscow has denied responsibility for the attack. The Russian Defence Ministry said its drones carried out strikes on military targets in Western Ukraine
So far nothing much has changed except an increase in haven demand and a rise in Oil prices. If NATO does decide to respond in some way that could be seen as aggression by Russia, Gold could be set for further gains.
Other Factors Supporting Gold Prices
The Israel attack on Qatar yesterday has also added to the risk premium while political turmoil in France has done the same. Hence why I am saying we are currently seeing the perfect cocktail for Gold prices to remain elevated.
Add to that the expectations for Federal Reserve rate cuts which received a boost as US PPI data came in well below expectations.
Markets will be focused on the US CPI inflation numbers out tomorrow while the discussions between NATO members may also factor into where gold prices head to next.

For all market-moving economic releases and events, see the MarketPulse Economic Calendar. (click to enlarge)
Technical Analysis - Gold (XAU/USD)
From a technical standpoint, Gold continues to hover near its all time highs.
Momentum indicators are all in sync with the current bullish narrative with a selloff proving elusive thus far.
The one positive for potential short sellers comes from the fact that the PPI data and downward revisions to the job numbers did not push Gold beyond the $3700/oz handle.
This suggests that we could get a pullback toward the $3600/oz before Gold is able to gain acceptance above the $3700/oz handle.
Downside support may be found at the recent swing low at the $3620 handle before $3600 comes into focus.
A move to fresh all time highs will have to gain acceptance beyond the $3700 handle if the bullish rally continues. This may require further geopolitical risk or a really big downside miss by the US CPI data.
Gold (XAU/USD) 30M Chart, September 10, 2025
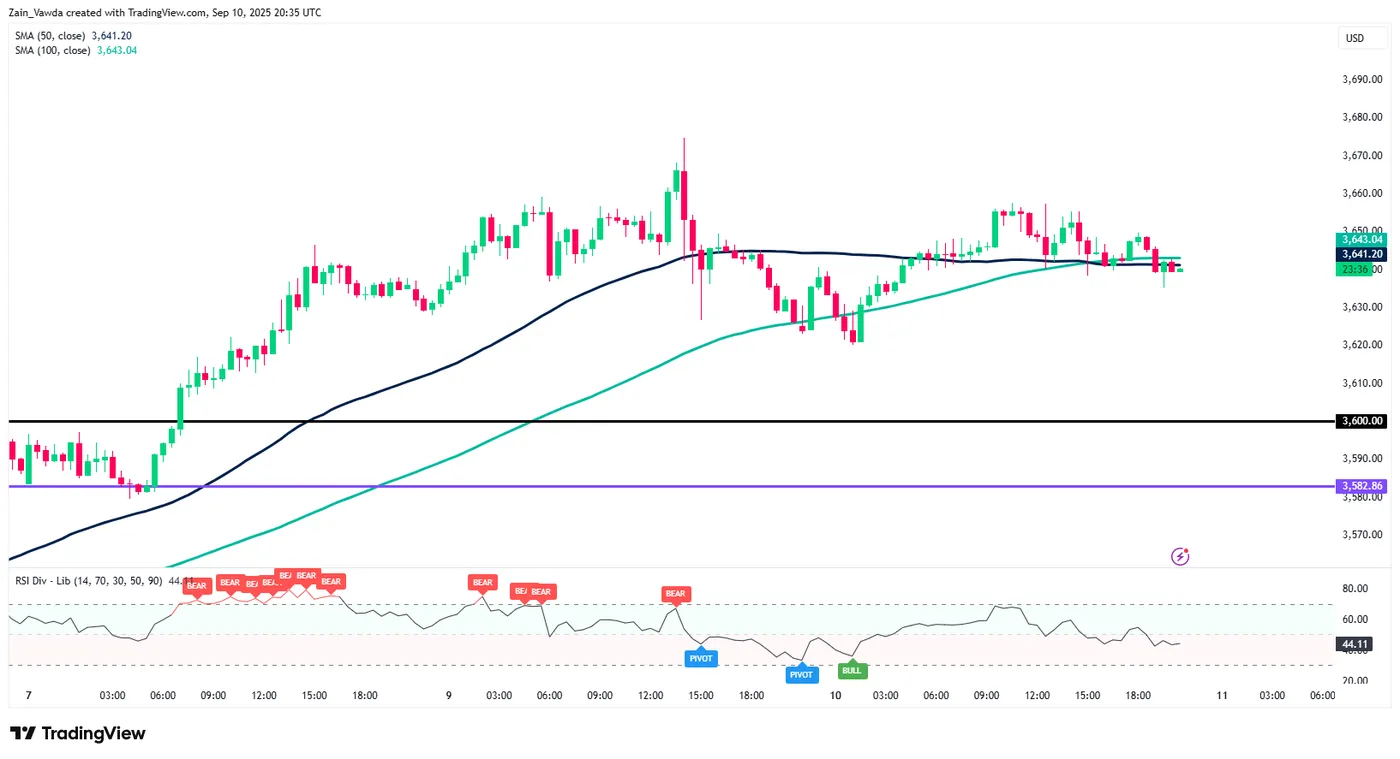
Source: TradingView (click to enlarge)
Client Sentiment Data - XAU/USD
Looking at OANDA client sentiment data and market participants are Short on Gold with 59% of traders net-short. I prefer to take a contrarian view toward crowd sentiment and thus the fact that the majority of traders are net-short suggests that Gold prices could continue to rise in the near-term.
USDCHF Wave Analysis
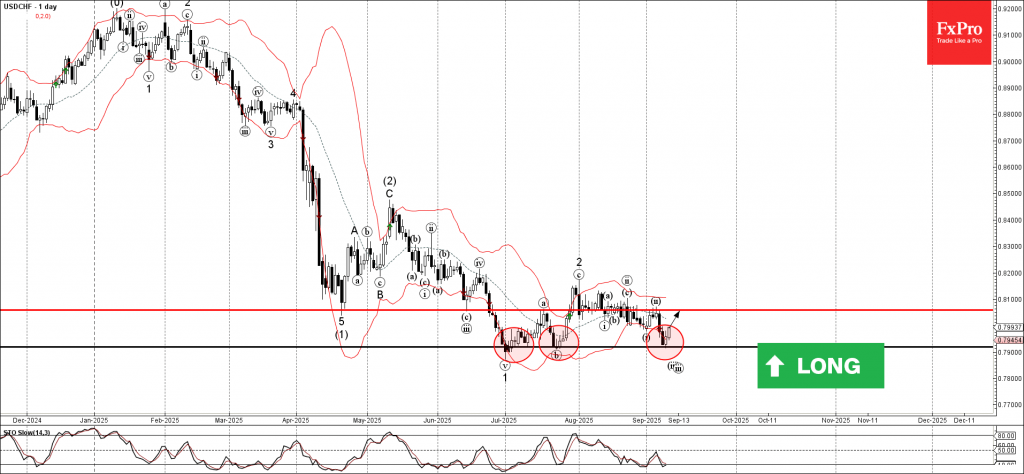
USDCHF: ⬆️ Buy
- USDCHF reversed from support area
- Likely to rise to resistance level 0.8055
USDCHF currency pair recently reversed from the support area between the strong support level 0.7918 (which has been reversing the price from the end of June) and the lower daily Bollinger Band.
The upward reversal from this support area will form the daily Japanese candlesticks reversal pattern Morning Star – if the pair closes today near the current levels.
Given the strength of the support level 0.7918 and the oversold daily Stochastic, USDCHF currency pair can be expected to rise toward the next resistance level 0.8055 (top of the previous correction ii).
CHFJPY Wave Analysis
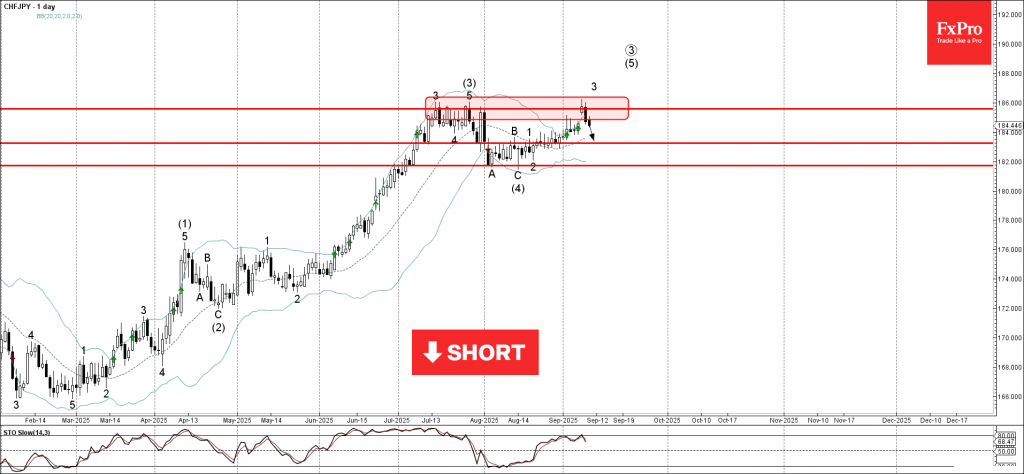
CHFJPY: ⬇️ Sell
- CHFJPY reversed from resistance area
- Likely to fall to support level 183.20.
CHFJPY currency pair recently reversed down from the resistance area between the key resistance level 186.00 (which has been reversing the price from the start of July) and the upper daily Bollinger Band.
The downward reversal from this resistance area stopped the earlier short-term impulse wave 3, which belongs to the upward impulse wave (5) from August.
Given the strength of the resistance level 186.00, CHFJPY currency pair can be expected to fall toward the next support level 183.20.
Surprisingly Soft US PPI Has Boosted Optimism on Interest Rates
The US producer price index has pleased equities bulls, providing the Nasdaq100 with momentum to rise above 24,000 and update its historical highs.
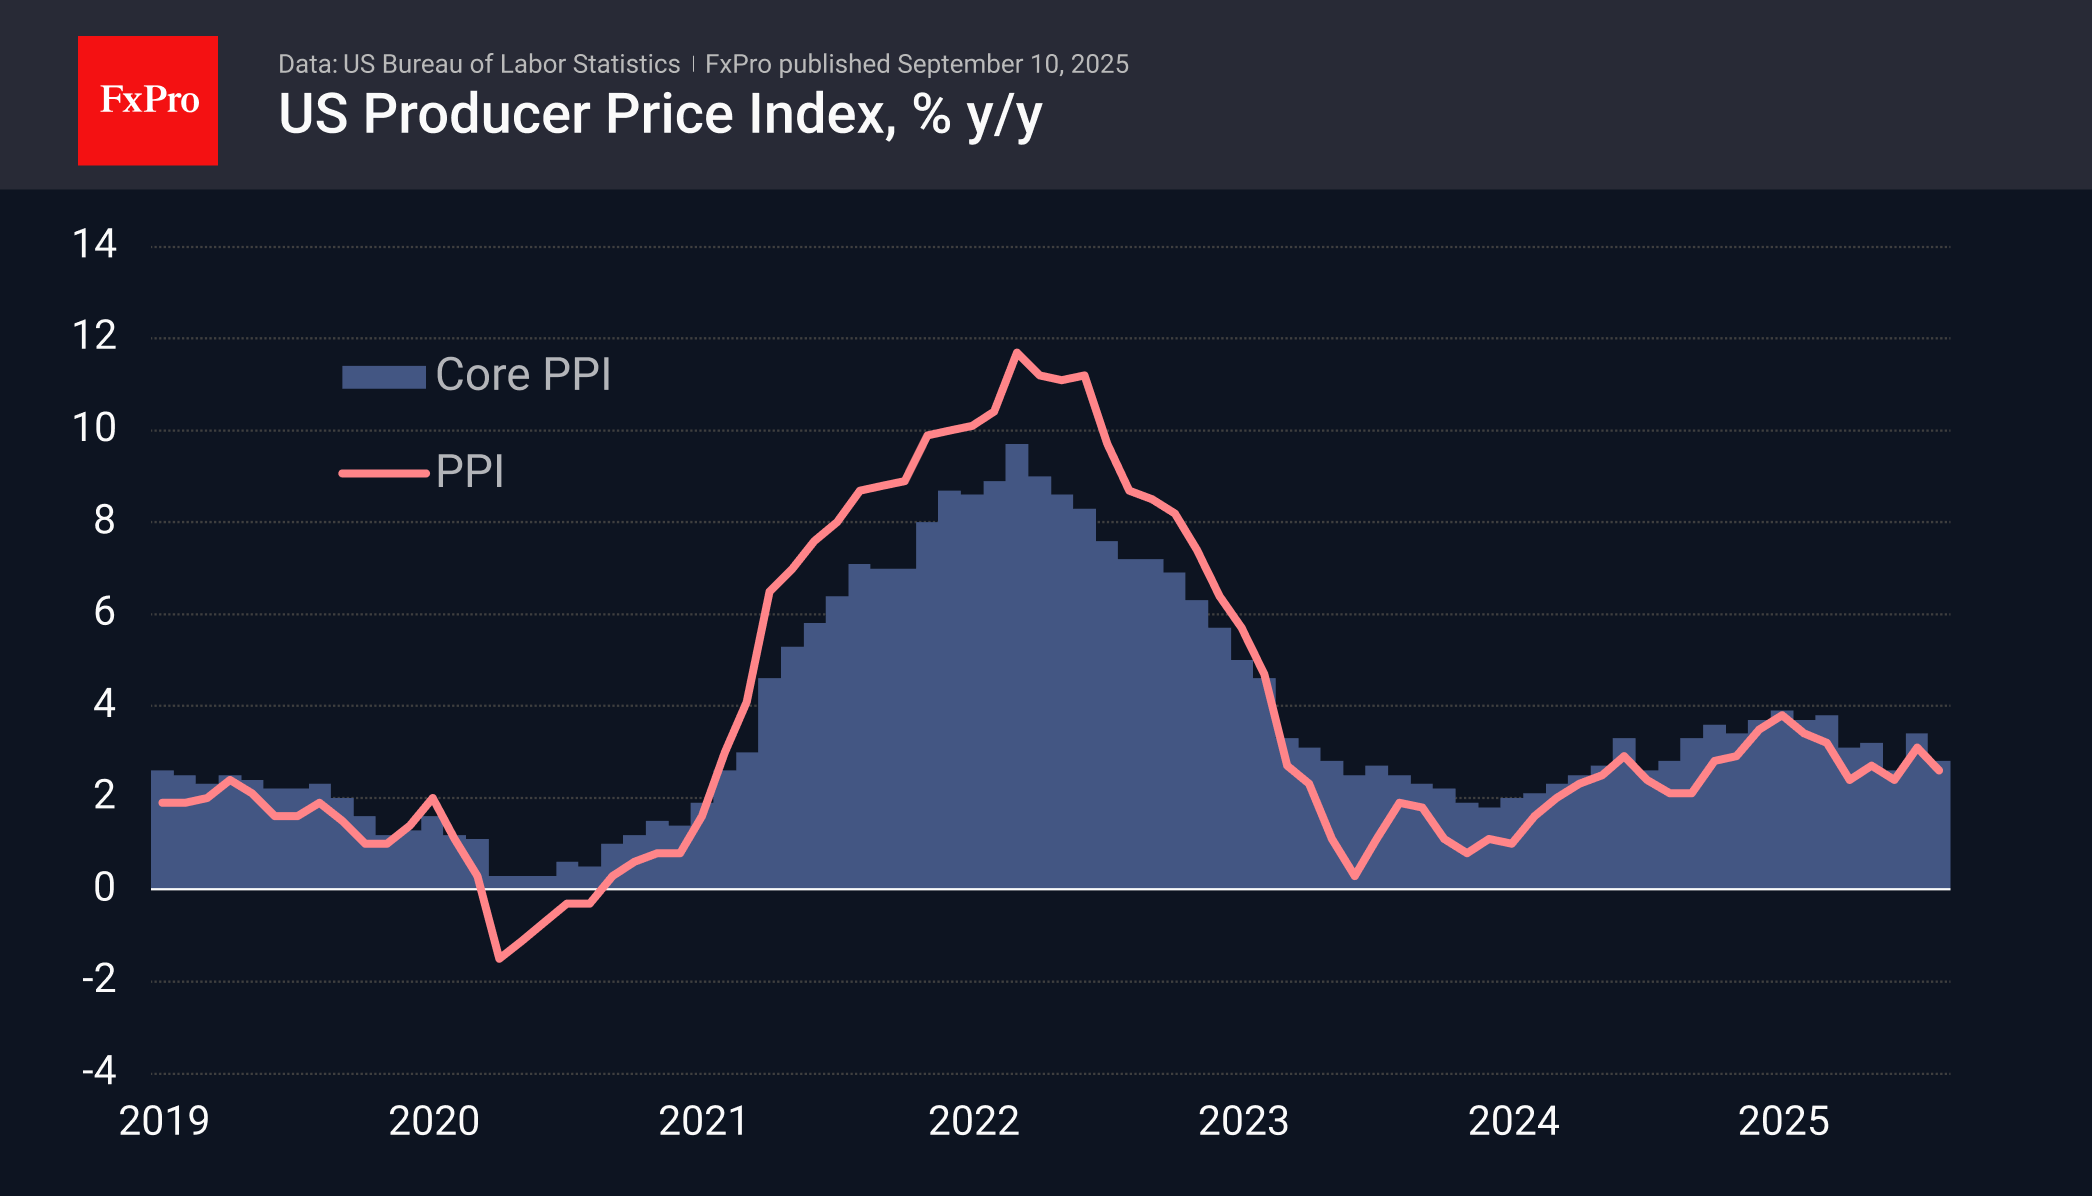
The producer price index fell 0.1% in August, slowing its annual growth rate to 2.6% from 3.1% previously (revised from 3.3%). This is a striking contrast to the average expectations of an acceleration to 3.3%.
Producer prices excluding food and energy also fell by 0.1% for the month, slowing to 2.8% year-on-year from 3.4% a month earlier.
This publication had an impact on the markets for two reasons. First, analysts tend to make the same mistake when forecasting PPI and CPI. Producer prices that are 0.4 percentage points below expectations set traders up for a similar mistake for consumer prices, which are released on Thursday.
Second, PPI is a leading indicator for headline inflation and triggers a reassessment of the inflation outlook for the coming months.
This data fits in with the narrative of recent days, pushing the Fed towards more aggressive interest rate cuts. These sentiments are lifting stock prices and putting pressure on the US dollar. The probability of three or more rate cuts before the end of the year is now estimated at 74%, up from 43% a week earlier.
ECB Unlikely to Change Rates in the Near Future
- ECB likely on hold; markets fully priced for no move.
- Headline inflation path could edge up; expectations ticked to 2.5%.
- Activity improving (PMI > 50); base case remains status quo at a 2% deposit rate.
Baseline for Thursday: hold
The European Central Bank will likely keep interest rates unchanged this Thursday and leave them at their current levels. The setup is favorable: inflation now appears closer to the 2% target than the ECB’s earlier assumptions suggested, and growth prospects are gradually improving. In such conditions, policymakers can feel comfortable with the deposit rate at 2%.
Market pricing and messaging
Markets do not expect a cut on Thursday. In a Bloomberg survey, all economists anticipate no change in policy settings, and Overnight Index Swaps likewise price in no move. Talk of further reductions later in the year is kept alive by a few more “dovish” voices on the Governing Council, and Reuters has reported that some internal discussions leave room to revisit cuts. In my view, however, the ECB will concentrate on stabilizing monetary conditions this year and will not make any major changes to policy parameters.
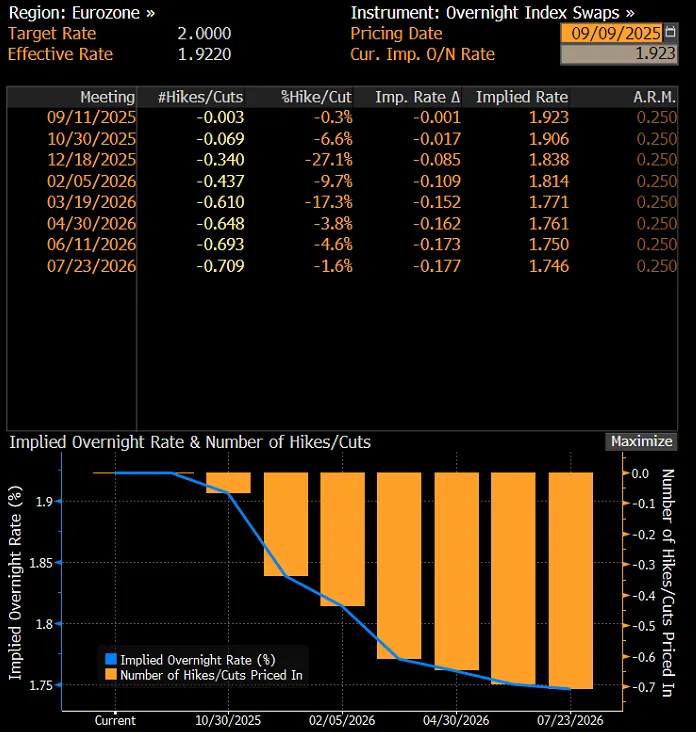
OIS-implied market pricing of the future path of ECB interest rates. Source: Bloomberg.
Inflation path and expectations
It’s not out of the question that the ECB raises its inflation path. The current projection envisages a further slowdown in price dynamics, with a temporary trough at 1.4% in Q1 2026 and a return to 2% in early 2027. An upward revision could stem from forecasts of higher crude oil prices and a higher path for energy costs, which would feed directly into inflation. Household inflation expectations have also ticked up: the median rose to 2.5% (from 2.4% previously). At first glance that’s a small move, but economically it can matter. Remember that household expectations are a key transmission channel over the longer horizon, shaping wage, pricing, and consumption decisions even before actual inflation moves. That’s why central banks work hard to keep 3–5-year expectations firmly anchored near target. In this context, even a small shift in the median from 2.4% to 2.5% may be important—a directional signal that expectations are edging away from target, raising the risk of “de-anchoring.”
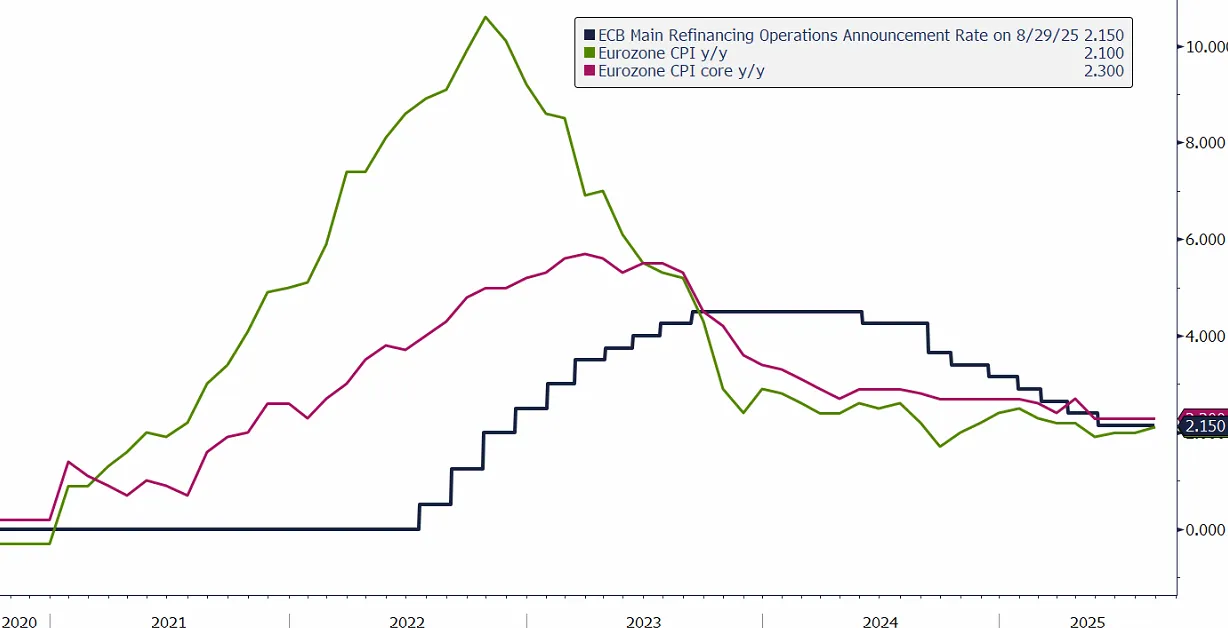
Chart showing the ECB main refinancing rate, CPI inflation, and core CPI inflation (year over year). Source: Bloomberg.
Activity is improving: PMI and trade backdrop
Euro-area activity is picking up. The composite PMI has risen for three consecutive months, reaching 51.0—typically a sign of modest recovery over a 3–6-month horizon. The rebound is especially visible in manufacturing, where the subindex recently moved above 50 for the first time in three years. Cautious optimism may reflect better financing conditions, which at least partly offset U.S. trade barriers. The tariff agreement—while implying higher duties than before—reduces trade-policy uncertainty. President Christine Lagarde has emphasized that the tariff level is “close to the June assumptions.”
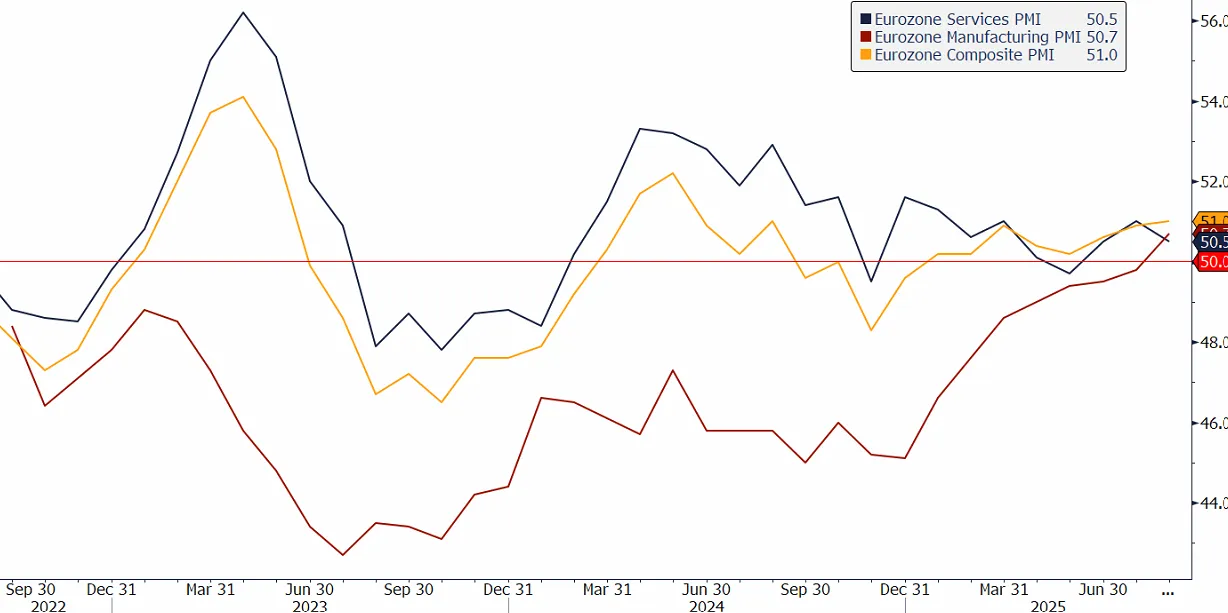
PMI indicators for the euro-area economy. Source: Bloomberg.
What to expect on Thursday
We may see a slight upward revision to the GDP growth projection for Q3 and, by extension, for the full year, alongside a modest lift in the headline inflation path toward target. The core inflation projection will likely stay broadly unchanged and continue converging to 2%. This picture offers no compelling case for rapid easing or renewed tightening. The most coherent strategy is to maintain the status quo—watch the data—and run policy at a level the ECB is comfortable with, i.e., a 2% deposit rate.
Sunset Market Commentary
Markets
The BLS’s employment revision yesterday offered the final input from the labour market perspective for next week’s Fed policy meeting. The 911k downward adjustment for April 2024 through March 2025 was a historically high one but didn’t lure markets into adding to their Fed easing bets for 2025 - the opposite actually happened. It’s perhaps not that farfetched given that inflation has been reaccelerating since April to still be above the central bank’s 2% target. PPI numbers for August today addressed those concerns a bit. They unexpectedly printed a negative 0.1% m/m in the headline and core (ex. energy and food) gauge, missing the 0.3% estimate. The annualized figures slowed to 2.6% and 2.8% respectively, well below the 3.3% and 3.5% expected. A downward revision to July’s (though sizeable) PPI increase adds to the magnitude of the sub-consensus outcome. The supercore series (ex. food, trade and energy) matched the 0.3% m/m forecast (2.8% y/y). Crude food acted as a major drag, tumbling a whopping 13.2% on a monthly basis. Energy (-0.4% m/m) and services (trade in particular: -1.7%) weighed as well. The numbers raise the stakes for tomorrow’s consumer equivalent, for which a rise to 2.9% from 2.7% is expected, and offered markets a welcome distraction from an otherwise dull trading session today. US yields fell in a bull flattening move with net daily changes varying between -3.3 bps (2-yr) to -0.8 bps (30-yr). Money markets attach a slightly higher albeit still very low probability to an outsized cut (50 bps, 7%) by the Fed next week. US President Trump once again called for a “big” move minutes after the release. European rates left the intraday highs in sympathy and are now flat for the day. European stocks trade in the green but are underperforming US peers in the wake of the lower-than-expected PPIs. The US dollar loses some marginal ground. EUR/USD trades around 1.172, up from a 1.171 open. DXY is going nowhere close to but below 98. Oil prices are in a three-day winning streak (Brent 67$/b). Today’s move is possibly geopolitically inspired. Russian drones crossed Polish territory early this morning and were later downed by Nato-member warplanes. The military alliance discussed the incident after Poland invoked Article 4 of the treaty. Together with lower (US) bond yields, its keeping gold near record highs.
News & Views
Norwegian inflation fell by 0.6% M/M in August with the headline number accelerating as expected from 3.3% to 3.5% on an annual basis. Underlying core inflation fell less than hoped (-0.7% M/M vs -0.9% M/M) to stabilize at 3.1% Y/Y (vs 2.9% consensus). Details showed food and non-alcoholic beverages prices dropping by 1.8% M/M with furniture, household equipment and routine maintenance (-2.3% M/M) and transport (-1.5%) prices also dragging monthly prices down. Higher prices for housing, water, electricity, gas and other fuels (1.2% M/M), restaurant and hotels (+0.3% M/M) and clothing and footwear (0.3%) couldn’t make up for that. Today’s numbers create some doubt on the outcome of next week’s Norges Bank policy meeting. They lowered the key rate a first time in June (4.5% to 4.25%) with a cautious easing bias for the remainder of the year (4% policy rate by year-end). The market implied probability of a 25 bps rate cut next week fell from 82% to 68%. The NOK swap rate curve bear steepens with yields up to 6.8 bps higher at the front end (2-yr). The NOK profits with EUR/NOK (11.61) touching its lowest level since mid-June.
The Czech National Bank commented on August inflation numbers which were confirmed today at 0.1% M/M and 2.5% Y/Y which was slightly below the central bank’s own forecast (2.7%). Core inflation edged up to 2.8% Y/Y, driven by goods prices. Inflation in market services remained unchanged but elevated (4.4% Y/Y). Core inflation was affected by rising housing costs this year. In August, year-on-year growth in imputed rent remained at 4.9% for the third time in a row. The CNB expects inflation to remain close to recent values for the rest of the year. Given the still elevated inflation and its unfavourable structure, there are still reasons for a cautious monetary policy approach. CNB board member Seidler today argued in favour of keeping Czech rates unchanged for now. Vice-governor Zamrazilova did the same earlier this week. The Czech koruna today nevertheless falls prey to some profit taking with EUR/CZK bouncing off its weakest level since the end of 2023 (24.30) to 24.39.
EUR/USD Mid-Day Outlook
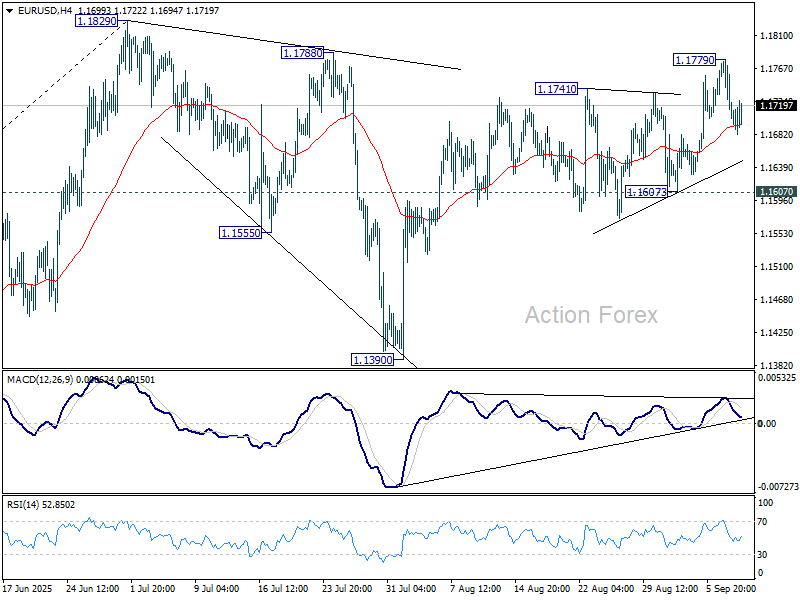
Daily Pivots: (S1) 1.1681; (P) 1.1731; (R1) 1.1757; More...
Intraday bias in EUR/USD remains neutral for consolidations below 1.1779 temporary top. Further rise is expected with 1.1607 support intact. Above 1.1779 will bring retest of 1.1829 high. Firm break there will resume larger up trend to 1.1916 projection level.
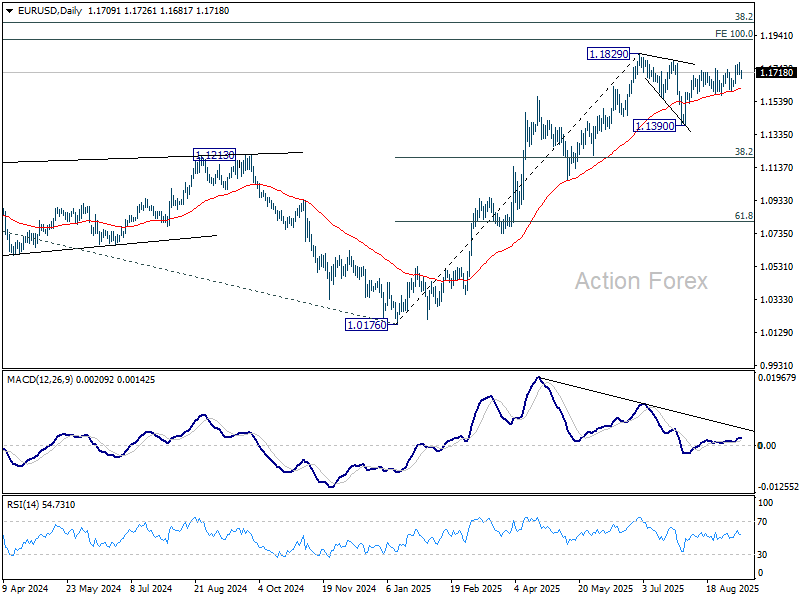
In the bigger picture, rise from 0.9534 (2022 low) long term bottom could be correcting the multi-decade downtrend or the start of a long term up trend. In either case, further rise should be seen to 100% projection of 0.9534 to 1.1274 from 1.0176 at 1.1916. This will remain the favored case as long as 1.1604 support holds.
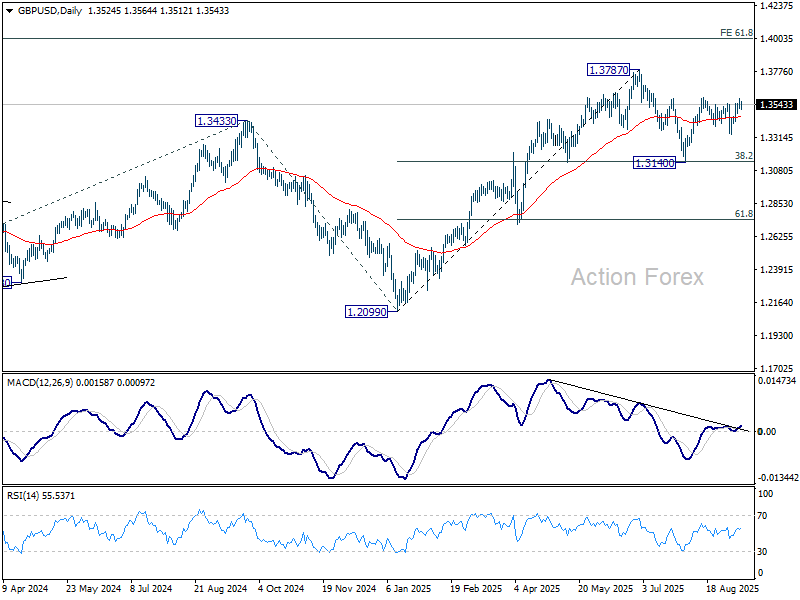
GBP/USD Mid-Day Outlook
Daily Pivots: (S1) 1.3500; (P) 1.3545; (R1) 1.3573; More...
Intraday bias in GBP/USD remains neutral and some more consolidations could be seen below 1.3590 temporary top. Further rise is expected with 1.3332 support intact. Firm break of 1.3594 will resume the rally from 1.3140 and target a retest on 1.3787 high.
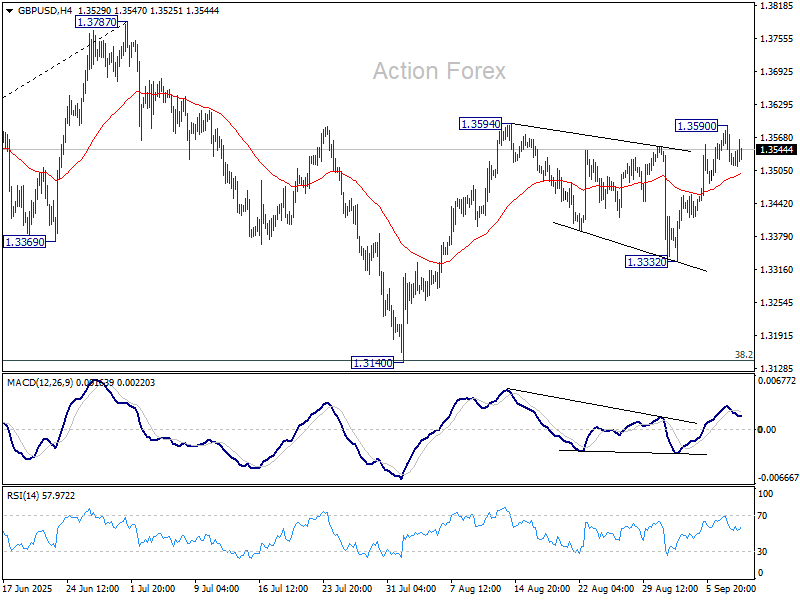
In the bigger picture, up trend from 1.3051 (2022 low) is in progress. Next medium term target is 61.8% projection of 1.0351 to 1.3433 from 1.2099 at 1.4004. Outlook will now stay bullish as long as 55 W EMA (now at 1.3132) holds, even in case of deep pullback.