
Sample Category Title
USD/CAD Daily Outlook
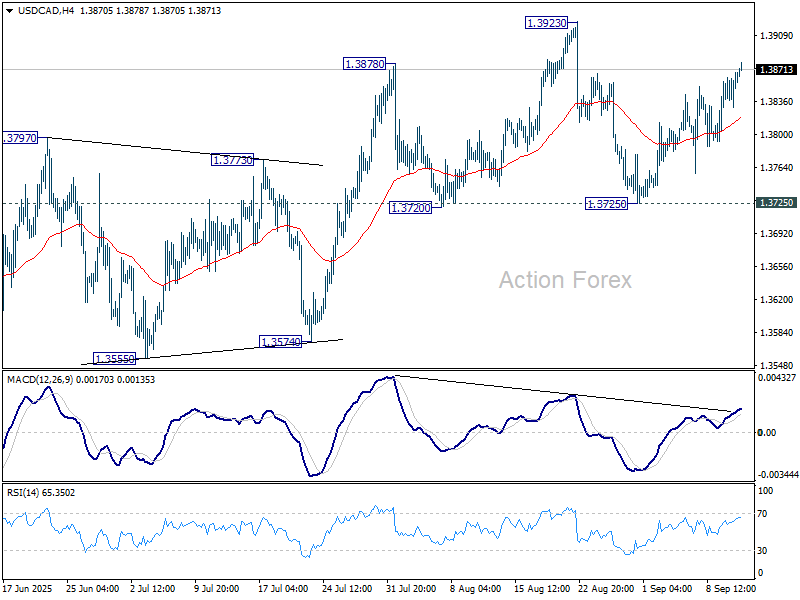
Daily Pivots: (S1) 1.3840; (P) 1.3855; (R1) 1.3879; More...
No change in USD/CAD's outlook and intraday bias stays neutral. On the upside, firm break of 1.3923 resistance will resume whole corrective rebound from 1.3538. However, sustained break of 1.3725 will argue that the rebound has completed at 1.3923, and turn near term outlook bearish.
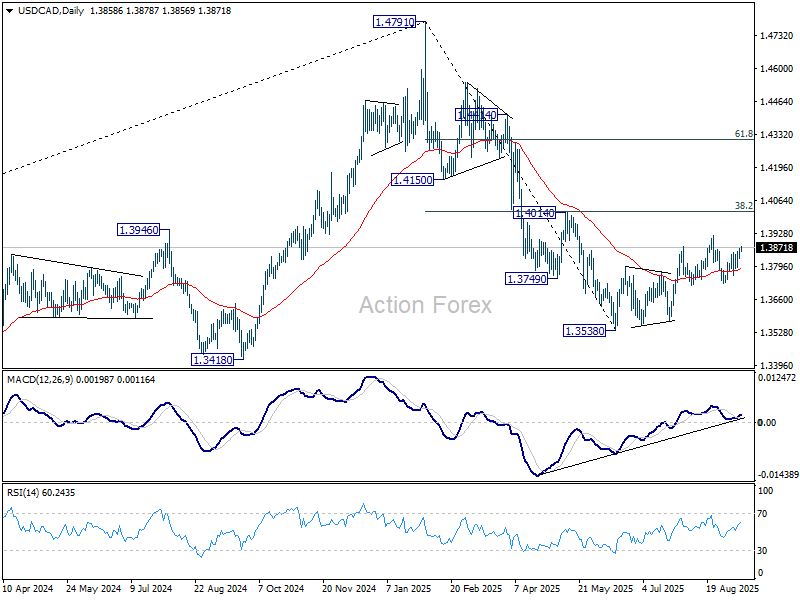
In the bigger picture, price actions from 1.4791 medium term top could either be a correction to rise from 1.2005 (2021 low), or trend reversal. In either case, further decline is expected as long as 1.4014 cluster resistance (38.2% retracement of 1.4791 to 1.3538 at 1.4017) holds. Next target is 61.8% retracement of 1.2005 (2021 low) to 1.4791 at 1.3069.
Markets Eye US CPI and ECB Rate Decision
In focus today
In the US, today's main data focus will be on the August CPI. Markets will closely follow signs of rising tariff-driven price pressures. We forecast headline CPI at 0.3% m/m SA (2.9% y/y) and core CPI at 0.3% m/m SA (+.1% y/y). It will be interesting to see if the CPI will reflect the limited cost pass-through hinted at by yesterday's downside surprise in PPI.
In the euro area, we expect the ECB to leave the deposit rate unchanged at 2.00% at today's meeting, in line with consensus and market pricing. We expect Lagarde to sound confident in the economic outlook and that the current monetary policy stance is appropriate, with staff projections likely to show little changes in the forecast for 2026-27. We expect Lagarde to be satisfied with current market pricing, aiming for a limited market reaction during the press conference. Read more in our ECB Preview - Confident in the current monetary policy stance, 5 September.
In Norway, all eyes turn to the Regional Survey from Norges Bank, which is very important in assessing the strength of the Norwegian economy. We expect that the aggregate production index will be around 0.4-0.5% for both this and the next quarter. Even more important will be the indicators for capacity utilization and labour shortages, as some of the pick-up in growth seems to be supply side driven. As the current wage statistics point to sticky wage growth, keep an eye on wage expectations as well.
In Sweden, details of the Swedish August inflation data will shed light on underlying price pressures and Riksbank pricing. The flash estimate showed core inflation at 2.9% y/y, CPIF at 3.3% y/y, and headline at 1.1% y/y. Food prices appear stable according to data from Matpriskollen, but their method differs significantly from Statistics Sweden. Riksbank governor Erik Thedéen speaks at 13:00 CEST - we welcome any comments on inflation. PES unemployment figures are also due, which showed a 7.1% unemployment rate in July, and follows weak labour market data over the summer.
Economic and market news
What happened overnight
In the trade war, Mexico announced plans to raise auto tariffs on China and other non-trade deal countries to 50%, lifting existing tariffs to the maximum allowed. Analysts see it as a response to US pressure to limit ties with China. The plan requires congressional approval.
In the US, the Trump administration has filed an appeal against the court ruling blocking the removal of Fed Governor Lisa Cook. The move aims to resolve the matter before the Fed's interest rate meeting on 16-17 September 2025.
What happened yesterday
In the US, the August producer prices for final demand ex. food and energy declined by -0.1% m/m (cons: 0.3%, prior: 0.9%). The downside surprise was driven by trade services, which also drove the upside surprise in July. Trade services PPI reflects sales margins of retailers and wholesalers, suggesting firms may have raised prices ahead of expected August tariff impacts, with margins now adjusting due to higher costs. Overall, underlying price pressures appear to have remained stable.
In geopolitics, NATO fighter jets shot down Russian drones over Polish airspace during a massive attack on Ukraine in the early morning hours. Polish PM Tusk described the incident as "a large-scale provocation" and invoked Article 4 of NATO's treaty, which allows member states to demand consultations with allies. While Moscow denied responsibility, NATO leaders strongly condemned the incursion. The incident suggests that Russia is testing the limits and NATO's intervention threshold. European leaders have now joined the US in calling for heightened sanctions on Russia, including targeting shadow fleet tankers.
In Norway, August core inflation came in at 3.1% y/y (cons: 2.8-3.1%, Danske: 2.8%, prior: 3.12%), in line with Norges Bank's (NB) forecast. However, factoring in the summer childcare subsidy, the "real" NB estimate was closer to 2.8-2.9%. Headline inflation came in at 3.5% y/y - a topside surprise to NB's "real" forecast of 3.2-3.3%. Imported prices, domestic goods, and food showed disinflation, while higher transportation costs drove up services ex. rent.
In Sweden, the latest economic data batch came in better than expected. The GDP indicator showed growth of 2.0% y/y, with June's indicator revised up from 1% y/y to 2.7% y/y. However, as the GDP indicator is volatile and has limited reliability, it should be interpreted with caution. More notably, the consumption indicator, considered a more reliable measure, remained robust at 2.4% y/y, with an upward revision for June to 2.6% from 2.4% y/y. The PVI and services production came in strong, although industrial orders and the construction sector showed relative weakness.
In Denmark, CPI declined to 2.0% y/y in August from 2.3% y/y, as we had also expected. The primary driver was a significant m/m decline in electricity prices, coupled with a strong base effect. Food prices declined 1.1% m/m, a modest decline following surging prices over the summer, indicating that the upward pressure on food prices persists. Aside from that, underlying price pressures remain muted in the Danish economy.
Equities: Equities continued higher yesterday, with US indices driving the move while European markets underperformed. Under the surface, sector rotation was significant, partly earnings-driven but also linked to the softer PPI print. Cyclicals and defensives both saw notable swings with consumer sectors underperforming, yet despite this rotation, momentum factors still outperformed while value lagged - leaving the broader investment narrative intact. In the US yesterday, Dow -0.5%, S&P 500 +0.3%, Nasdaq +0.03%, Russell 2000 -0.2%. Overnight, Asian equities traded higher, and both US and European futures are pointing up.
FI and FX: US yields moved lower yesterday reversing the move higher from Tuesday. The catalysts behind the move lower were a downside surprise in US PPI and a strong UST auction. In FX markets the PLN was the clear underperformer yesterday following heightened geopolitical tensions with Russian drones entering Polish airspace. The NOK on the other hand, did well boosted by higher oil prices and a topside surprise in Norwegian inflation. Nether the GBP nor the USD did much vs the EUR.
AUD/USD Daily Report
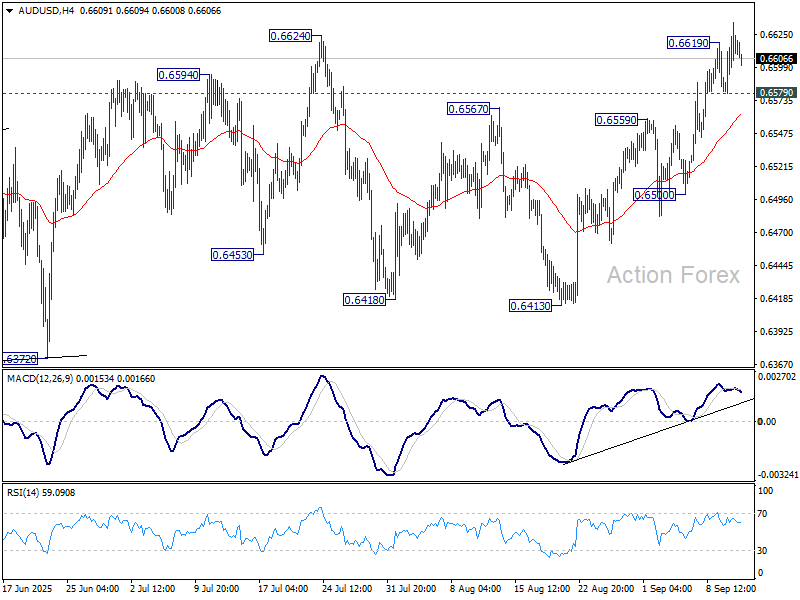
Daily Pivots: (S1) 0.6583; (P) 0.6610; (R1) 0.6639; More...
AUD/USD's rally resumed after brief consolidations and intraday bias is back on the upside. The break of 0.6624 resistance indicates that larger rally from 0.5913 is resuming. Further rise should be seen to 0.6713 fibonacci level. On the downside, through, below 0.6579 minor support will turn intraday bias neutral again.
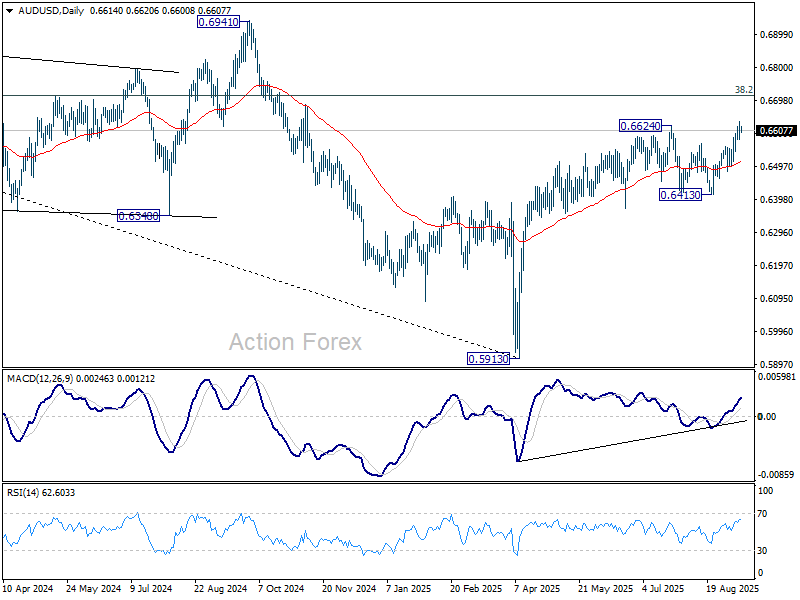
In the bigger picture, there is no clear sign that down trend from 0.8006 (2021 high) has completed. Rebound from 0.5913 is seen as a corrective move. While stronger rally cannot be ruled out, outlook will remain bearish as long as 38.2% retracement of 0.8006 to 0.5913 at 0.6713 holds. Nevertheless, considering bullish convergence condition in W MACD, even in case of another fall through 0.5913, downside should be contained above 0.5506 (2020 low).
ECB Hold Expected, U.S. CPI Could Move Everything
Asian markets were mixed in quiet trade today, with investors holding back ahead of two key events: the ECB policy meeting and U.S. CPI. The lack of conviction reflects a cautious stance, with traders unwilling to take on fresh positions before clarity emerges.
The ECB decision is much less likely to spark volatility, with a steady 2.00% deposit rate firmly priced in. While President Christine Lagarde is not expected to offer firm forward guidance, attention will fall on her tone and the updated projections for clues on whether policymakers view the easing cycle as complete.
By contrast, U.S. CPI carries far greater potential to shake markets, and the risk skew appears asymmetric: a downside surprise could trigger a sharper reaction than an upside print. Any softer-than-expected CPI outcome could extend the dovish repricing on Fed that's already underway, and quicken the slide in yields and Dollar.
In weekly performance, Aussie remains the strongest G10 currency, followed by Kiwi and Sterling. Loonie is the weakest, trailed by Euro and Swiss Franc, while Dollar and Yen are holding in the middle of the field.
In Asia, at the time of writing, Nikkei is up 0.90%. Hong Kong HSI is down -0.35%. China Shanghai SSE is up 1.04%. Singapore Strait Times is up 0.07%. Japan 10-year JGB yield is up 0.013 at 1.581. Overnight, DOW fell -0.48%. S&P 50 rose 0.30%. NASDAQ rose 0.03%. 10-year yield fell -0.042 to 4.032.
EUR/USD awaits twin catalysts: ECB pause, U.S. CPI test
EUR/USD is holding near its highest levels since 2021 as traders await two pivotal events today: ECB policy decision and U.S. CPI data.
The ECB is set to hold its deposit rate at 2.00%, marking a second consecutive pause. Investors will be listening closely for any hint from President Christine Lagarde that policymakers are ready to park rates for the long haul.
The U.S.-EU trade agreement, which capped tariffs at 15%, has given the central bank more breathing space. If updated projections show limited fallout from tariffs and the Governing Council signals satisfaction with the current stance, Euro could draw support from the perception that the easing cycle is finished.
On the U.S. side, August CPI is expected to show headline inflation rising to 2.9% from 2.7%, with core CPI steady at 3.1%. The report is the final major data input before next week’s FOMC, where markets see a 25bps cut as the base case.
Political noise around the Fed has grown louder. After weaker-than-expected PPI figures yesterday, US President Donald Trump again lashed out at Chair Jerome Powell, calling him a “total disaster” and demanding immediate deep cuts.
Markets currently expect a series of back-to-back 25bps cuts in September, October, and December, bringing rates down to 3.50–3.75% by year-end. A downside surprise in CPI would reinforce that view and might even revive discussion of a larger move in September.
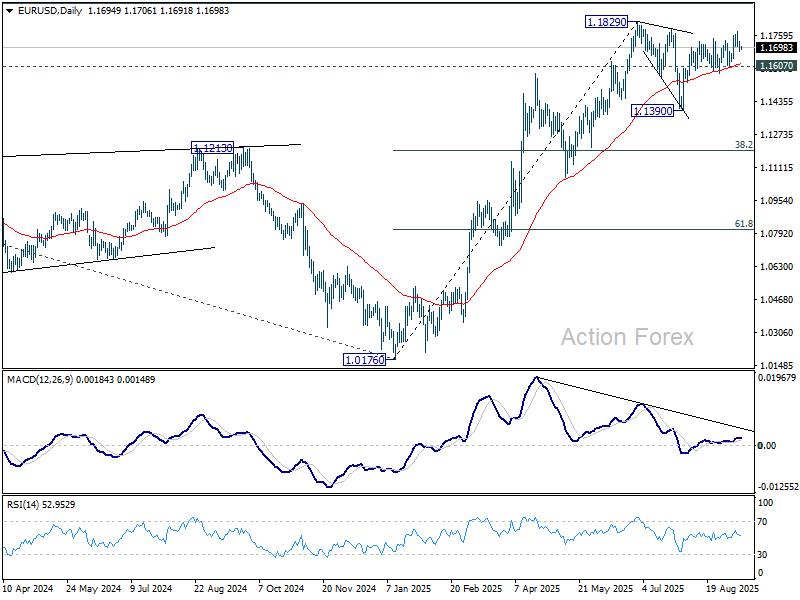
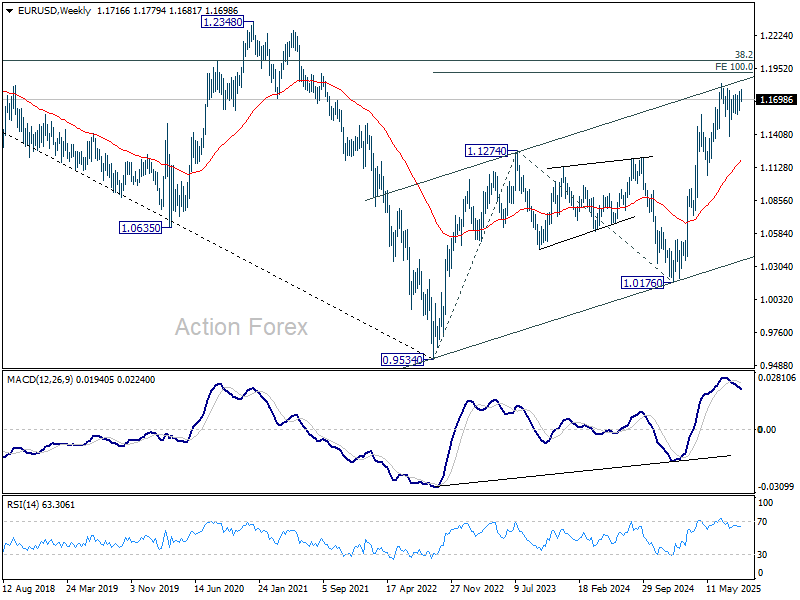
Technically, for EUR/USD, further rise is expected as long as 1.1607 support holds. Firm break of 1.1829 will resume larger up trend to 100% projection of 0.9534 to 1.1274 from 1.0176 at 1.1916. Then EUR/USD will face the real test at 1.2 psychological level.
Meanwhile, break of 1.1607 will delay the bullish case, and extend the corrective pattern from 1.1829 with another dip back towards 1.1390 support in the near term.
Japan CGPI accelerates to 2.7% yoy, import price declines ease
Japan’s producer prices rose modestly in August, with CGPI climbing 2.7% yoy from 2.5% yoy in July, matching market forecasts. The pickup was driven mainly by food and beverage costs, which rose 5.0% yoy versus 4.7% yoy previously. In contrast, utility bills fell -2.9% yoy due to government subsidies, softening the overall inflation impact.
Import price declines eased significantly in the past two months, with yen-based import prices down -3.9% yoy compared with a revised -10.3% fall in July. The data suggest external cost pressures are stabilizing, even as domestic food inflation remains sticky.
RBNZ’s Hawkesby: OCR seen at 2.5% by year-end, data dependent
RBNZ Governor Christian Hawkesby said today the central bank still projects the Official Cash Rate to fall to around 2.50% by year-end, down from current 3.00%. Though, the pace could be "faster or slower" depending on incoming data. He emphasized that the path of policy easing will hinge on the "speed of New Zealand’s economic recovery".
Hawkesby noted the August Monetary Policy Statement highlighted the sharp blow to household and business confidence, with the economy stalling mid-year and creating more slack. He attributed much of the “confidence shock” to uncertainty over U.S. tariff policies, compounded by cost-of-living pressures and a weak housing market.
Still, leading indicators for July were “better” and aligned with the RBNZ’s outlook for a rebound in the second half of the year. Hawkesby said policymakers will keep monitoring spillovers from U.S. tariffs on both global growth and New Zealand firms. The RBNZ resumed rate cuts last month after a July pause.
AUD/USD Daily Report
Daily Pivots: (S1) 0.6583; (P) 0.6610; (R1) 0.6639; More...
AUD/USD's rally resumed after brief consolidations and intraday bias is back on the upside. The break of 0.6624 resistance indicates that larger rally from 0.5913 is resuming. Further rise should be seen to 0.6713 fibonacci level. On the downside, through, below 0.6579 minor support will turn intraday bias neutral again.
In the bigger picture, there is no clear sign that down trend from 0.8006 (2021 high) has completed. Rebound from 0.5913 is seen as a corrective move. While stronger rally cannot be ruled out, outlook will remain bearish as long as 38.2% retracement of 0.8006 to 0.5913 at 0.6713 holds. Nevertheless, considering bullish convergence condition in W MACD, even in case of another fall through 0.5913, downside should be contained above 0.5506 (2020 low).
Markets Calm Before US CPI
Sentiment across financial markets is broadly bullish after yesterday’s US PPI update suggested a notable drop in input price inflation in August. Both headline and core PPI unexpectedly fell last month, pulling the annual figures down to 2.6% for the headline and 2.8% for the core. Though still sticky near 3%, these figures do not disrupt dovish Federal Reserve (Fed) expectations — nor do they strengthen them. US 2-year yields slipped slightly, while the S&P 500 hit a fresh record before giving back gains.
On the equity front, Oracle stood out with a 35% rally after quarterly results impressed thanks to a reported $300bn deal with OpenAI. Nvidia added 3.85% after TSMC posted its second-best month of sales in August, while CoreWeave jumped nearly 17%. AI-related stocks continue to deliver strong results and fuel the rally, but not all are thriving and risks remain. Synopsys fell 35% yesterday, a reminder that the trade war remains a major threat and that Trump’s tariff rhetoric is never far away.
Lower rate prospects are an extra tailwind for tech stocks. Growth company valuations rely heavily on discounting future revenues, and lower rates mean a lower discount factor — and higher valuations. With that math in mind, the S&P 500 and Nasdaq are waiting for today’s CPI update near record highs, poised to break higher. Many bank analysts are revising their S&P 500 targets upward, some now looking toward 7’000 between this year and next. Signs of stress remain limited, with the VIX index still subdued.
All eyes now turn to today’s CPI report. Headline inflation is expected to tick up to 2.9% from 2.7% a month earlier, while core inflation is seen holding sticky at 3.1% year-on-year. A softer-than-expected set of numbers could fuel bets of a jumbo Fed cut next week to support a weakening jobs market, while stronger-than-expected figures would strengthen the case for the Fed to start with a 25bp cut and follow with two more. In that case, we could see consolidation in 2-year yields and the dollar, and only limited incremental appetite for equities. Option markets imply a 0.7% swing in the S&P 500 on today’s CPI outcome — smaller than the typical 0.9% move for a CPI release and below the move expected for the next jobs report. This suggests investors are assigning more weight to jobs data than inflation, expecting the Fed to prioritize a weakening labour market over tariff-driven price pressures (that haven’t materialized yet).
In FX, the dollar is flat this morning, still below its 50-day moving average, while the EUR/USD consolidates below 1.17 after yesterday’s drop — partly on French political turmoil and a widening 10-year yield spread between French and German bonds. The European Central Bank (ECB) meets today and is widely expected to leave rates unchanged near 2% and reiterate its data-dependent stance. With greater tariff clarity, stronger-than-expected growth and recent upside inflation surprises, the odds of another ECB cut are roughly 50-50. The divergence between slightly more hawkish ECB expectations and a softer Fed outlook supports EURUSD bulls, but widening French–German spreads could limit upside ahead of a closely watched Fitch rating update on France.
Speaking of France, the country was effectively brought to a halt yesterday as people protested against Macron, the divided government, and the budget impasse. Politicians are taking turns proposing their own budget fixes — none likely to pass. Yet, looking at the CAC 40, you’d hardly notice.
The war in Ukraine took an uglier turn after Russia fired drones into Poland this week — an act Warsaw believes was a deliberate test of NATO’s response. Poland shot down the drones, becoming the first NATO country to fire in the Ukraine war, and European capitals are now weighing heavier sanctions against Russia. Oil rallied 1.5% yesterday, but a near 4m-barrel build in US inventories limit gains. Bears point to slowing economies and rising OPEC supply, while bulls focus on a softer dollar and rising geopolitical risks. Support is seen near $62pb, with resistance around $65pb — a key Fibonacci level bracketed by the 50- and 100-DMAs.
Elliott Wave Analysis: USDJPY Zigzag Correction Likely to Fail Below 149
The short-term Elliott Wave analysis for USDJPY indicates that the decline from the August 1, 2025, high is developing as a double three Elliott Wave structure. From that peak, wave ((w)) concluded at 146.2. The subsequent wave ((x)) rally formed another double three pattern at a lesser degree. Starting from wave ((w)), wave (w) reached 148.77, followed by a dip in wave (x) to 146.56. Wave (y) then climbed to 149.1, completing wave ((x)) at a higher degree.
Currently, USDJPY has turned downward in wave ((y)). However, it must break below the wave ((w)) low at 146.2 to eliminate the possibility of a double correction in wave ((x)). The internal structure of wave ((y)) is unfolding as a zigzag Elliott Wave pattern. From the wave ((x)) high, wave (a) ended at 146.3. Wave (b) is now rallying to correct the cycle from the September 3, 2025, high before resuming its downward trajectory. In the near term, as long as the pivot at 149.1 holds, expect any rally to falter in a 3, 7, or 11 swing, leading to further declines. The potential target for wave ((y)) lower lies within the 100%–161.8% Fibonacci extension of wave ((w)), projecting a range of 141.5–144.4.
USDJPY – 60 Minute Elliott Wave Technical Chart:

USDJPY – Elliott Wave Technical Video:
https://www.youtube.com/watch?v=8HGgeQGCLt4
EUR/USD awaits twin catalysts: ECB pause, U.S. CPI test
EUR/USD is holding near its highest levels since 2021 as traders await two pivotal events today: ECB policy decision and U.S. CPI data.
The ECB is set to hold its deposit rate at 2.00%, marking a second consecutive pause. Investors will be listening closely for any hint from President Christine Lagarde that policymakers are ready to park rates for the long haul.
The U.S.-EU trade agreement, which capped tariffs at 15%, has given the central bank more breathing space. If updated projections show limited fallout from tariffs and the Governing Council signals satisfaction with the current stance, Euro could draw support from the perception that the easing cycle is finished.
On the U.S. side, August CPI is expected to show headline inflation rising to 2.9% from 2.7%, with core CPI steady at 3.1%. The report is the final major data input before next week’s FOMC, where markets see a 25bps cut as the base case.
Political noise around the Fed has grown louder. After weaker-than-expected PPI figures yesterday, US President Donald Trump again lashed out at Chair Jerome Powell, calling him a “total disaster” and demanding immediate deep cuts.
Markets currently expect a series of back-to-back 25bps cuts in September, October, and December, bringing rates down to 3.50–3.75% by year-end. A downside surprise in CPI would reinforce that view and might even revive discussion of a larger move in September.
Technically, for EUR/USD, further rise is expected as long as 1.1607 support holds. Firm break of 1.1829 will resume larger up trend to 100% projection of 0.9534 to 1.1274 from 1.0176 at 1.1916. Then EUR/USD will face the real test at 1.2 psychological level.
Meanwhile, break of 1.1607 will delay the bullish case, and extend the corrective pattern from 1.1829 with another dip back towards 1.1390 support in the near term.
Bitcoin Recovery In Play, Can Bulls Push for a Fresh Surge?
Key Highlights
- Bitcoin started a recovery wave above $112,000 and $113,000.
- BTC/USD is now following a rising channel with resistance at $115,500 on the 4-hour chart.
- Ethereum is showing signs of a fresh increase and is stable above $4,300.
- XRP price is up over 5% and might soon attempt to clear $3.120.
Bitcoin Price Technical Analysis
Bitcoin price found support near $107,250 against the US Dollar. BTC started a recovery wave and climbed above the $112,000 resistance.
Looking at the 4-hour chart, the price was able to settle above the $112,000 level and the 100 simple moving average (red, 4-hour). There was a move above the 50% Fib retracement level of the downward move from the $117,407 swing high to the $107,234 low.

On the upside, the price now faces resistance near the $115,000 level and the 76.4% Fib retracement. The next key resistance is $115,500. There is also a rising channel forming with resistance at $115,500.
The main hurdle is now forming near $116,000. A successful close above $116,000 might start another steady increase. In the stated case, the price may perhaps rise toward the $118,000 level. Any more gains might call for a test of $120,000.
Immediate support is $112,500. A downside break below $112,500 might send BTC toward the $118,800 support. Any more losses might send the price toward the $110,000 support zone.
Looking at Ethereum, the price seems to be forming a base above $4,300 and might soon aim for a move above $4,600.
Today’s Key Economic Releases
- US Consumer Price Index for August 2025 (MoM) – Forecast +0.3%, versus +0.2% previous.
- US Consumer Price Index for August 2025 (YoY) – Forecast +2.9%, versus +2.7% previous.
- US Initial Jobless Claims - Forecast 235K, versus 237K previous.
Japan CGPI accelerates to 2.7% yoy, import price declines ease
Japan’s producer prices rose modestly in August, with CGPI climbing 2.7% yoy from 2.5% yoy in July, matching market forecasts. The pickup was driven mainly by food and beverage costs, which rose 5.0% yoy versus 4.7% yoy previously. In contrast, utility bills fell -2.9% yoy due to government subsidies, softening the overall inflation impact.
Import price declines eased significantly in the past two months, with yen-based import prices down -3.9% yoy compared with a revised -10.3% fall in July. The data suggest external cost pressures are stabilizing, even as domestic food inflation remains sticky.
RBNZ’s Hawkesby: OCR seen at 2.5% by year-end, data dependent
RBNZ Governor Christian Hawkesby said today the central bank still projects the Official Cash Rate to fall to around 2.50% by year-end, down from current 3.00%. Though, the pace could be "faster or slower" depending on incoming data. He emphasized that the path of policy easing will hinge on the "speed of New Zealand’s economic recovery".
Hawkesby noted the August Monetary Policy Statement highlighted the sharp blow to household and business confidence, with the economy stalling mid-year and creating more slack. He attributed much of the “confidence shock” to uncertainty over U.S. tariff policies, compounded by cost-of-living pressures and a weak housing market.
Still, leading indicators for July were “better” and aligned with the RBNZ’s outlook for a rebound in the second half of the year. Hawkesby said policymakers will keep monitoring spillovers from U.S. tariffs on both global growth and New Zealand firms. The RBNZ resumed rate cuts last month after a July pause.