
Sample Category Title
NZ BNZ manufacturing slips to 49.9, sector weakness persists, optimism patchy
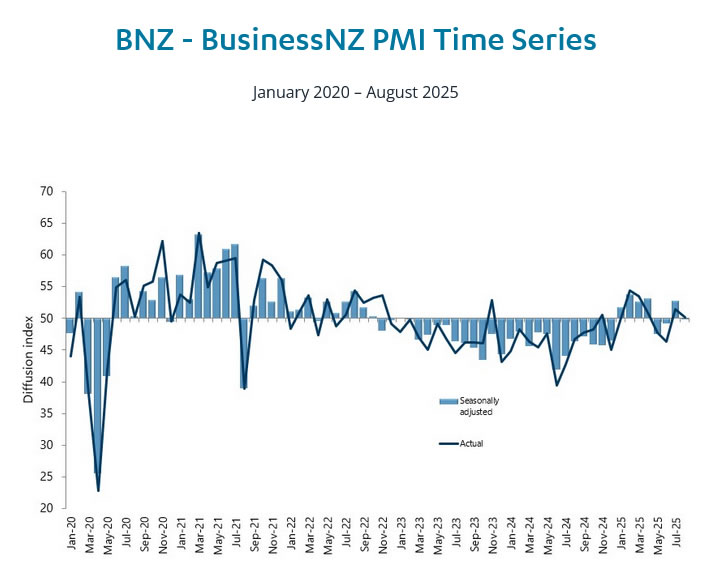
The latest BusinessNZ PMI showed New Zealand’s manufacturing sector stalling in August, with the index slipping to 49.9 from 52.8. BusinessNZ’s Catherine Beard noted the industry “has yet to turn the corner toward sustained growth,” with the reading underscoring patchy conditions and fragile confidence despite being only marginally below the neutral threshold.
The breakdown highlighted a mixed picture. New Orders rose strongly to 55.2, the highest in two years, hinting at improving demand momentum, while raw material deliveries remained in expansion at 50.5. Offsetting this, production fell to 46.6, while employment (49.1) and finished stocks (47.1) also contracted, dragging the overall index lower.
Nearly six in ten respondents offered negative comments, citing flat sales, customer caution, rising costs, and global uncertainty as key drags. Although the proportion of negative feedback has eased from June’s high, sentiment remains weak, and businesses see recovery as tentative at best.
Cliff Notes: Participants Look Through Inflation and Hope for Support
Key insights from the week that was.
After coming tantalisingly close to the optimist / pessimist threshold last month, Westpac-MI Consumer Sentiment shed 3.1% in September to 95.4, a level consistent with a degree of economic unease. Results were mixed across the components. On the positive side, views on family finances – both the current assessment and year-ahead expectations – rose to the highest level in over 3½ years, providing another clear sign of reduced cost-of-living pressures. However, the one-year and five-year economic outlooks both deteriorated, down –8.9% and –5.9% respectively, although both sub-indexes are still slightly above average. The same cannot be said for ‘time to buy a major household item’ which fell 3.4% to be 21% below its long-run average.
Against the backdrop of last week’s National Accounts – which showcased a consumer-led bounce in economic activity into mid-year – this latest sentiment reading casts some doubt over the sustainability of the acceleration in household spending growth. We know at least part of the mid-year lift was due to abnormal seasonality and end-of-year sales events. Recent card activity data meanwhile points to a more gradual recovery, in line with a steady lift in GDP growth to 1.9%yr by year-end and towards trend in 2026. Our forecasts for Australia and the world are discussed in detail in our latest edition of Market Outlook, due for release today on Westpac IQ.
Before moving offshore, a final note on businesses. The latest NAB business survey reported a mixed batch of results in August: conditions up 2pts to +7 while confidence retreated 3pts to +4. On balance, the headline outcomes remain broadly consistent with the gradual recovery in growth suggested above and are corroborated by the survey detail for profitability and trading conditions. The lift in the often-volatile capex sub-component is also an encouraging leading signal for business investment, though a firming of confidence is likely necessary before a more meaningful acceleration can be seen.
Outside of Australia, market participants have this week remained focused on the debate over the health of the US labour market. August’s nonfarm payrolls print was another weak outcome, with just 22k new jobs reported in the month and the June / July estimates reduced by 21k, leaving the 3-month average broadly unchanged at 29k. While well below the 168k average gain of 2024 (excluding the just released annual revision; see below), as population growth has slowed abruptly in 2025 the current pace is only at the bottom of the St Louis Fed’s most recent breakeven range for employment (32k-82k new jobs needed per month to balance labour demand and supply). The unemployment rate edging up from 4.2% to 4.3% in August with a 0.1ppt increase in participation also points to job creation stalling versus a material contraction.
That said, the 911k downward revision to the level of nonfarm payrolls at March 2025, which implies monthly job creation over the prior year was half the initial estimate, raises the risk that current employment is also materially weaker than the published data suggests. In real time though, we are unable to gauge to what degree. Meanwhile, US inflation remains stuck well above target.
Headline consumer prices rose 0.4% in August, lifting annual inflation to 2.9%. The rate of core inflation instead held at 3.1%yr, or 3.6% on an annualised basis. Within the detail was further evidence of the slow passthrough of tariffs, core goods inflation printing at 1.1% on a 6-month annualised basis compared to 0% at the turn of the year, or around 3% annualised if only the last three months are focused on. As a result of capacity constraints, services inflation also showed strength, services prices ex-energy rising 3.6% over the year and 2.9% on a 6-month annualised basis.
Looking ahead, both goods and services inflation are likely to hold up. Regarding the continued passthrough of tariffs, while the PPI surprised to the downside, this looks to be due to the margins of wholesalers and retailers partially absorbing the initial impact of tariffs. US businesses cannot wear this cost indefinitely, particularly as the burden accumulates – the US effective tariff rate doubled in August.
Next week the FOMC will adjudicate once again on the stance of monetary policy. A 25bp rate cut is widely expected, but more important will be any change to their economic forecasts and guidance on risks. Market participants clearly desire the FOMC to look through current above-target inflation and protect against downside risks for employment and activity. But views expressed ahead of the meeting from members imply a greater degree of concern over inflation’s path back to target – a view which we believe is justified, as discussed in our September Westpac Market Outlook.
Continuing with monetary policy, as expected the ECB Governing Council left the stance of monetary policy unchanged at its September meeting. The decision was based on economic projections which are largely unchanged from June. Economic growth in 2025 was revised higher to 1.2%, but the 2026 figure was nudged lower to 1.0%, a touch below our and consensus’ forecasts, and growth in 2027 was left unchanged at 1.3%. HICP inflation is now expected to be 0.1ppt higher in 2025 and 2026, at 2.1%yr and 1.7%yr respectively. But, instead of returning to 2% in 2027, inflation now stays just below target at 1.9%.
In the press conference, President Lagarde celebrated the resilience of the euro area economy in the first half of 2025. She also noted the risks to growth have become more balanced, largely due to the EU-US trade agreement. On the inflation front, Lagarde discounted the importance of below-target inflation in 2027 and continued to emphasize that the euro area economy is in a good place. Having retained their forward guidance – “we will follow a data-dependent and meeting-by-meeting approach to determining the appropriate monetary policy stance” – she emphasised in the press conference that ECB policy is not on a pre-determined path, with the Governing Council prepared to act as necessary to keep the economy on track. Even a small additional disinflationary impulse is likely to lead to additional easing, albeit just one more cut to the bottom of the ECB’s estimate of the neutral range.
USD/JPY Rejected Again – Will Key Support Hold or Break?
Key Highlights
- USD/JPY struggled to continue higher above 148.20 and reacted to the downside.
- A key bearish trend line is forming with resistance at 148.00 on the 4-hour chart.
- Bitcoin recovered some losses and climbed above $115,000.
- AUD/USD extended gains and traded above the 0.6620 resistance.
USD/JPY Technical Analysis
The US Dollar attempted a fresh increase above 148.00 against the Japanese Yen. However, USD/JPY failed near 148.00 and trimmed some gains.
Looking at the 4-hour chart, the pair faced rejection and declined below 148.00. There was a move below the 50% Fib retracement level of the upward move from the 146.30 swing low to the 148.16 high. The pair is now back below the 100 simple moving average (red, 4-hour) and the 200 simple moving average (green, 4-hour).
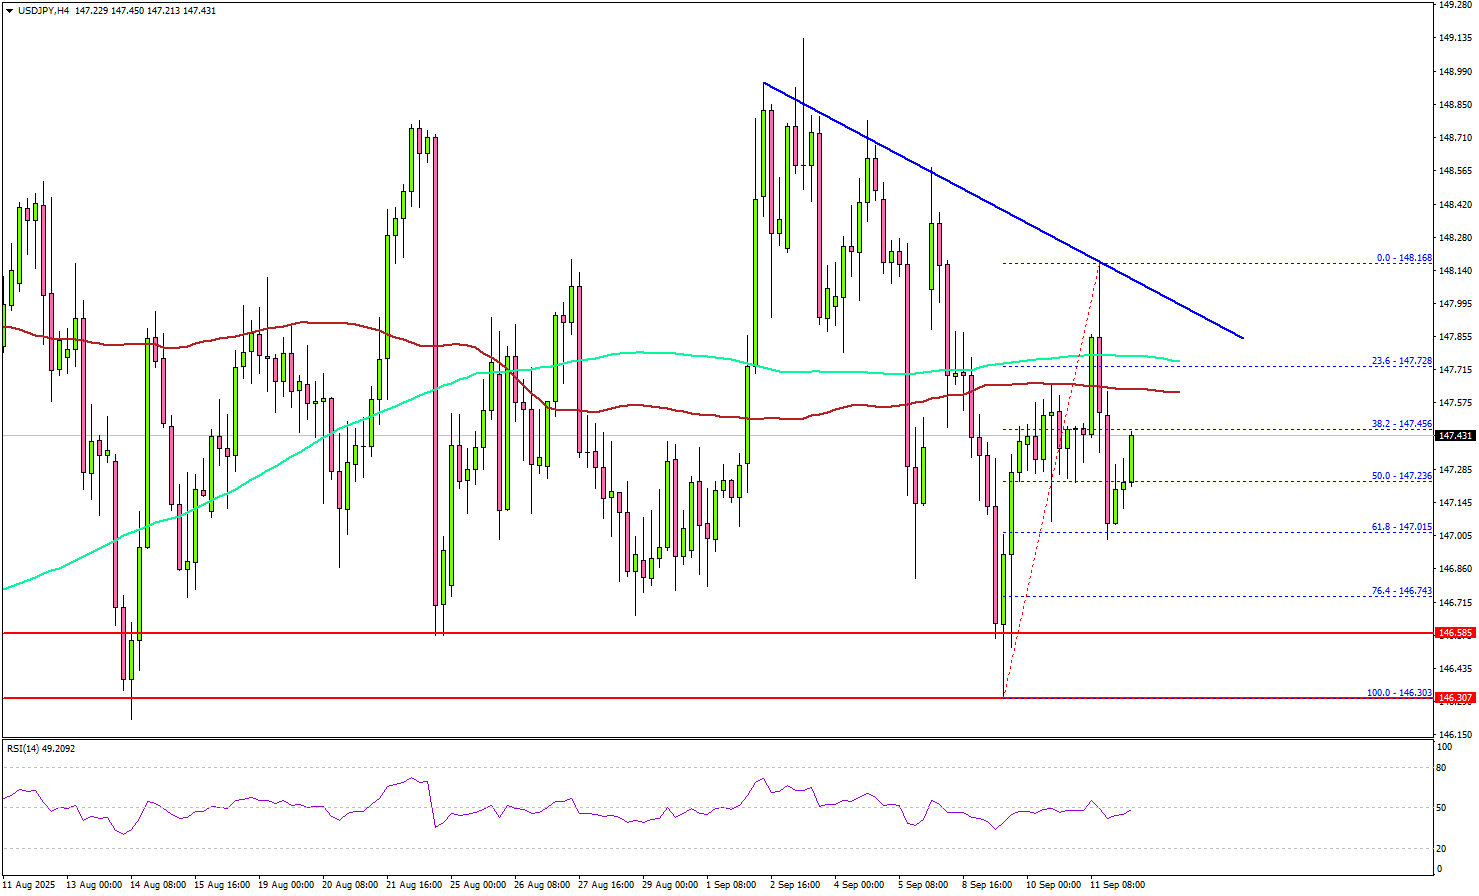
On the downside, immediate support is 147.00. The next key area of interest might be near the 76.4% Fib retracement level at 146.75. Any more losses could send the pair toward 146.20.
On the upside, the pair could face resistance near the 148.00 level. There is also a key bearish trend line forming with resistance at 148.00. The first major hurdle for the bulls could be 148.20. A close above 148.20 could set the pace for another increase.
In the stated case, the pair could rise toward 148.50, above which the bulls could aim for a move toward 149.20. Any more upsides could send the pair toward 150.00.
Looking at Bitcoin, the bulls came into action and they were able to push the price above the $115,000 resistance zone.
Upcoming Key Economic Events:
- UK GDP for July 2025 (MoM) - Forecast 0%, versus +0.4% previous.
- Michigan Consumer Sentiment Index for Sep 2025 (Prelim) – Forecast 58.0, versus 58.2 previous.
GBP/USD Rallies Ahead of UK GDP. Will Multi-Week Resistance Hold?
GBPUSD rallied after US CPI data all but confirmed a rate cut next week. At least that is the view of market participants who actually priced in as much as 75 bps of cuts through December 2025, according to futures pricing.
US data had been the talking point heading into the week, and now with CPI and PPI behind us focus may begin to turn to UK GDP data due out tomorrow.
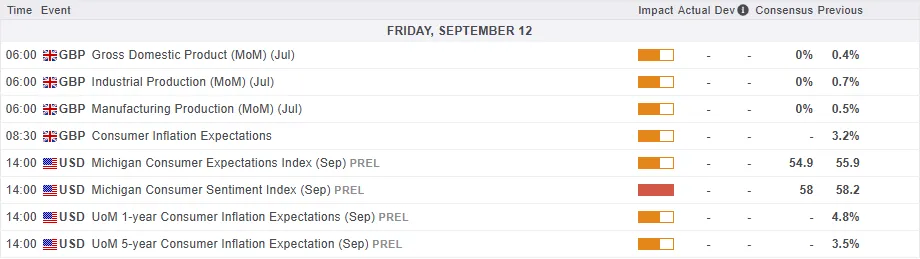
For all market-moving economic releases and events, see the MarketPulse Economic Calendar. (click to enlarge)
UK Economy and GDP Data
The UK economy is at a critical point. A new report on the country's Gross Domestic Product (GDP) is expected to reveal more about its health.
Experts predict that the UK's economy didn't grow at all in July after a surprisingly strong 0.4% increase in June. While the economy grew by 0.3% in the second quarter of the year, this was slower than the 0.7% growth in the first quarter. One reason for the earlier growth was that businesses were preparing for new US taxes and tariffs, an effect that is not expected to continue.
The UK economy appears to be stuck in a "low-growth trap," meaning it's growing very slowly. Although the forecast for growth in 2025 has been slightly increased from 1.1% to 1.3%, this is still considered very weak.
In response to the economic situation, the Bank of England (BoE) recently lowered its main interest rate to 4%. However, it plans to make only two more small cuts by the end of 2026. This cautious approach is because the BoE is still worried about inflation, which is the rate at which prices are rising. They expect inflation to reach a high of 3.7% this year.
If the upcoming GDP numbers are surprisingly strong, this cautious approach by the BoE could actually make the British Pound stronger against other currencies.
Now the consequences of this may come in the form of rate differentials in the months ahead. If the BoE decides to stop cutting rates and the Fed starts with rate cuts, this could leave GBPUSD poised to rise even further.
Technical Analysis - GBP/USD
From a technical point of view, GBP/USD rallied today and ran into a key resistance level which has held firm over the last month.
The resistance level at 1.3584 has been tested two or three times over the past month but has thus far held firm.
Today's hammer candlestick close hints at further upside. Immediate resistance rests at 1.3680 before the YTD high at 1.3788 comes into focus.
Looking at the possibility of a move lower, immediate support rests at the 1.3500 handle before the 1.3378 handle becomes an area of focus.
GBP/USD Daily Chart, September 12, 2025
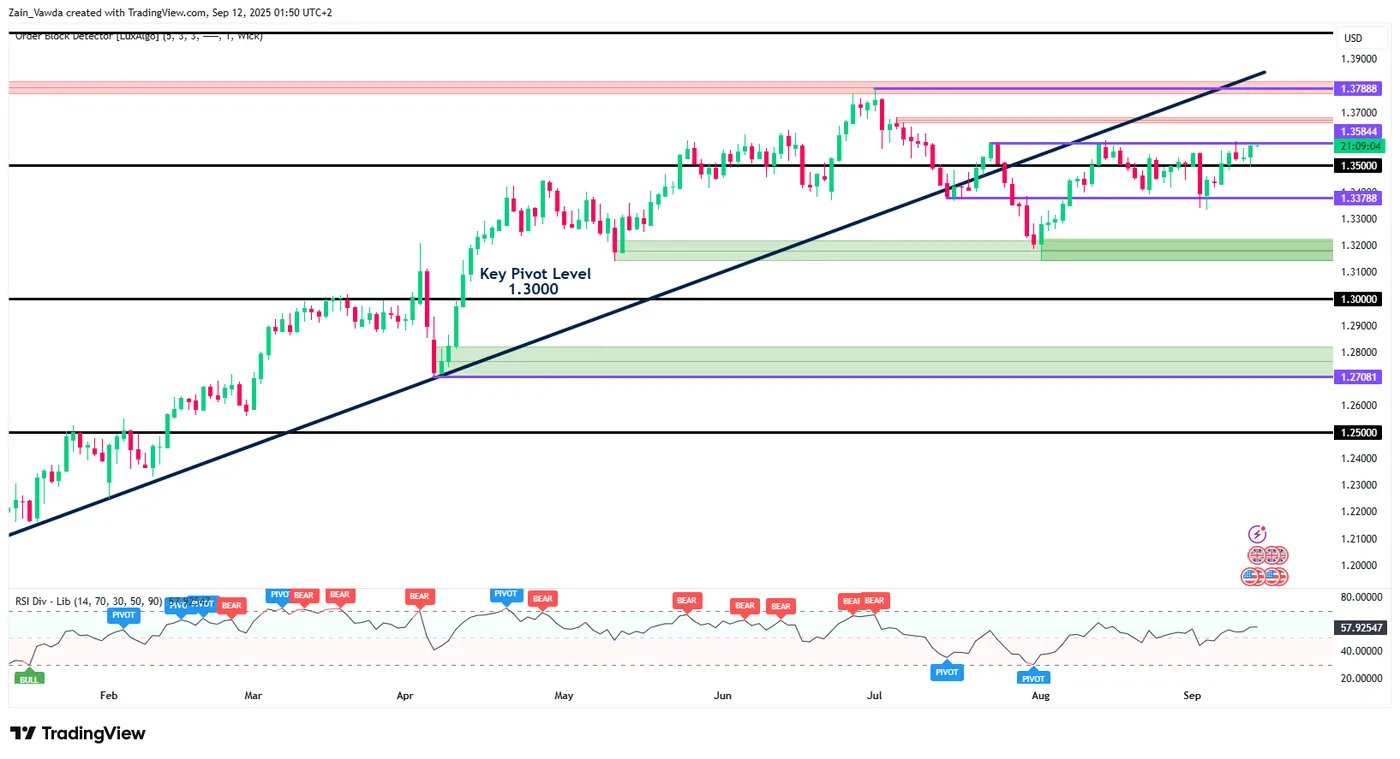
Source:TradingView
Ethereum Tries to Gather Momentum After CPI Report
US equities surged again after the CPI release, with all major indices — S&P 500, Nasdaq, and Dow Jones — notching fresh all-time highs.
The US dollar has been struggling with rate markets are now progressively betting ofn a 50 bps FOMC cut, though expectations remain fluid.
Indeed, the immediate post-CPI reactions took some of that pricing back, before re-upping the odds just above 10%.
Players will now expect hints from journalists such as Wall Street Journal's Timiraos, the usual suspect for pre-FOMC FED insights.
However, cryptocurrencies are lagging this risk-on rally.
While Bitcoin rebounded since its past week $108,000 lows, Ethereum is still trying to regain upside momentum.
The broader altcoin and crypto complex has yet to reflect the same strength seen in equities and other risk assets since the morning session.
With traders now turning to next week’s FOMC decision, crypto markets await a progressing technical outlook.
Let's peak at the current Crypto Market picture before diving in a multi-timeframe Ethereum analysis.
The Crypto Market picture in today's CPI session
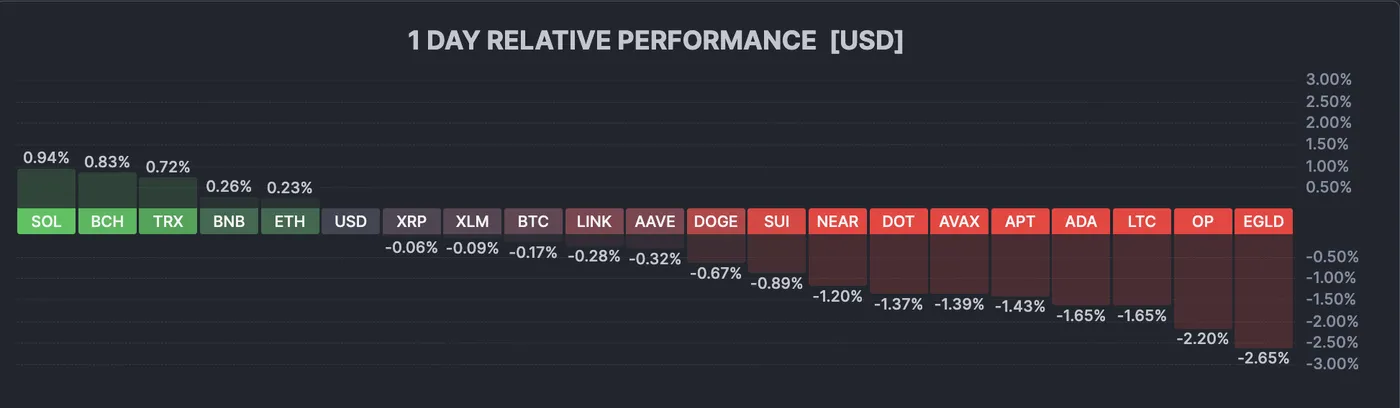
Crypto market overview, September 11, 2025 – Source: Finviz
The Crypto picture is very mixed overall – watch other risk assets and market leaders (Solana in today's session) to spot how flows evolve.
A multi-timeframe Ethereum analysis
Ethereum Daily Chart
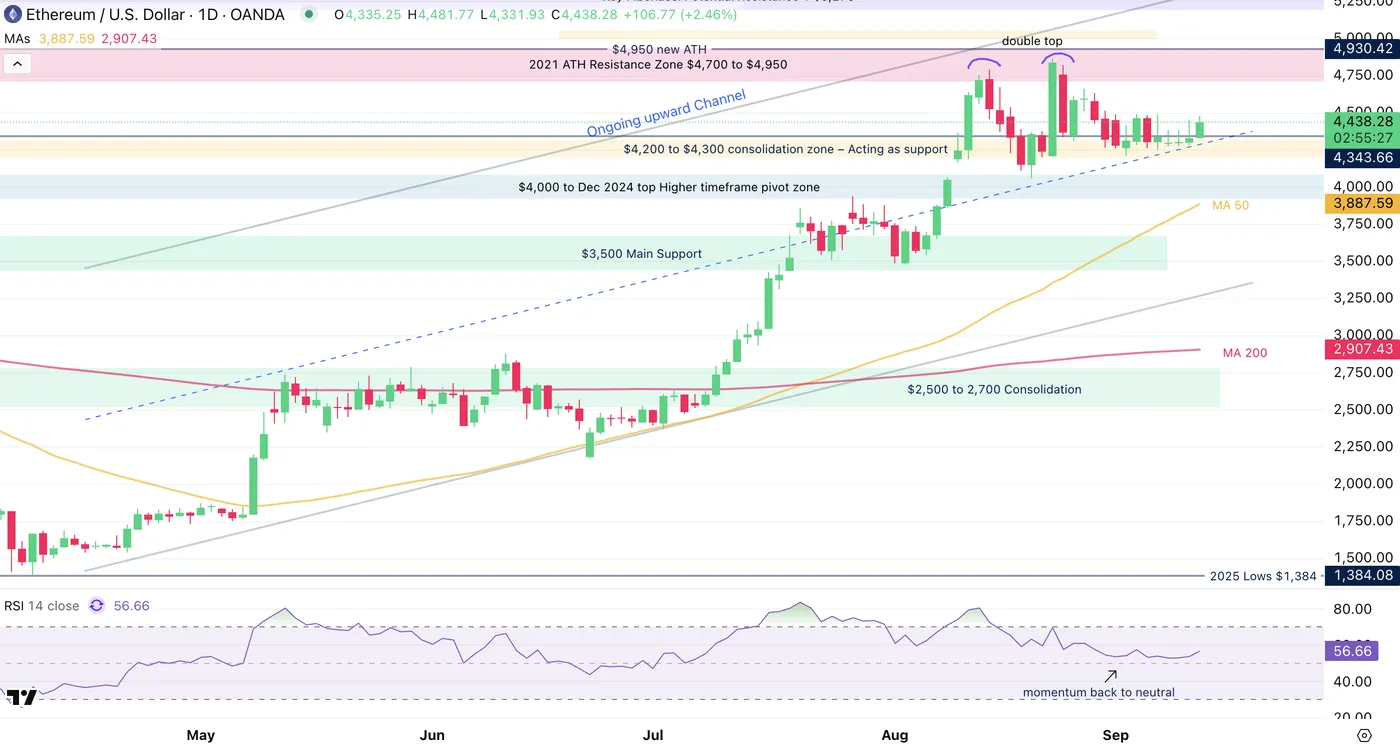
Ethereum Daily Chart, September 11, 2025 – Source: TradingView
Since our last analysis of the second largest crypto, prices have consolidated above the 4,200 to 4,500 momentum pivot.
Momentum has now decreased from extremely overbought levels back to right above neutral which allows for further potential action to develop.
The combination of both price and momentum consolidation provides a floor for higher volatility in the upcoming weeks.
Despite the lack of momentum, if sentiment stays positive as it is, ETH has formed a floor on which to bounce on.
The balance to this potential outcome however would be a failure to rebound from here which can lead to a lower interest in cryptos, which would be detrimental for the digital asset Market.
Momentum attracts momentum!
Ethereum 1H Chart
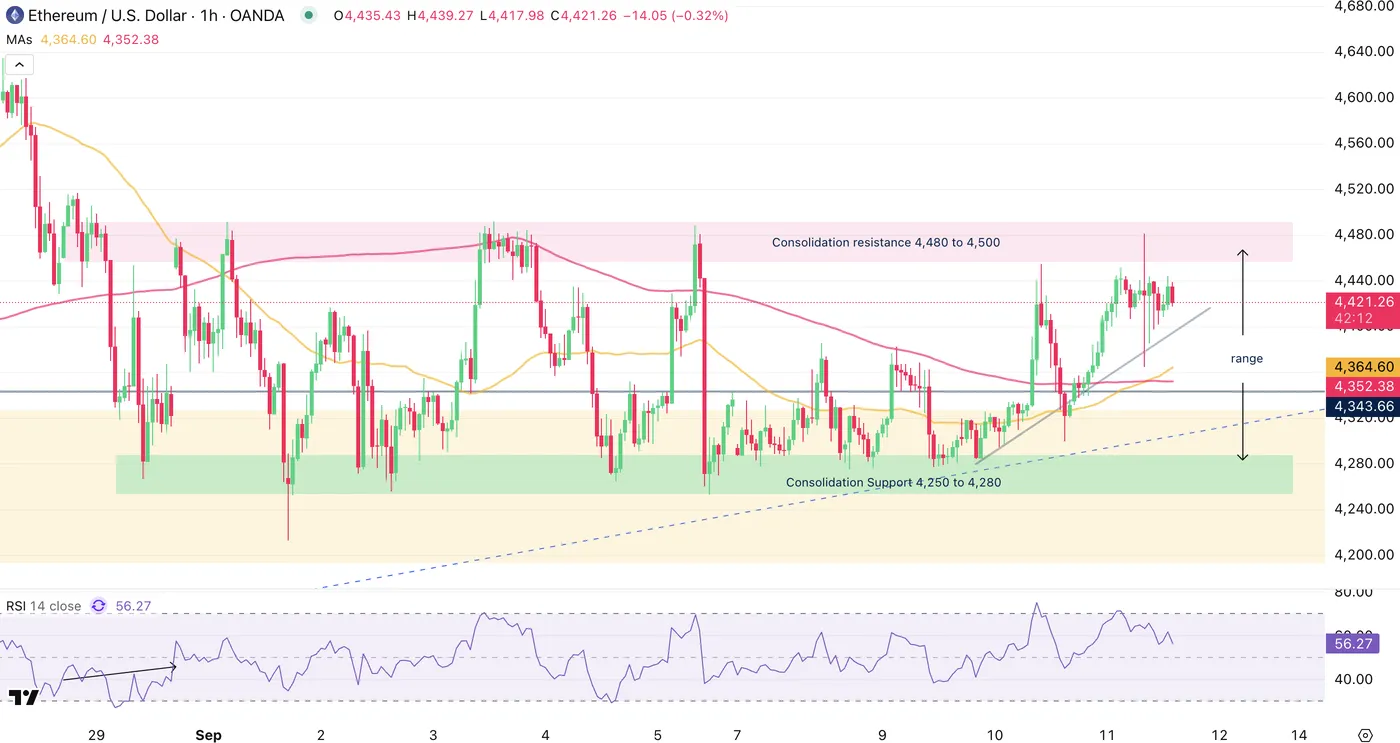
Ethereum 1H Chart, September 11, 2025 – Source: TradingView
Looking closer highlights how strong the ongoing range is.
Buyers will have to maintain the upward trendline as a few breakout attempts got rejected during the ongoing session.
Consolidating above $4,400 could provide the necessary boost for an upside breakout, but will require a concrete breakout above the consolidation highs (around the $4,500 level).
Levels of interest for ETH trading:
Support Levels:
- Consolidation Support 4,250 to 4,280
- $4,200 to $4,500 consolidation Zone (getting tested)
- $4,000 to $4,095 Main Long-run Pivot
- $3,500 Main Support Zone
Resistance Levels:
Consolidation resistance $4,480 to $4,500
- $4,950 Current new All-time highs
- $4,700 to $4,950 All-time high resistance zone
- Potential main resistance $5,230 Fibonacci extension
A look-back at the ETH/BTC chart
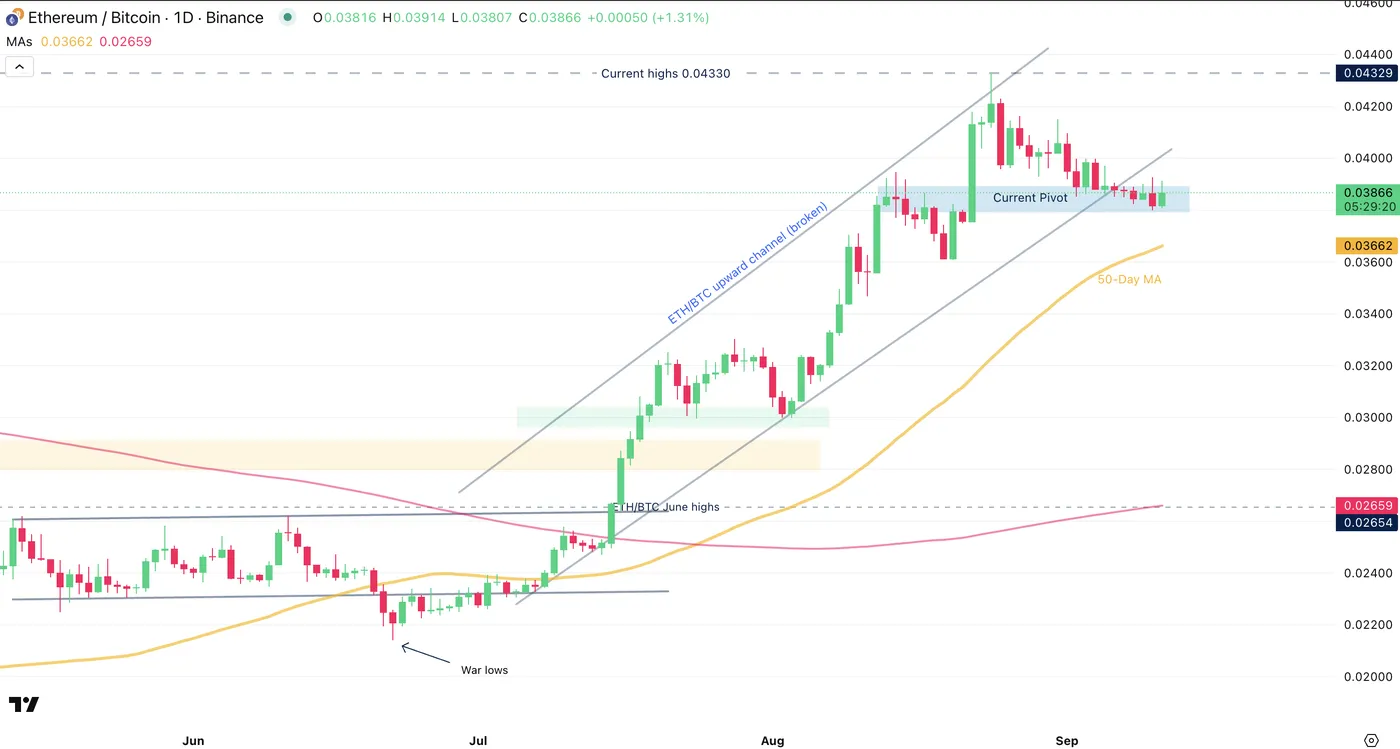
ETH/BTC Daily Chart, September 11, 2025 – Source: TradingView
Crypto market depth is currently stalling as translated by the most recent slowdown in the ETH/BTC ratio, however with the correction currently stalling, it will be time for crypto aficionados to flex their muscles to lift crypto market sentiment.
A rise in the crypto ratio is typically favorable for the Market and with ETH's most recent top, other altcoins are looking at their big brother to get started again.
On the other hand, Solana is still powering through. Keep an eye on the ETH/SOL relative performance.
A potential rally from here due to the ongoing consolidation may change market dynamics, therefore keep a close eye on the general crypto market sentiment.
Safe Trades!
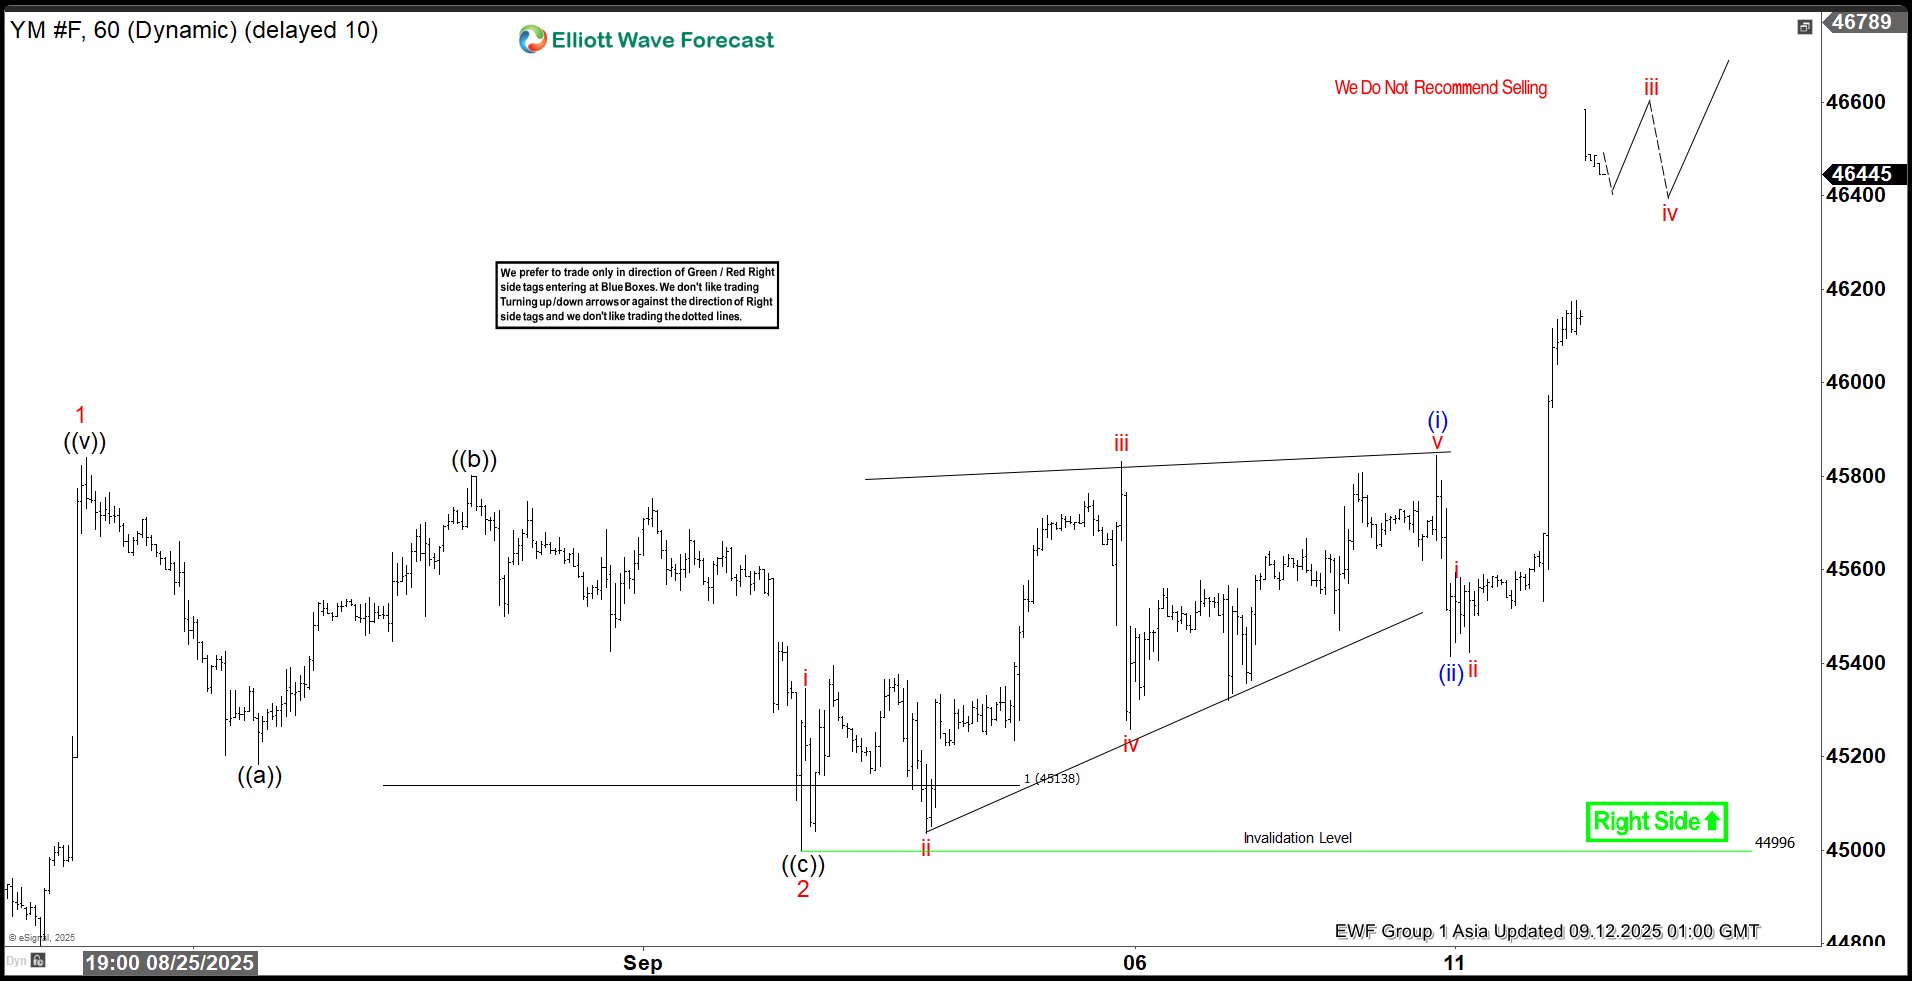
Dow Futures (YM) Resumes Upward Drive in Impulsive Formation
The short-term Elliott Wave analysis for Dow Futures (YM) indicates a cycle from the 1 August 2025 low is forming an impulse. The wave 1 peaked at 45,841, followed by a wave 2 pullback that ended at 44,996. Wave 2’s internal structure developed as a zigzag. From wave 1’s peak, wave ((a)) dropped to 45,183, and wave ((b)) rose to 45,801. Wave ((c)) then fell to 44,996, completing wave 2 at a higher level. The index now trends upward in wave 3.
From the wave 2 low, wave (i) reached 45,844 as a diagonal. A wave (ii) pullback concluded at 45,414. Wave (iii) higher is currently in progress and in the near term, the pivot at 45,996 must hold. If it does, dips should attract buyers in swings 3, 7, or 11, supporting further gains. This analysis highlights a structured upward movement. The wave patterns suggest strength after the wave 2 correction. Traders should watch the 45,996 level closely. A break below could signal a shift. Until then, the outlook favors buyers. Potential target for wave 3 higher is 100% – 161.8% Fibonacci extension of wave 1. This area comes at 47393 – 48871.
Dow Futures (YM) – 60 Minute Elliott Wave Technical Chart:
YM – Elliott Wave Technical Video:
https://www.youtube.com/watch?v=_9pn2sYxFDs
AUDUSD Wave Analysis
AUDUSD: ⬆️ Buy
- AUDUSD broke resistance area
- Likely to rise to resistance level 0.6700
AUDUSD currency pair recently broke the resistance area located at the intersection of the pivotal resistance level 0.6620 (former monthly high from July) and the resistance trendline of the daily up channel from May.
The breakout of this resistance area continues the active impulse wave c, which belongs to the ABC correction 2 from April.
Given the strong daily uptrend and bearish US dollar sentiment, AUDUSD currency pair can be expected to rise to the next resistance level 0.6700 (target for the completion of wave 2).

Bitcoin Wave Analysis
Bitcoin: ⬆️ Buy
- Bitcoin broke daily down channel
- Likely to rise to resistance level 116755.00
Bitcoin cryptocurrency recently broke the daily down channel from the start of August (which enclosed the c-wave of the previous ABC correction ii).
The breakout of this down channel continues the active impulse wave iii, which started earlier from the key support level 107940.00.
Given the clear daily uptrend, Bitcoin cryptocurrency can be expected to rise to the next resistance level 116755.00.

Flashlight for the September FOMC Blackout: Cuts to Begin Again
Summary
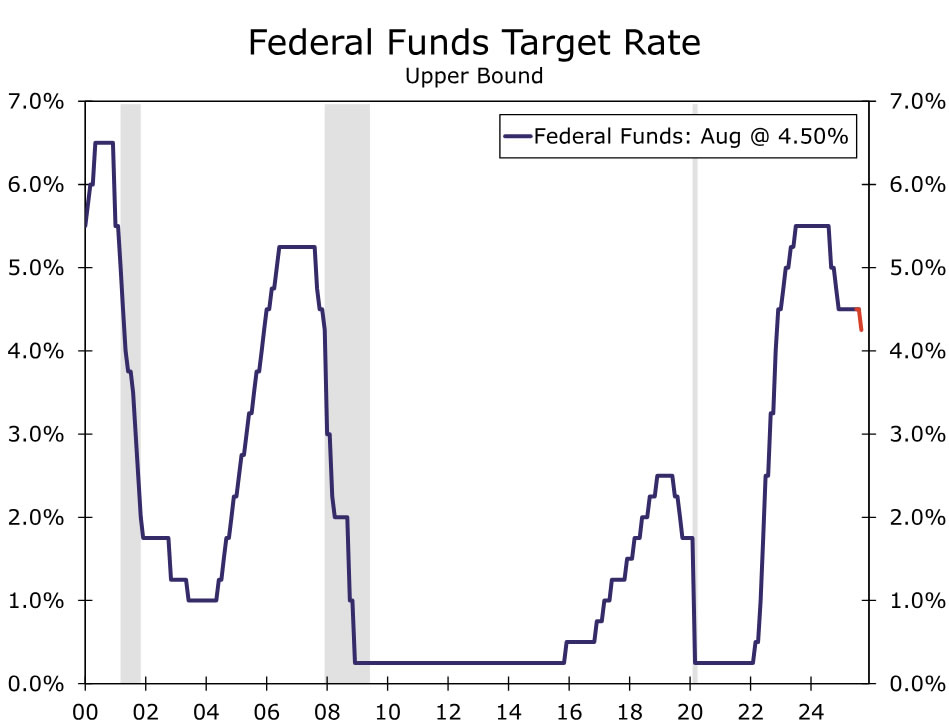
- We expect the FOMC to resume lowering the fed funds rate at its September meeting with a 25 bps rate cut that would bring the policy rate to a range of 4.00%-4.25%.
- A more precarious picture of the labor market has become apparent since the FOMC last met in July. The three-month average pace of payroll gains is now reported at just 29K compared to 150K when the FOMC gathered in July. Furthermore, the unemployment rate has moved up to a cycle-high of 4.3%, putting it at the top end of the FOMC’s range consistent with “full employment.”
- Additional policy easing this year has been delayed due to inflation. Reflation in the goods sector alongside slower services disinflation has kept core PCE running about one percentage point above the 2% target. That said, the outlook for inflation has been little changed over the past six weeks. Our own forecast looks for core PCE to rise 3.1% on a Q4/Q4 basis this year, the same as before the July FOMC meeting.
- We think the meeting statement will mark down the FOMC's current view of the labor market but refrain from signaling that additional rate cuts will immediately follow September’s cut. This would give the FOMC the flexibility to reduce the policy rate again at its next meeting on October 29 or proceed with additional easing more slowly.
- We expect the updated dot plot to signal more easing through the remainder of this year and next (Table). The composition of the Committee looks set to tilt in a more dovish direction with Stephan Miran on track to be confirmed prior to the meeting. However, the more significant driver of the revision, in our view, is the combination of increased risk to full employment and the generally stable inflation outlook. We think the median dot for 2025 will move down to project 75 bps of cuts compared to 50 bps of cuts in June. For 2026, we anticipate the median dot will fall 50 bps from the June SEP projection of 3.625% to 3.125%, implying an additional 25 bps cut next year. We do not expect any changes to the median longer-run estimate.
- Our base case forecast for the federal funds rate is three 25 bps rate cuts at the three remaining FOMC meetings of the year, followed by two 25 bps rate cuts at the March and June FOMC meetings before a prolonged hold at 3.00%-3.25%. For further reading on our fed funds projections and broader economic outlook, see our recently released monthly economic outlook.

Phase II of the FOMC's Rate Cutting Cycle Begins
The FOMC held the fed funds rate steady at the conclusion of its July 30th meeting, the Committee's fifth straight hold. The decision reflected still-elevated inflation and a constructive view of the jobs market based on the data in hand at that time. That said, the decision was not unanimous; Governors Waller and Bowman dissented in favor of a 25 bps cut.
We expect the FOMC to resume lowering the fed funds rate at its September meeting with a 25 bps cut that would bring the policy rate to a range of 4.00%-4.25% (Figure 1). Although the FOMC has been on hold for the past eight months, a bias toward further easing has persisted. Both the March and June dot plots showed that most officials expected rates to be lower later this year, as the current policy rate is set above even the highest estimates of the longer-run, “neutral” rate.
Additional policy easing this year has been delayed due to inflation. Consumer price growth has been above the FOMC’s 2% target for more than four years, leaving policymakers concerned that the prolonged overshoot could still de-anchor inflation expectations. The implementation of widescale tariffs has stoked these concerns further and has contributed to inflation turning higher again. Goods prices have been the driving force behind the upturn, but services inflation has also been sticky (Figure 2). Reflation in the goods sector alongside slower services disinflation has kept core PCE inflation running about one percentage point above the 2% target. That said, the outlook for inflation has been little changed over the past six weeks. Our own forecast looks for the core PCE delator to rise 3.1% on a Q4/Q4 basis this year, unchanged from our estimate prior to the July FOMC meeting.

The labor market through much of this year has looked to be in line with the FOMC’s mandate of maximum employment, with the unemployment rate hovering at, or slightly below, the Committee’s median longer run estimate of unemployment (4.2%). But, a more precarious picture of the labor market became apparent with the July jobs report released just two days after the FOMC’s last meeting. The marked slowdown in hiring in that report was reaffirmed with the August employment report released on September 5. The three-month average pace of payroll gains is now reported at just 29K compared to 150K when the FOMC gathered in July (Figure 3). Preliminary benchmark revisions from the BLS released on September 9 suggest that job growth in the 12 months ending March 2025 averaged only 73K, half its currently published pace. Furthermore, the unemployment rate has moved up to a cycle-high of 4.3%, putting it at the top end of the FOMC’s range consistent with “full employment.” (Figure 4)


With the labor market on shakier ground, more members appear ready to join Governors Waller and Bowman in support of reducing the fed funds rate even as inflation remains above target. Notably, in his address at Jackson Hole, Chair Powell opened the door for a rate cut in September by stating that the downside risks to employment are rising and that this shift in the balance of risks to the FOMC’s mandates “may warrant adjusting our policy stance.” Other voting members also appear to have grown more concerned. Even before the poor August jobs report, St. Louis Fed President Musalem, who is generally considered a hawk, said that “putting most of the weight on the inflation goal runs the risk of not providing enough support to maintain a full employment labor market at a time when downside risks have risen.”
Not everyone on the Committee seems fully convinced that it is appropriate to begin lowering rates at the September meeting. Chicago Fed President Goolsbee, speaking after the August jobs report, said that he is still undecided about his support for a rate cut and noted the need to look at the inflation side of the mandate too. We think it is possible that he or Kansas City President Schmid dissents in favor of keeping the fed funds rate unchanged. If current Chair of the Council of Economic Advisers Stephen Miran is confirmed in time to participate in the meeting, which seems probable at this point in time, we think it is possible he could dissent in the opposite direction, perhaps preferring a 50 bps rate cut to make up for the hold at the July meeting. Governors Bowman or Waller also could dissent in favor of a 50 bps move, although we consider this a less likely outcome.
In terms of changes to the post-meeting statement, we think the new meeting statement will mark down the Committee’s current assessment of the labor market. We expect the characterization of “solid” to be abandoned and for the statement to note that the unemployment rate has moved up while hiring has slowed. With inflation still “somewhat elevated,” we believe the statement will be cautious in signaling that additional rate cuts will follow September’s anticipated move. We doubt it will reference the pace of additional cuts ahead, e.g., as “gradual” or “measured.” Rather, we suspect the statement will continue to indicate that future adjustments will depend on additional data and changes in the outlook. This would give the Committee the flexibility to reduce the policy rate again at its next meeting on October 29 or proceed with additional easing more slowly.
Summary of Economic Projections to Show More Easing Ahead
More insight into how FOMC participants see the path of the policy rate unfolding will be available in the Summary of Economic Projections (SEP). We expect the updated dot plot to signal more easing through the remainder of this year and next. In the prior SEP released in June, the median projection for the fed funds rate at year-end implied a total of 50 bps of rate cuts. We think the median will shift down to 75 bps of cuts this year (Figure 5). For 2026, we anticipate the median dot will fall 50 bps from the June SEP projection of 3.625% to 3.125%, implying an additional 25 bps cut during the next calendar year. The projections for 2027 and the first look at 2028 likely will be widely dispersed given the longer time horizon, yet we anticipate the median each year also will register 3.125%, consistent with the policy rate returning to a more neutral stance by the end of the forecast horizon. We do not expect any changes to the median longer-run estimate.

The lower median projections for the fed funds rate in 2025 and 2026 could be fostered by a more dovish composition of the Committee if Stephan Miran is confirmed in time to participate in the September meeting. However, the more significant driver, in our view, is the combination of greater risk to employment amid a generally stable outlook for inflation the past few months despite ongoing uncertainty around the inflationary impact of changes to tariff policy (Figure 6). We anticipate the median Q4/Q4 estimates for headline and core PCE inflation in 2025 will remain unchanged in the September SEP at 3.0% and 3.1%, respectively. The inflation estimates for 2026 may tick up a tenth or so as the slow adjustment to tariffs keeps inflation elevated slightly longer, although at around 2.5%, that would still leave inflation making strides back toward the Committee's target next year.

We expect the median estimate for the unemployment rate to remain at 4.5% at the end of this year and next, as the sharp slowdown in payroll growth recently has coincided with weaker labor force growth. While this would not mark a change from the last SEP, we suspect the Committee's risk assessments to their unemployment projections will be further tilted toward the upside. The 2025 median projection for GDP is also likely be left unchanged after growth appears to have rebounded strongly in Q2 from its dip at the start the year. That said, 1.4% growth on a Q4/Q4 basis would still be below the Committee's estimate of potential growth (1.8%) and consistent with underlying inflation easing after the initial price pressures from tariffs have passed.