Sample Category Title
EUR/JPY Weekly Outlook
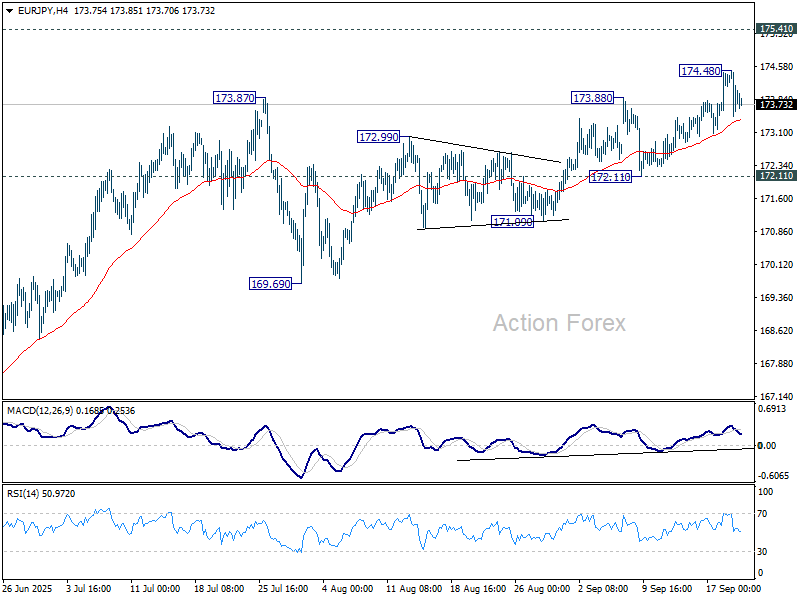
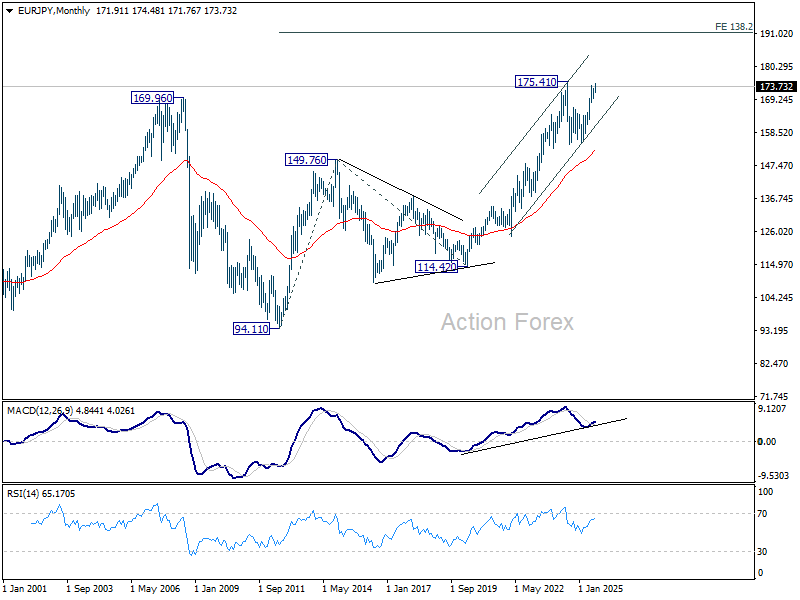
EUR/JPY's rally resumed by breaking through 173.77/8 resistance but lost momentum again after hitting 174.48. Initial bias remains neutral this week for more consolidations. Outlook will stay bullish as long as 172.11 support holds. Above 174.48 will target a retest on 175.41 high. However, firm break of 172.11 support will confirm short term topping, and turn bias back to the downside for deeper pullback.
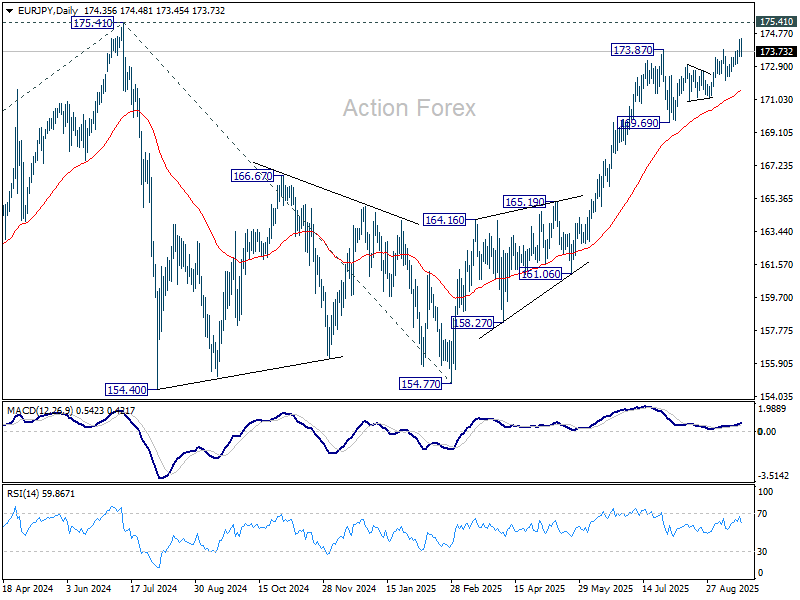
In the bigger picture, current rally from 154.77 is still tentatively seen as resuming the larger up trend. Firm break of 175.41 (2024 high) will confirm and target 61.8% projection of 124.37 (2022 low) to 175.41 from 154.77 (2025 low) at 186.31. However, sustained break of 169.69 support will delay this bullish case, and probably extend the correction from 175.41 with another fall.
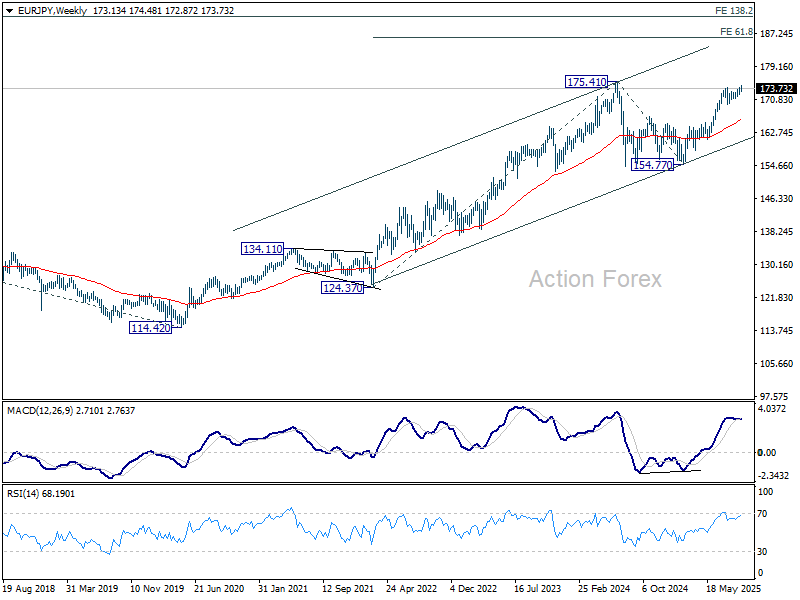
In the long term picture, up trend from 94.11 (2021 low) is still in progress. On resumption, next target is 138.2% projection of 94.11 to 149.76 (2014 high) from 114.42 (2020 low) at 191.32.
EUR/GBP Weekly Outlook
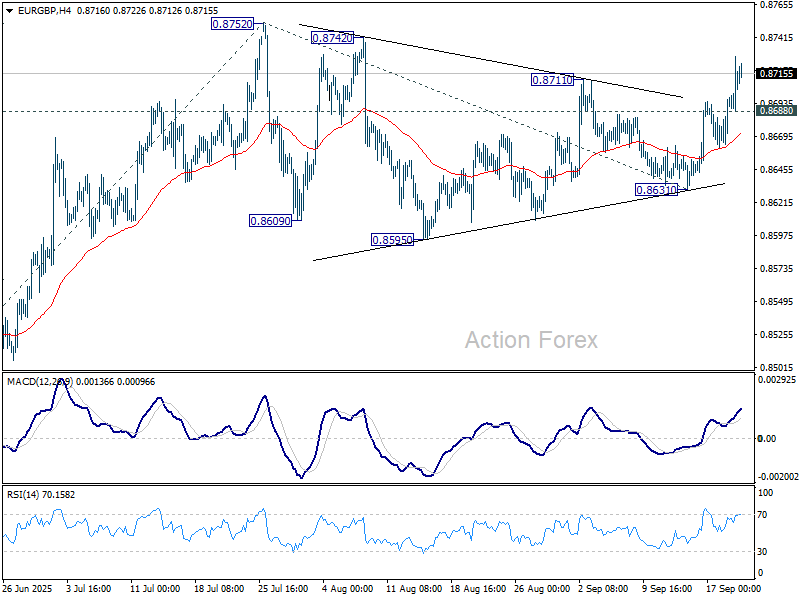
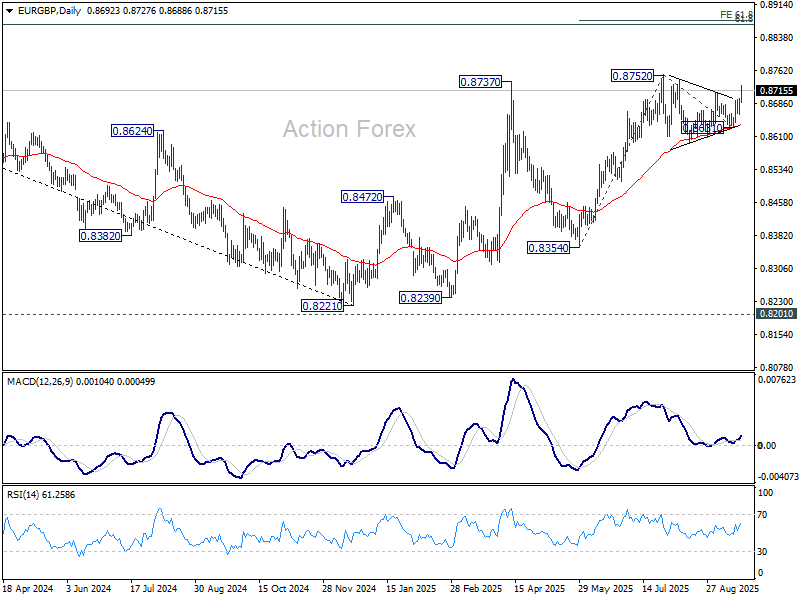
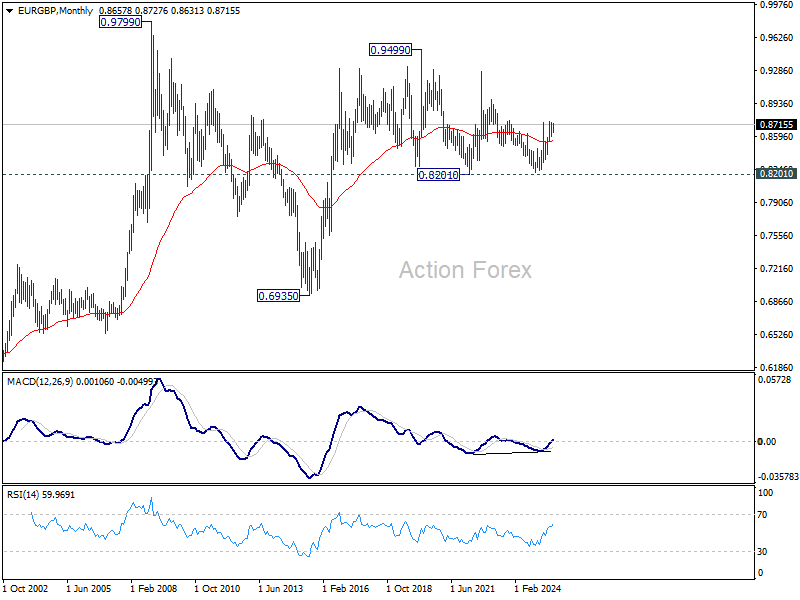
EUR/GBP surged through 0.8711 resistance last week. One interpretation is that consolidations pattern from 0.8752 has completed as a triangle at 0.8631. Initial bias remains on the upside this week for retesting 0.8752 high. Firm break there will resume larger rally to 61.8% projection of 0.8354 to 0.8752 from 0.8631 at 0.8877, which is close to 0.8867 fibonacci level. On the downside, though, below 0.8688 minor support will dampen this view and turn bias neutral first.
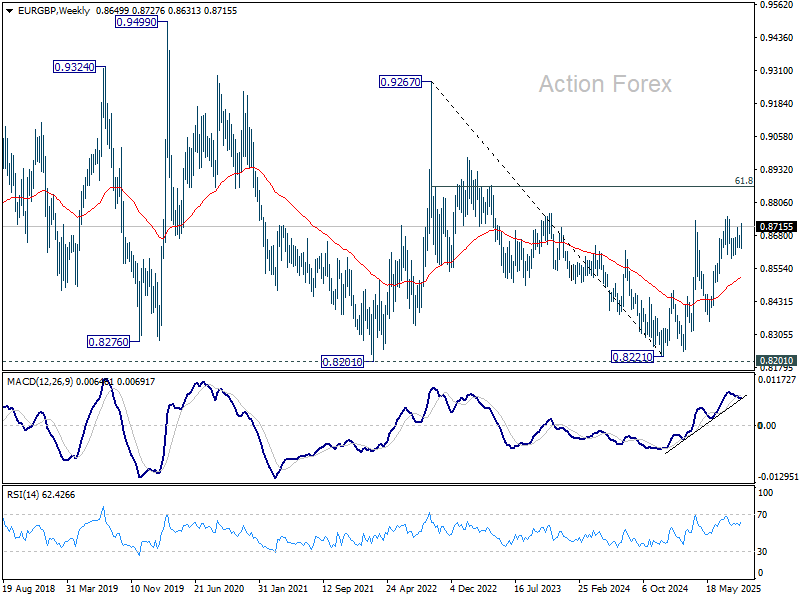
In the bigger picture, the structure from 0.8221 medium term bottom are not impulsive enough to suggest that it's reversing the down trend from 0.9267 (2022 high). But even if it's a correction, further rise could still be seen to 61.8% retracement of 0.9267 to 0.8221 at 0.8867. Nevertheless, sustained trading below 55 W EMA (now at 0.8518) will argue that the pattern has completed and bring retest of 0.8221 low.
In the long term picture, price action from 0.9499 (2020 high) is seen as part of the long term range pattern from 0.9799 (2008 high). Range trading should continue between 0.8201 and 0.9499, until there is clear signal of imminent breakout.
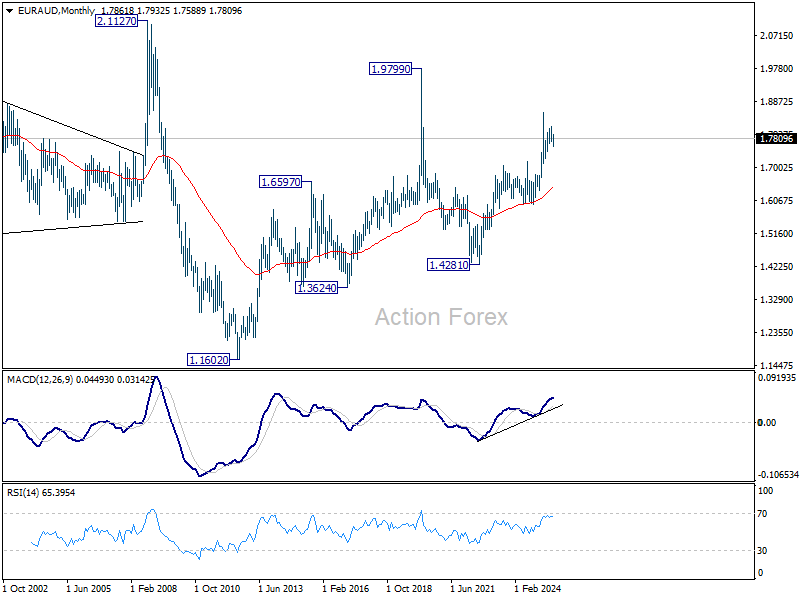
EUR/AUD Weekly Outlook
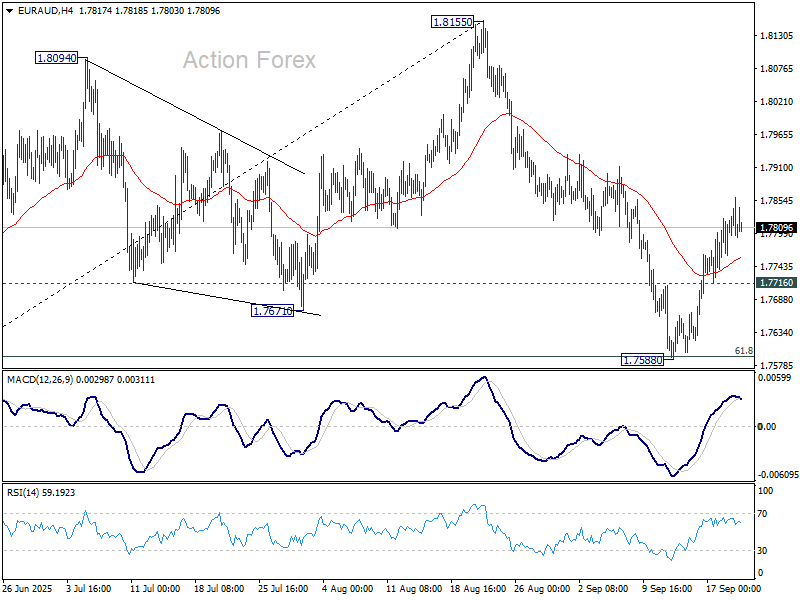
EUR/AUD's extended rebound last week and breach of 55 D EMA (now at 1.7809) suggests that pullback from 1.8155 has completed 17588, after defending 61.8% retracement of 1.7245 to 1.8155 at 1.7593. Initial bias remains mildly on the upside this week for further rebound to retest 1.8155. On the downside, however, break of 1.7716 will bring deeper fall to retest 1.7588 instead.
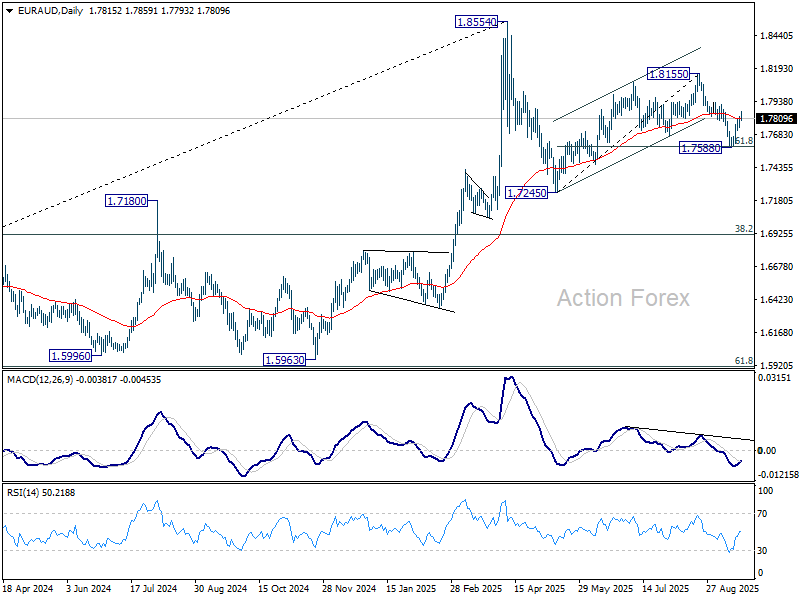
In the bigger picture, price actions from 1.8554 medium term top are seen as a corrective pattern. Deeper fall could be seen as the pattern extends, but downside should be contained by 38.2% retracement of 1.4281 (2022 low) to 1.8554 at 1.6922 to bring rebound. Uptrend from 1.4281 is expected to resume at a later stage.
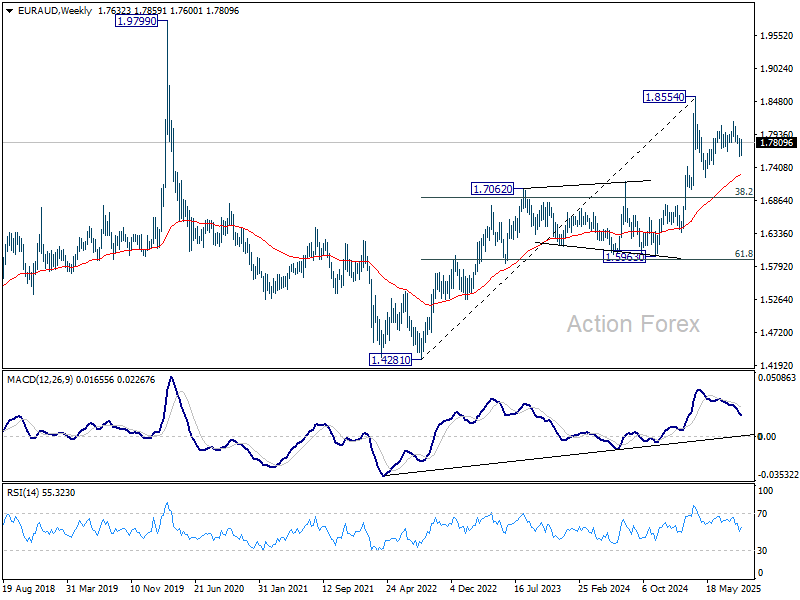
In the longer term picture, rise from 1.4281 is seen as the second leg of the pattern from 1.9799 (2020 high), which is part of the pattern from 2.1127 (2008 high). As long as 55 M EMA (now at 1.6464) holds, this second leg could still extend higher.
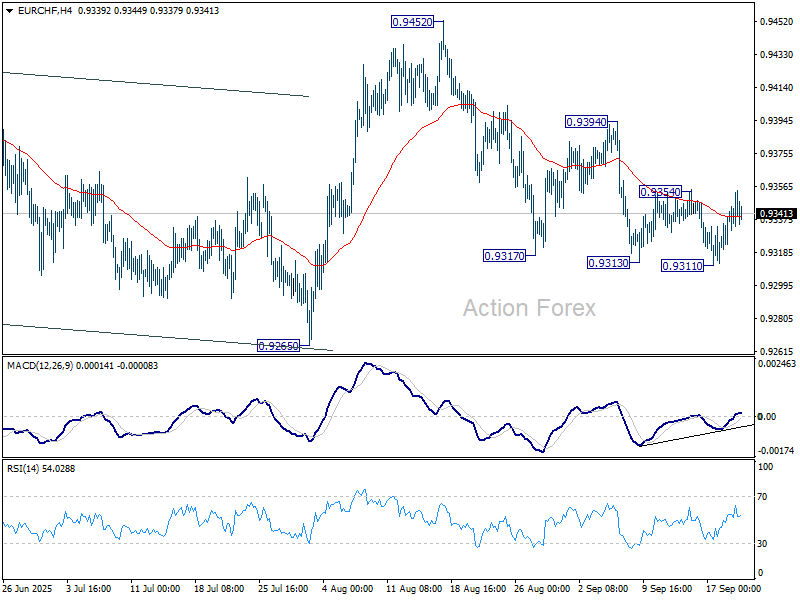
EUR/CHF Weekly Outlook
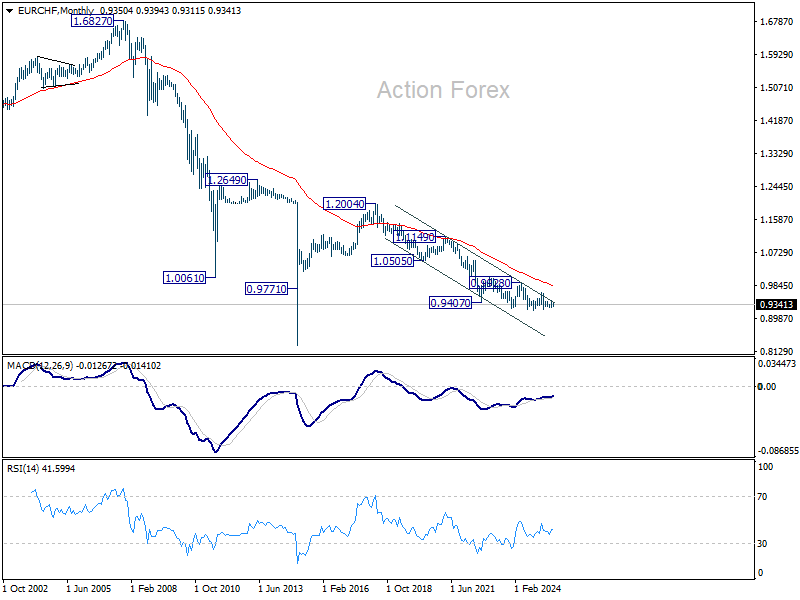
EUR/CHF edged lower again to 0.9311 but quickly rebounded. Upside is capped by 0.9354 resistance so far. Initial bias stays neutral this week first. Considering bullish convergence condition in 4H MACD, firm break of 0.9354 will confirm short term bottoming, and bring stronger rebound to 0.9394 resistance. On the downside, break of 0.9311 will resume the fall from 0.9452 to 0.9265 support.
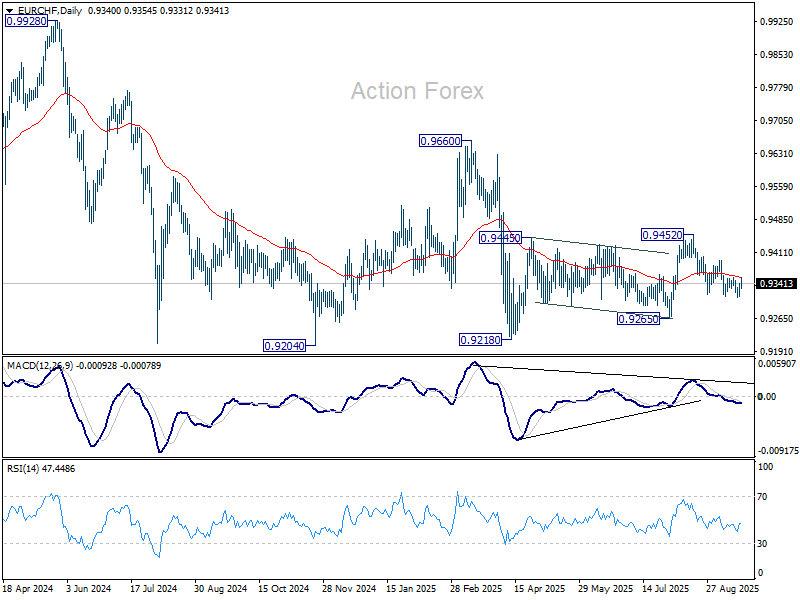
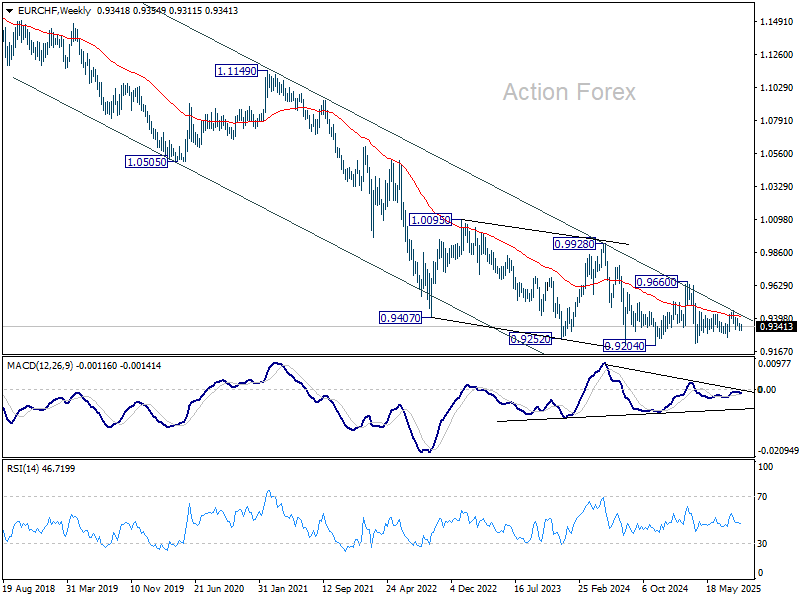
In the bigger picture, the down trend from 0.9204 (2018 high) might still be in progress considering that EUR/CHF is staying well inside the long term falling channel. However, with bullish convergence condition in W MACD, downside potential should be limited in case of another fall. Instead, firm break of 0.9660 resistance will be an important sign of medium term bullish trend reversal.
In the long term picture, overall long term down trend is still in progress in EUR/CHF. Outlook will continue to stay bearish as long as 55 M EMA (now at 0.9839) holds.
Markets Weekly Outlook – PMI and PCE in the Spotlight as US Dollar Remains Sensitive to US Labor Data
Week in review - Fed Delivers Cut but Keeps Markets in Check
A busy week that was still dominated by the highly anticipated Federal Reserve Meeting. I have to say, hats off to Fed Chair Powell who kept markets in check whether you think he is right or wrong in his decision. Believe me there is support in both camps.
Fed Chair Powell in particular has been under pressure from the political sphere while labor data and mixed economic signals put the Fed Chair in the firing line. The Fed board itself faced a key decision as markets have turned extremely dovish in expectations ahead of the meeting.
The message from the Fed balanced market expectations while not giving too much away and pushing back to some degree at least, the questions of Fed independence.
So how did the markets perform?
The S&P 500 and the Nasdaq stock indexes are on track to have their third consecutive week of gains. This positive trend was fueled by the Federal Reserve's first interest rate cut of 2025 and hints that more relaxed monetary policies could be on the way. A renewed sense of optimism around stocks related to artificial intelligence (AI) also contributed to the market's rise.
However, the US stock market was a bit unsteady earlier in the day. Investors were still trying to understand the Fed's future plans and were paying close attention to comments made by Stephen Miran, the newest Fed governor and a White House economic adviser, who spoke on CNBC on Friday morning.
Also on Friday, US President Donald Trump and Chinese President Xi Jinping spoke on the phone, and afterward, Trump announced that they had made progress on a deal for TikTok. He also said that the two leaders had agreed to a meeting in person next month in South Korea.
So far in September, the three main US stock indexes—the Dow Jones Industrial Average, the S&P 500, and the Nasdaq Composite—are all performing well. This is unusual because September has historically been a difficult month for the US stock market. Data shows that since the year 2000, the S&P 500 has, on average, lost 1.4% of its value during this month.
How has the US Dollar Reacted?
The US Dollar has been resilient since the decision and not surprising considering that what the Fed delivered was more hawkish than expected.
However, the Fed met expectations by announcing its first rate cut of the year and indicating there would be two more cuts. This caused the dollar to immediately drop by about 0.5% against other currencies.
But within half an hour, the dollar had regained all of its lost value as US government bond yields started to rise again. This quick reversal was likely due to how traders were positioned in the market, rather than a change in how they viewed the Fed's announcement. It was a "trader's market"—meaning it was influenced more by short-term trading behaviors than by long-term economic signals.
The US Dollar index (DXY) is ending the week with 3 successive days in the green.
US Dollar Index Daily Chart, September 19, 2025
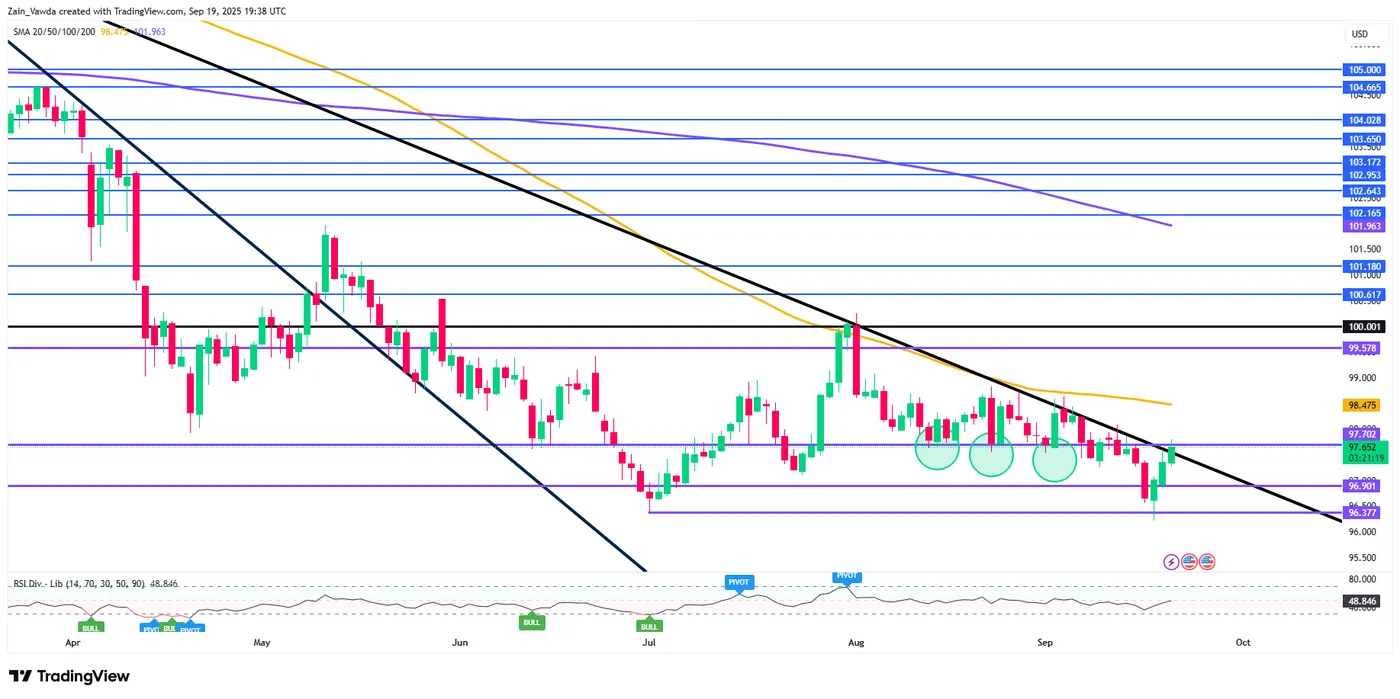
Source: TradingView.Com (click to enlarge)
Despite this rebound, the long-term outlook for the dollar doesn't seem very positive. The Fed has officially stated that the risk to its two main goals—stable prices and maximum employment—is now more focused on a weaker job market. With the expectation of two more rate cuts this year, bringing the policy rate down to 3.00-3.25%, the dollar could weaken. When the immediate market excitement dies down, the dollar is likely to fall back toward its lowest levels of the year and will become very sensitive to upcoming US job market data.
The Week Ahead - Global PMIs and US PCE
Next week is a busy one with Flash PMI survey data will provide a key focus for the markets in the coming week, though Friday's release of the US core PCE price index will also be eagerly awaited.
Other releases of note include revised US GDP numbers, consumer confidence data for the US and Europe, plus US, home sales, durable goods orders and inventories.
Asia Pacific Markets - Tokyo CPI
High impact data will be a bit sparse from Asia next week with the biggest data release being from Japan.
Tokyo CPI data will be released after the BoJ held rates steady but with a hawkish shift on Friday. Two officials on the central bank's board unexpectedly voted against the majority, showing a more "hawkish" view—meaning they are more concerned about inflation and are in favor of raising interest rates.
The market was also caught off guard by the central bank's announcement that it would begin selling its holdings of exchange-traded funds (ETFs) and Japanese real estate investment trusts (J-REITs). This move is a strong sign that the Bank of Japan (BoJ) is serious about gradually returning its monetary policy to normal.
Based on these signals, I believe that an interest rate hike is a probability in October.
Global PMI and US PCE Data in Focus
Over the next week, several officials from the Federal Reserve (the Fed) will be speaking publicly. This is an important opportunity to hear their individual views on the economy after the Fed recently decided to resume cutting interest rates. They'll likely provide more details on how they see the risks to the economy, especially after signaling that their main forecast is for two more rate cuts this year and one in the next.
The most important data release will be the core personal consumer expenditure (PCE) deflator on Friday. This is the inflation measure the Fed prefers to use.
While the core consumer price index (CPI) rose a bit more than expected last month, the core PCE is likely to show a more modest increase. This is because it gives less weight to housing costs and includes different data like airline fares and healthcare costs. If the core PCE comes in as expected, it would give the Fed a clear signal to move forward with more rate cuts in October and December.
Additionally, new housing market data will be released. With more homes available for sale but still weak demand from buyers, there are growing concerns that home prices could start to fall.
Looking at the Euro Area and based on recent data, business activity in August, measured by PMIs (Purchasing Managers' Indexes), was very positive, primarily because of a significant increase in manufacturing.
However, a separate survey from the European Commission suggests that this boost might be a one-time event, as future expectations for the manufacturing sector weren't particularly strong.
For September, this creates a question for economists: Will the positive mood from the summer continue, or was August's good performance just a brief exception? We think the latter is very possible, especially given that the economy is currently growing at a slow pace.
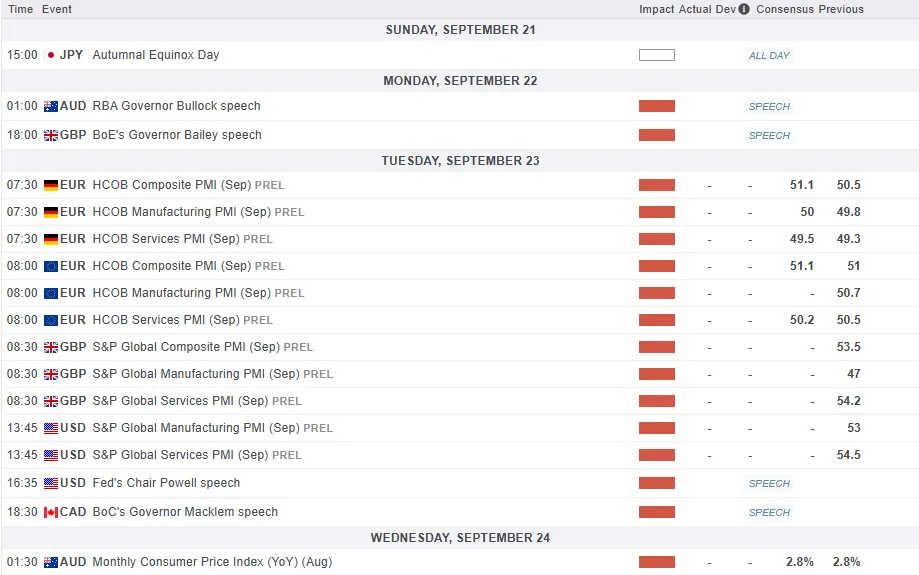
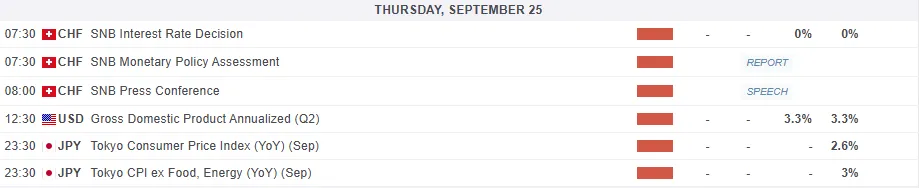
For all market-moving economic releases and events, see the MarketPulse Economic Calendar. (click to enlarge)
Chart of the Week - Gold (XAU/USD)
This week's Chart of the week is Gold.
From a technical standpoint, Gold pulled back after the FOMC meeting and retested the bull flag pattern breakout from Monday.
A bullish move since leaves gold on course for another week of gains above 1%. Gold is trading just shy of the $3700/oz handle.
A weekly close above this level seems unlikely this late in the day which leaves Gold in a precarious position heading into the new week.
Looking at the four-hour timeframe, Gold has recorded a change in structure but could be in for a short-term pullback before continuing higher.
Gold has seen its price target updated by many institutions as a combination of potential US Fed rate cuts, along with continued central bank buying and ETF inflows are likely to keep Gold supported.
That of course does not rule out small price retracements in the interim and that could come into play at some stage next week if profit taking does occur.
If the US Dollar index retreats next week that could be another factor which could influence the trajectory of Gold prices, so keep an eye on that.
Immediate support rests at 3666 before the 3656 and 3627 handles come into focus.
Looking at the upside and immediate resistance rests at 3700 before all-time highs at 3707 comes into focus.
Gold Four-Hour Chart Chart - September 19, 2025
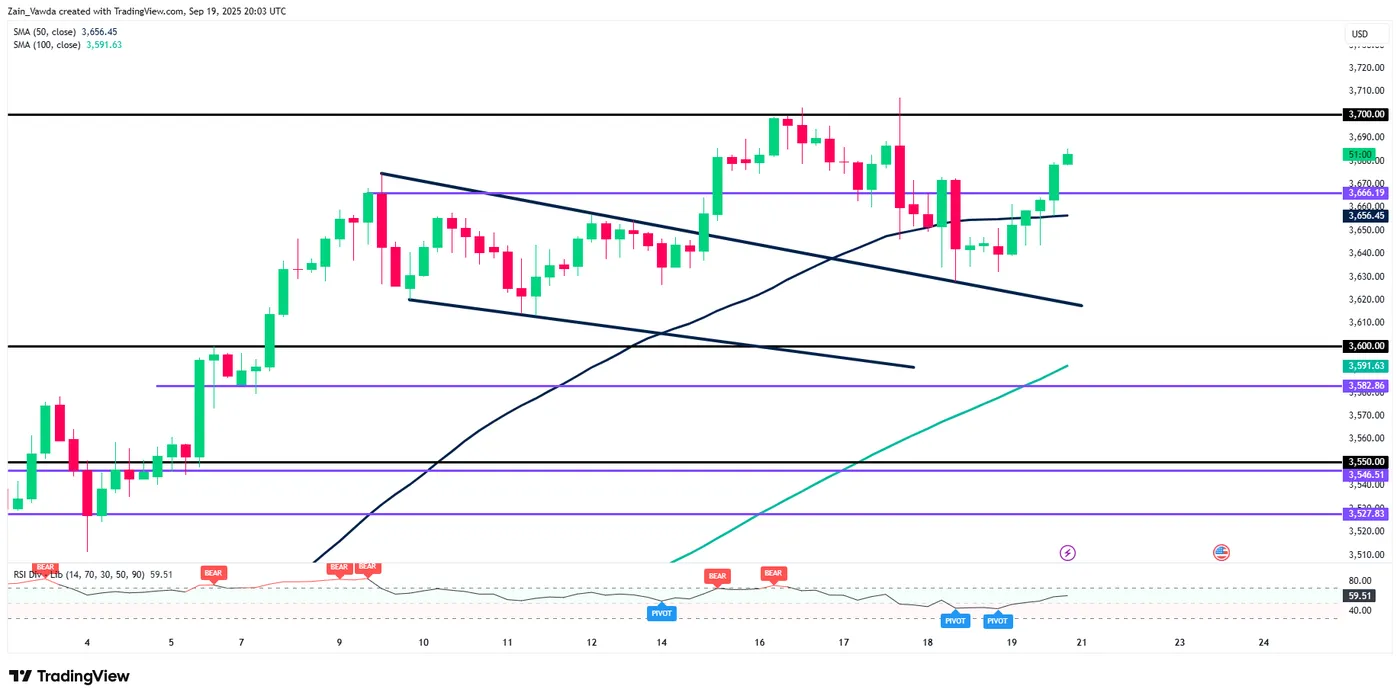
Source:TradingView.Com (click to enlarge)
Trade Safe.
The Weekly Bottom Line: Powell’s ‘Risk Management’ Cut
Canadian Highlights
- Despite rate cuts from the Bank of Canada and the U.S. Federal Reserve, bond yields rebounded post-Fed press conference, leaving Canadian yields and equities flat for the week.
- Core inflation metrics remain elevated on a year-on-year basis, but more recent trends show significant slowing, with fewer CPI categories rising rapidly and both goods and services inflation cooling markedly.
- The upcoming federal budget will be crucial for economic direction and future Bank of Canada rate decisions.
U.S. Highlights
- The Fed resumed rate cuts at this week’s FOMC meeting, lowering the policy rate by 25 basis points to 4.00%-4.25%.
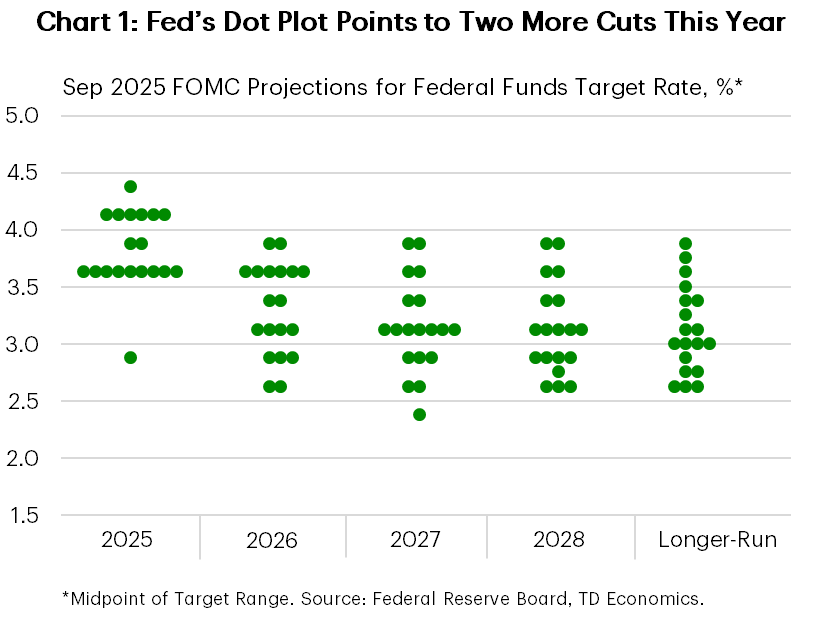
- The Fed’s “dot” plot pointed to two more cuts by the end of this year, but it also showed one member who expects a lot more easing.
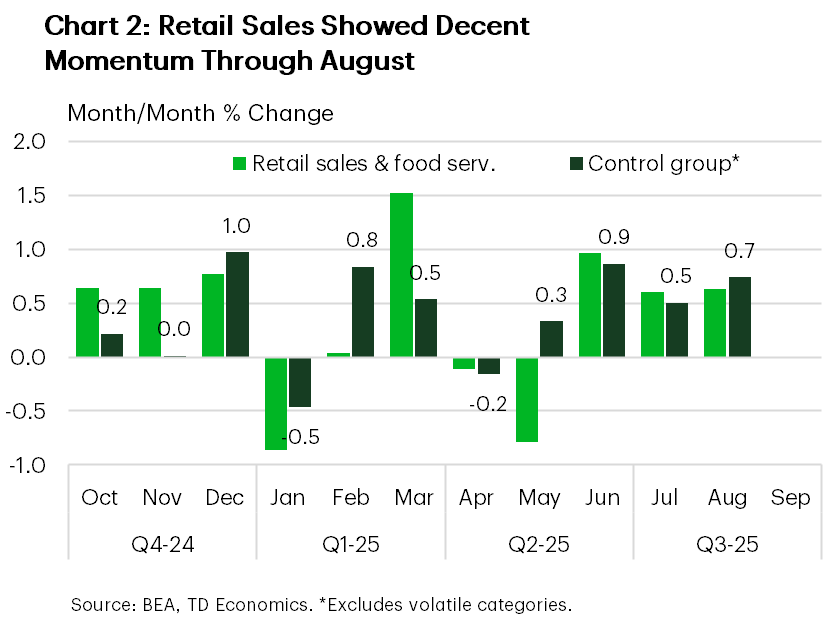
- Retail sales came in better than expected in August, rising 0.6% on the month. Sales in the control group, which strip out volatile categories, rose an even better 0.7%.
Canada – A Cool-Down and a Cut
It was a busy week with updates on inflation and retail sales, along with rate cuts from the Bank of Canada and the U.S. Federal Reserve Bank. Despite the Fed’s rate cut, U.S. bond yields popped, taking global yields with them. For Canada, this now leaves the 10-year bond yield basically unchanged from the start of the week, and the TSX hovering near its record high. For all the ructions in the market, the economic details showcase why we maintain our view that the Bank of Canada was right to cut at this meeting, and that another cut in October is the right way to go.
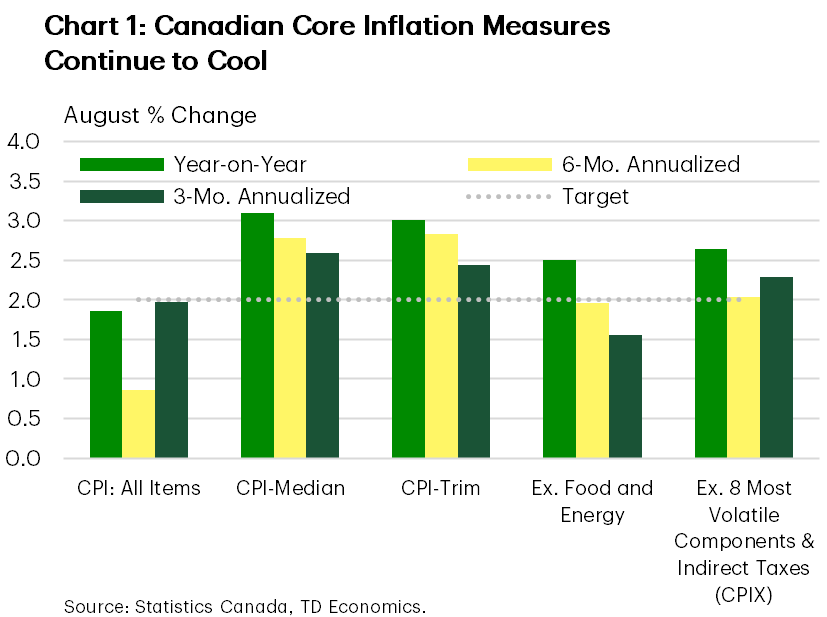
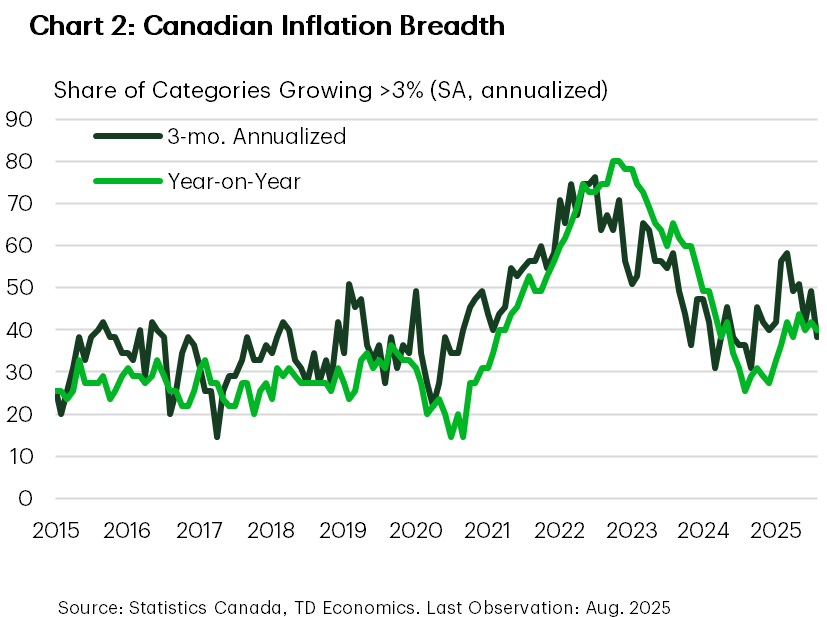
The story starts with inflation. Eliminating the consumer carbon tax has dragged down top line inflation since April, so all eyes have been laser focused on core measures. From that lens things sure seem ugly, with the Bank’s preferred measures still reading around 3.0% year-on-year (y/y), and the old exclusion measures CPI ex-food and energy and CPIX at 2.4% and 2.6% y/y, respectively. But these measures mask what’s been going on in recent months, instead reflecting the spring’s run-up in prices. On a three-month basis (Chart 1) inflation across all core measures has slowed precipitously in the past two months. Moreover, the breadth of inflation has sunk with it. The share of CPI categories rising at more than 3% (annualized) over the past three months has fallen to roughly 38%, sharply lower from the 58% share registered in the spring (Chart 2).
Previously strong prints in core goods prices have faded and it’s now running at 1.2% (3-mo. annualized), and services prices too have cooled to 1.5% (3-mo. annualized). We expect soft momentum in these key categories to continue as domestic demand struggles to gain traction in the wake of the trade shock. This week’s retail data for July bolstered that view. Although the data remain volatile, growth is petering out, and we now expect nominal retail spending in Q3 to register a below-trend 1.6% annualized gain.
Weaker business prospects are expected to push the unemployment rate higher heading into 2026, with restrained population growth limiting the degree of weakness in the labour market. The soft demand backdrop, coupled with the federal government’s removal of most retaliatory tariffs are tempering worries about a possible resurgence of inflation in the back half of 2025.
The wildcard in all of this is what is to come from the Federal government’s budget. We learned this week that it will be released on November 4th, but continue to await details. Five projects have been called out for the Projects of National Significance list, along with planned spending on Build Canada Homes, tariff mitigation measures for affected industries and re-skilling for affected workers. In the coming weeks we will be keenly watching for any news on the structure of proposed savings measures and for signs on the timing of planned (but not yet announced) investment outlays. The scale and timing of the cuts and investments could materially affect the trajectory of the economy and the BoC’s calculus on where the policy rate should be heading into 2026.
U.S. – Powell’s ‘Risk Management’ Cut
The Federal Reserve resumed its easing cycle after a nine-month pause, cutting the policy rate by 25 basis points at this week’s FOMC meeting. The move was widely anticipated, and while bond yields initially dipped, they ultimately rose as markets digested the broader implications. Equities, however, rallied, with the S&P 500 climbing another 1% on the week at time of writing.
The FOMC statement signaled a shift in emphasis from the ‘price stability’ mandate toward ‘full employment’, noting that “downside risks to employment have risen”. This echoed Fed Chair Powell’s remarks at Jackson Hole last month and set the tone for what he later described as a “risk management cut”. In essence, while inflation remains elevated, the Fed deemed it prudent to begin easing the policy rate to help guard against further labor market deterioration.
The decision was accompanied by the latest Summary of Economic Projections (SEP), which offered a mixed picture. Unemployment rate forecasts were largely unchanged, while growth projections for 2025 and 2026 were nudged up 20 basis points (bps) to 1.6% and 1.8%, respectively. Core inflation expectations for next year were also bumped up by 20 bps to 2.6%, with this measure now projected to return to target only by 2028 – which would mark seven consecutive years above the Fed’s 2% goal. The median forecast now calls for three cuts by year-end (including this week’s) up from two, and is in tune with our expectations. But one member projected the equivalent of three jumbo 50 bps cuts total (Chart 1). Stephen Miran, President Trump’s newly appointed Fed governor, is likely the one projecting more aggressive cuts as he was the lone dissent at this week’s meeting, favoring a larger 50 bps cut.
Economic data released this week did little to bolster the case for continued easing. Initial jobless claims fell back last week, following a surge in the week prior. And while housing remained a soft spot, with homebuilding pulling back in August, consumption-related data came in better than anticipated. August retail sales and food services rose 0.6% on the month, matching July’s gain. Sales in the ‘control group’ – which strip out volatile components – rose a solid 0.7%, building on gains in the prior two months (Chart 2). While tariffs are still expected to chip away at spending power and weigh on consumption, this recent data suggests consumers may still have some gas in the tank.
The bottom line is that while the Fed has resumed rate cuts to guard against further labor market weakness, its “risk management” approach means future moves will remain highly data dependent. The Fed will continue to have a hard time balancing the risks with respect to its dual mandate. But ultimately, we believe that the tariff impact on inflation will be temporary, and we expect the central bank to continue to cuts rates to support the economy (see our latest Quarterly Economic Forecast here).
Weekly Economic & Financial Commentary: From Bipolar to Tripolar?
Summary
United States: The Balance of Risks Has Shifted
- The steadiness in consumer spending has helped prevent widespread layoffs, but rising tariff-related costs have limited firms’ ability to expand payrolls or undertake major capital investments. These crosscurrents have curtailed job creation and kept inflation elevated. The FOMC responded this week by cutting its policy rate 25 bps, signaling that a deteriorating jobs market has overshadowed concerns about stubborn inflation.
- Next week: New Home Sales (Tue.), Durable Goods (Thu.), Personal Income and Spending (Fri.)
International: Central Bank Bonanza: Cuts, Holds and Surprises
- Central banks were in the spotlight this week—not only the Federal Reserve, but also counterparts across advanced and emerging markets. Rate cuts came from central banks in Canada, Norway and Indonesia, while the U.K., Japan and Brazil held rates steady—and there were plenty of surprises along the way.
- Next week: Eurozone PMIs (Tue.), Riksbank Policy Rate (Tue.), Banxico Policy Rate (Thu.)
Interest Rate Watch: A "Risk Management" Cut
- The FOMC cut the fed funds rate by 25 bps to 4.00%-4.25%, citing rising risks to employment despite persistent inflation, with most members signaling further easing ahead. Chair Powell emphasized a cautious, data-dependent approach, suggesting additional rate reductions are still likely but not guaranteed.
Credit Market Insights: Cautious Households Moderate Credit Card Spending
- Credit card spending growth has moderated as households faced scant income gains in 2024, with most increases concentrated among top earners. Lower credit uptake, combined with reduced discretionary outlays and rising delinquencies, reflects mounting financial pressure on consumers.
Topic of the Week: From Bipolar to Tripolar?
- We explore how global trade fragmentation could evolve beyond a U.S.-China split into a three-bloc system including the EU. Such a tripolar world would impose far greater costs on global growth.
Forward Guidance: Early Indicators Point to Canada’s Growth Rebounding in July
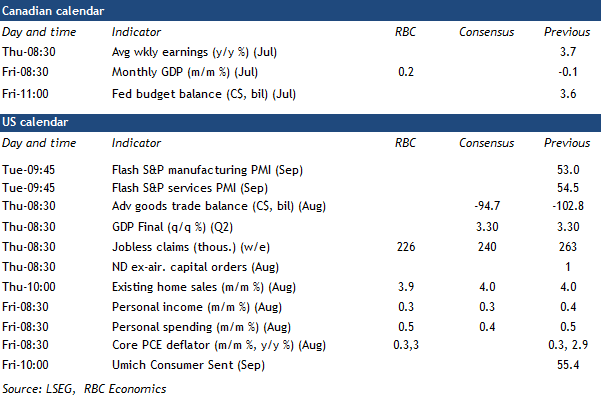
Canada’s gross domestic product for July on Thursday will take center stage as early readings suggest the contraction in Q2 growth was not likely repeated in Q3.
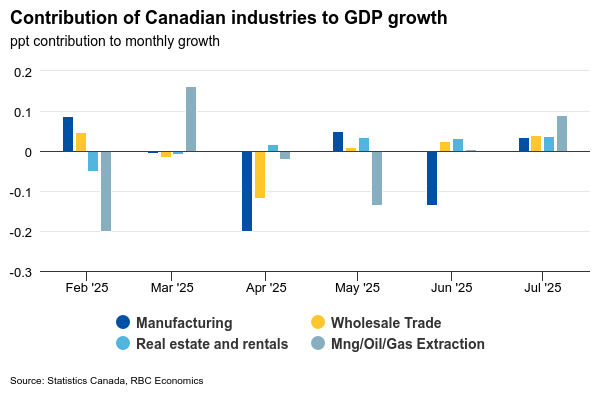
We expect GDP to post a 0.2% increase in July, modestly surpassing Statistics Canada's preliminary estimate of a 0.1% rise. This would mark a welcome rebound following three consecutive months of declines.
Canadian export and manufacturing sale volumes rose in July by 0.7% and 1.6%, respectively, after declining sharply in Q2. Early data is pointing to another increase in oil production in Alberta as activity continues to recover from wildfire-related disruptions in May.
Wholesale volumes rose for a third straight month in July—up 0.8% from June and 3% from a year ago—and home resales rose almost 4%. Retail sales softened to partially retrace a jump in June but the August advance estimate pointed to a 1% rebound. Overall, service sector production appears to have advanced slightly faster than in the previous month in July.
Employment declined sharply in July (-41,000), but hours worked fell less (-0.2%) and are still tracking above their Q2 averages through August. This aligns with our expectations for modest GDP growth in Q3.
It is highly likely that Bank of Canada policymakers expect that additional interest rate cuts will be needed after reducing the overnight rate for the first time since March in September. But, further reductions are also more contingent than usual on more softness in economic data.
Our tracking for GDP growth in early Q3 is not significantly different than the BoC’s, but its decision to cut again (or not) in October will depend heavily on early October trade and labour market data, as well as the results from the BoC’s Business Outlook Survey.
Week ahead data watch:
U.S. personal spending likely edged up by another 0.5%, following a similar pace in July and consistent with the +0.6% gain in August retail sales. Unit auto sales inched lower during that month, offsetting some of the price-related increases at the pump.
We expect U.S. personal income to rise by 0.3%, slightly slower than the pace in July, largely aligning with the stagnant wage growth reported in the earlier nonfarm payroll report.
Summary 9/22 – 9/26
Monday, Sep 22, 2025
| GMT | Ccy | Events | Consensus | Previous |
|---|---|---|---|---|
| 01:00 | CNY | 1-Y Loan Prime Rate | 3.00% | 3.00% |
| 01:00 | CNY | 5-Y Loan Prime Rate | 3.50% | 3.50% |
| 12:30 | CAD | Raw Material Price Index Aug | 0.90% | 0.30% |
| 12:30 | CAD | Industrial Product Price M/M Aug | 1.20% | 0.70% |
| 14:00 | EUR | Eurozone Consumer Confidence Sep P | -15 | -16 |
| 23:00 | AUD | Manufacturing PMI Sep P | 53 | |
| 23:00 | AUD | Services PMI Sep P | 55.8 |
| GMT | Ccy | Events | |
|---|---|---|---|
| 01:00 | CNY | 1-Y Loan Prime Rate | |
| Forecast: 3.00% | Previous: 3.00% | ||
| 01:00 | CNY | 5-Y Loan Prime Rate | |
| Forecast: 3.50% | Previous: 3.50% | ||
| 12:30 | CAD | Raw Material Price Index Aug | |
| Forecast: 0.90% | Previous: 0.30% | ||
| 12:30 | CAD | Industrial Product Price M/M Aug | |
| Forecast: 1.20% | Previous: 0.70% | ||
| 14:00 | EUR | Eurozone Consumer Confidence Sep P | |
| Forecast: -15 | Previous: -16 | ||
| 23:00 | AUD | Manufacturing PMI Sep P | |
| Forecast: | Previous: 53 | ||
| 23:00 | AUD | Services PMI Sep P | |
| Forecast: | Previous: 55.8 | ||
Tuesday, Sep 23, 2025
| GMT | Ccy | Events | Consensus | Previous |
|---|---|---|---|---|
| 07:15 | EUR | France Manufacturing PMI Sep P | 50.5 | 50.4 |
| 07:15 | EUR | France Services PMI Sep P | 49.7 | 49.8 |
| 07:30 | EUR | Germany Manufacturing PMI Sep P | 50.1 | 49.8 |
| 07:30 | EUR | Germany Services PMI Sep P | 49.5 | 49.3 |
| 08:00 | EUR | Eurozone Manufacturing PMI Sep P | 50.8 | 50.7 |
| 08:00 | EUR | Eurozone Services PMI Sep P | 50.2 | 50.5 |
| 08:30 | GBP | Manufacturing PMI Sep P | 47.2 | 47 |
| 08:30 | GBP | Services PMI Sep P | 53.6 | 54.2 |
| 12:30 | CAD | New Housing Price Index M/M Aug | 0.00% | -0.10% |
| 12:30 | USD | Current Account (USD) Q2 | -270B | -450.2B |
| 13:45 | USD | Manufacturing PMI Sep P | 51.6 | 53 |
| 13:45 | USD | Services PMI Sep P | 53 | 54.5 |
| GMT | Ccy | Events | |
|---|---|---|---|
| 07:15 | EUR | France Manufacturing PMI Sep P | |
| Forecast: 50.5 | Previous: 50.4 | ||
| 07:15 | EUR | France Services PMI Sep P | |
| Forecast: 49.7 | Previous: 49.8 | ||
| 07:30 | EUR | Germany Manufacturing PMI Sep P | |
| Forecast: 50.1 | Previous: 49.8 | ||
| 07:30 | EUR | Germany Services PMI Sep P | |
| Forecast: 49.5 | Previous: 49.3 | ||
| 08:00 | EUR | Eurozone Manufacturing PMI Sep P | |
| Forecast: 50.8 | Previous: 50.7 | ||
| 08:00 | EUR | Eurozone Services PMI Sep P | |
| Forecast: 50.2 | Previous: 50.5 | ||
| 08:30 | GBP | Manufacturing PMI Sep P | |
| Forecast: 47.2 | Previous: 47 | ||
| 08:30 | GBP | Services PMI Sep P | |
| Forecast: 53.6 | Previous: 54.2 | ||
| 12:30 | CAD | New Housing Price Index M/M Aug | |
| Forecast: 0.00% | Previous: -0.10% | ||
| 12:30 | USD | Current Account (USD) Q2 | |
| Forecast: -270B | Previous: -450.2B | ||
| 13:45 | USD | Manufacturing PMI Sep P | |
| Forecast: 51.6 | Previous: 53 | ||
| 13:45 | USD | Services PMI Sep P | |
| Forecast: 53 | Previous: 54.5 | ||
Wednesday, Sep 24, 2025
| GMT | Ccy | Events | Consensus | Previous |
|---|---|---|---|---|
| 00:30 | JPY | Manufacturing PMI Sep P | 50.2 | 49.7 |
| 00:30 | JPY | Services PMI Sep P | 53.1 | |
| 01:30 | AUD | Monthly CPI Y/Y Aug | 2.80% | 2.80% |
| 08:00 | CHF | UBS Economic Expectations Sep | -53.8 | |
| 08:00 | EUR | Germany IFO Business Climate Sep | 89.5 | 89 |
| 08:00 | EUR | Germany IFO Current Assessment Sep | 86.6 | 86.4 |
| 08:00 | EUR | Germany IFO Expectations Sep | 92 | 91.6 |
| 14:00 | USD | New Homeles M/M Aug | 650K | 652K |
| 14:30 | USD | Crude Oil Inventories (Sep 19) | -9.3M | |
| 23:50 | JPY | BoJ Minutes | ||
| 23:50 | JPY | Corporate Service Price Index Y/Y Aug | 2.90% | 2.90% |
| GMT | Ccy | Events | |
|---|---|---|---|
| 00:30 | JPY | Manufacturing PMI Sep P | |
| Forecast: 50.2 | Previous: 49.7 | ||
| 00:30 | JPY | Services PMI Sep P | |
| Forecast: | Previous: 53.1 | ||
| 01:30 | AUD | Monthly CPI Y/Y Aug | |
| Forecast: 2.80% | Previous: 2.80% | ||
| 08:00 | CHF | UBS Economic Expectations Sep | |
| Forecast: | Previous: -53.8 | ||
| 08:00 | EUR | Germany IFO Business Climate Sep | |
| Forecast: 89.5 | Previous: 89 | ||
| 08:00 | EUR | Germany IFO Current Assessment Sep | |
| Forecast: 86.6 | Previous: 86.4 | ||
| 08:00 | EUR | Germany IFO Expectations Sep | |
| Forecast: 92 | Previous: 91.6 | ||
| 14:00 | USD | New Homeles M/M Aug | |
| Forecast: 650K | Previous: 652K | ||
| 14:30 | USD | Crude Oil Inventories (Sep 19) | |
| Forecast: | Previous: -9.3M | ||
| 23:50 | JPY | BoJ Minutes | |
| Forecast: | Previous: | ||
| 23:50 | JPY | Corporate Service Price Index Y/Y Aug | |
| Forecast: 2.90% | Previous: 2.90% | ||
Thursday, Sep 25, 2025
| GMT | Ccy | Events | Consensus | Previous |
|---|---|---|---|---|
| 06:00 | EUR | Germany GfK Consumer Confidence Oct | -23.3 | -23.6 |
| 07:30 | CHF | SNB Interest Rate Decision | 0.00% | 0.00% |
| 08:00 | CHF | SNB Press Conference | ||
| 08:00 | EUR | Eurozone M3 Money Supply Y/Y Aug | 3.40% | 3.40% |
| 12:30 | USD | Initial Jobless Claims (Sep 19) | 240K | 231K |
| 12:30 | USD | GDP Annualized Q2 F | 3.30% | 3.30% |
| 12:30 | USD | GDP Price Index Q2 F | 2% | 2% |
| 12:30 | USD | Goods Trade Balance (USD) Aug P | -95.2B | -103.9B |
| 12:30 | USD | Wholele Inventories Aug P | 0.10% | 0.10% |
| 12:30 | USD | Durable Goods Orders Aug | -0.50% | -2.80% |
| 12:30 | USD | Durable Goods Orders ex Transport Aug | -0.10% | 1.00% |
| 14:00 | USD | Existing Home Sales Aug | 3.98M | 4.01M |
| 14:30 | USD | Natural Gas Storage (Sep 19) | 90B | |
| 23:30 | JPY | Tokyo CPI Y/Y Sep | 2.60% | |
| 23:30 | JPY | Tokyo CPI Core Y/Y Sep | 2.80% | 2.50% |
| 23:30 | JPY | Tokyo CPI Core-Core Y/Y Sep | 3% |
| GMT | Ccy | Events | |
|---|---|---|---|
| 06:00 | EUR | Germany GfK Consumer Confidence Oct | |
| Forecast: -23.3 | Previous: -23.6 | ||
| 07:30 | CHF | SNB Interest Rate Decision | |
| Forecast: 0.00% | Previous: 0.00% | ||
| 08:00 | CHF | SNB Press Conference | |
| Forecast: | Previous: | ||
| 08:00 | EUR | Eurozone M3 Money Supply Y/Y Aug | |
| Forecast: 3.40% | Previous: 3.40% | ||
| 12:30 | USD | Initial Jobless Claims (Sep 19) | |
| Forecast: 240K | Previous: 231K | ||
| 12:30 | USD | GDP Annualized Q2 F | |
| Forecast: 3.30% | Previous: 3.30% | ||
| 12:30 | USD | GDP Price Index Q2 F | |
| Forecast: 2% | Previous: 2% | ||
| 12:30 | USD | Goods Trade Balance (USD) Aug P | |
| Forecast: -95.2B | Previous: -103.9B | ||
| 12:30 | USD | Wholele Inventories Aug P | |
| Forecast: 0.10% | Previous: 0.10% | ||
| 12:30 | USD | Durable Goods Orders Aug | |
| Forecast: -0.50% | Previous: -2.80% | ||
| 12:30 | USD | Durable Goods Orders ex Transport Aug | |
| Forecast: -0.10% | Previous: 1.00% | ||
| 14:00 | USD | Existing Home Sales Aug | |
| Forecast: 3.98M | Previous: 4.01M | ||
| 14:30 | USD | Natural Gas Storage (Sep 19) | |
| Forecast: | Previous: 90B | ||
| 23:30 | JPY | Tokyo CPI Y/Y Sep | |
| Forecast: | Previous: 2.60% | ||
| 23:30 | JPY | Tokyo CPI Core Y/Y Sep | |
| Forecast: 2.80% | Previous: 2.50% | ||
| 23:30 | JPY | Tokyo CPI Core-Core Y/Y Sep | |
| Forecast: | Previous: 3% | ||
Friday, Sep 26, 2025
| GMT | Ccy | Events | Consensus | Previous |
|---|---|---|---|---|
| 12:30 | CAD | GDP M/M Jul | 0.10% | -0.10% |
| 12:30 | USD | Personal Income M/M Aug | 0.30% | 0.40% |
| 12:30 | USD | Personal Spending Aug | 0.50% | 0.50% |
| 12:30 | USD | PCE Price Index M/M Aug | 0.30% | 0.20% |
| 12:30 | USD | PCE Price Index Y/Y Aug | 2.70% | 2.70% |
| 12:30 | USD | Core PCE Price Index M/M Aug | 0.20% | 0.30% |
| 12:30 | USD | Core PCE Price Index Y/Y Aug | 2.90% | 2.90% |
| 14:00 | USD | UoM Consumer Sentiment Sep F | 55.4 | 55.4 |
| 14:00 | USD | UoM 1-Yr Inflation Expectations Sep F | 4.80% | 4.80% |
| GMT | Ccy | Events | |
|---|---|---|---|
| 12:30 | CAD | GDP M/M Jul | |
| Forecast: 0.10% | Previous: -0.10% | ||
| 12:30 | USD | Personal Income M/M Aug | |
| Forecast: 0.30% | Previous: 0.40% | ||
| 12:30 | USD | Personal Spending Aug | |
| Forecast: 0.50% | Previous: 0.50% | ||
| 12:30 | USD | PCE Price Index M/M Aug | |
| Forecast: 0.30% | Previous: 0.20% | ||
| 12:30 | USD | PCE Price Index Y/Y Aug | |
| Forecast: 2.70% | Previous: 2.70% | ||
| 12:30 | USD | Core PCE Price Index M/M Aug | |
| Forecast: 0.20% | Previous: 0.30% | ||
| 12:30 | USD | Core PCE Price Index Y/Y Aug | |
| Forecast: 2.90% | Previous: 2.90% | ||
| 14:00 | USD | UoM Consumer Sentiment Sep F | |
| Forecast: 55.4 | Previous: 55.4 | ||
| 14:00 | USD | UoM 1-Yr Inflation Expectations Sep F | |
| Forecast: 4.80% | Previous: 4.80% | ||
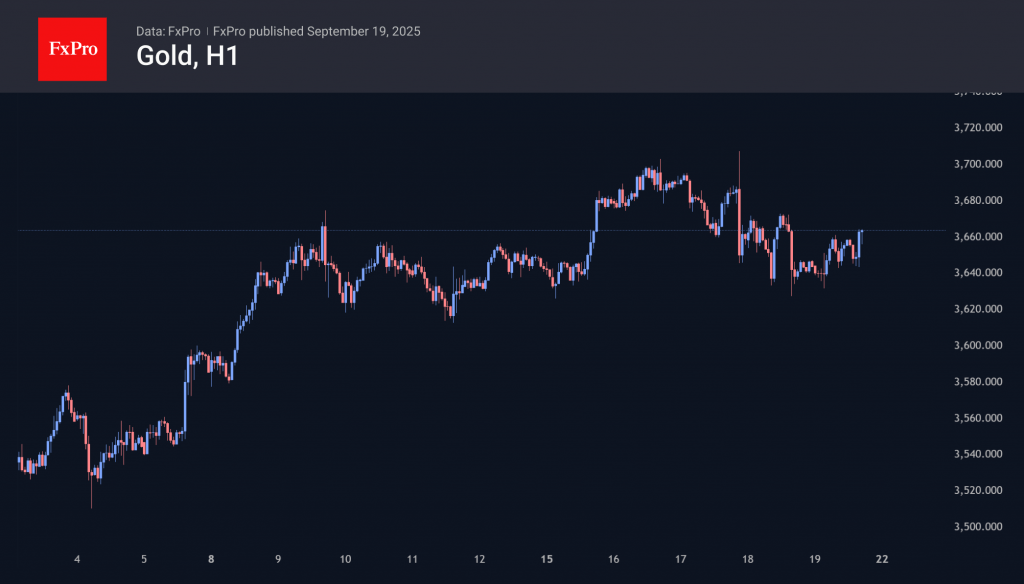
Gold: Sell-the-Fact pattern still in play
Gold hit three dozen record highs in 2025 and exceeded $3700 per ounce for the first time in history. The precious metal surpassed its inflation-adjusted record set in 1980 and has risen by more than 40% since the beginning of January. This has rarely happened, even during times of global economic crisis and pandemic. Only in 1979, against the backdrop of turmoil in the energy markets and stagflation in the US, was the increase greater than +140%.
Central banks continue to buy bullion as part of the process of de-dollarisation and diversification of gold and foreign exchange reserves. ETF stocks have grown by 43% since the beginning of the year. In terms of value, they have reached a record high. Precious metals are benefiting from a favourable background of falling Treasury yields and a weakening US dollar due to the Fed’s renewed cycle of monetary expansion.
At the same time, however, we note that following the Fed’s decision, the dollar began to rise, and gold began to fall, closing the week near its starting level of $3,650, in contrast to new record highs for stock indices. Markets are temporarily selling gold and buying dollars to buy US stocks.
If this is not the beginning of a new wave of dollar strengthening against fundamental factors, then gold may return to growth in the coming weeks after some shakeout. At the same time, in the short term, the balance of risks is still on the downside. This is not least due to new hopes for a settlement of tariff disputes with China and India, which gold has always offset with declines.