Sample Category Title
EUR/CHF Daily Outlook
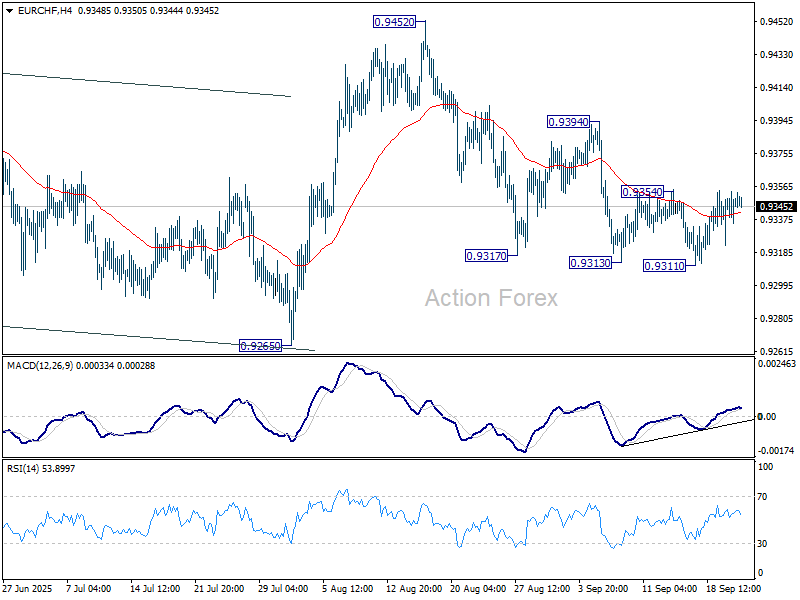
Daily Pivots: (S1) 0.9337; (P) 0.9346; (R1) 0.9362; More...
Sideway trading continues in EUR/CHF and intraday bias remains neutral. Considering bullish convergence condition in 4H MACD, firm break of 0.9354 resistance will confirm short term bottoming, and bring stronger rebound to 0.9394 resistance. On the downside, break of 0.9311 will resume the fall from 0.9452 to 0.9265 support.
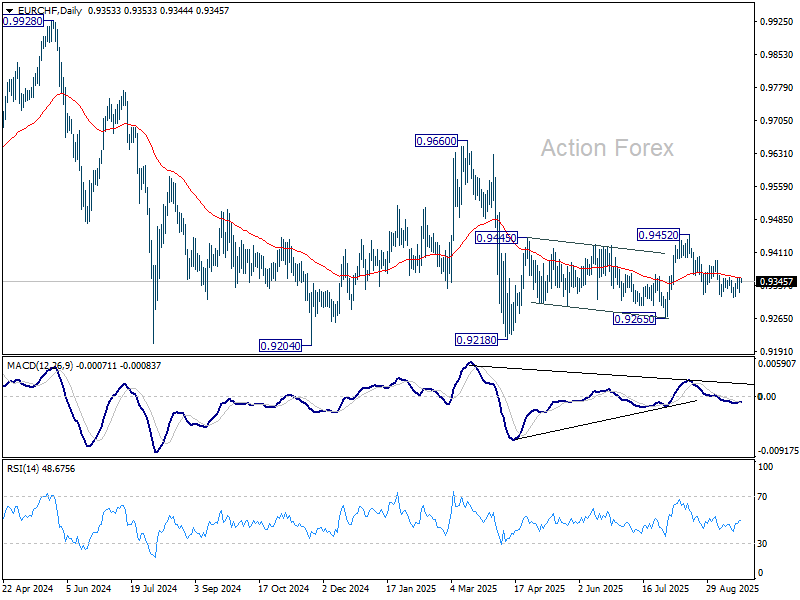
In the bigger picture, the down trend from 0.9204 (2018 high) might still be in progress considering that EUR/CHF is staying well inside the long term falling channel. However, with bullish convergence condition in W MACD, downside potential should be limited in case of another fall. Instead, firm break of 0.9660 resistance will be an important sign of medium term bullish trend reversal.
GBP/JPY Daily Outlook
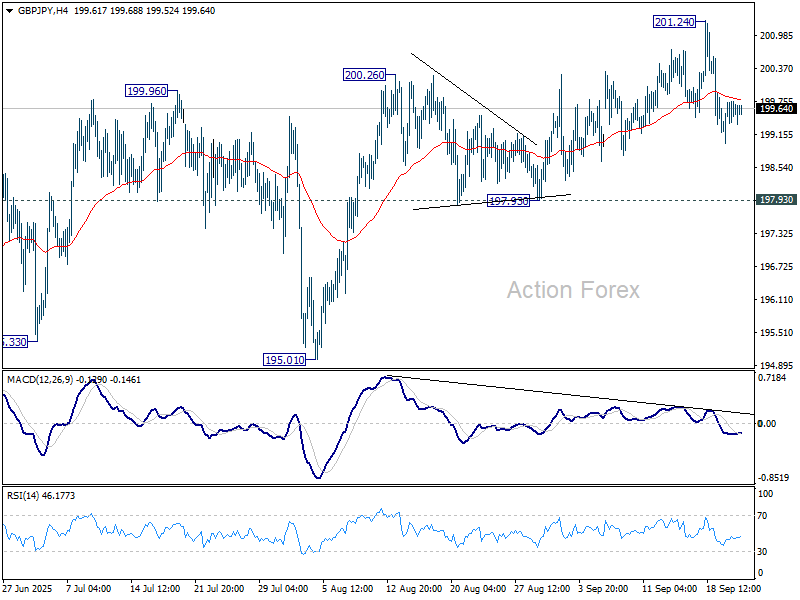
Daily Pivots: (S1) 199.27; (P) 199.53; (R1) 199.89; More...
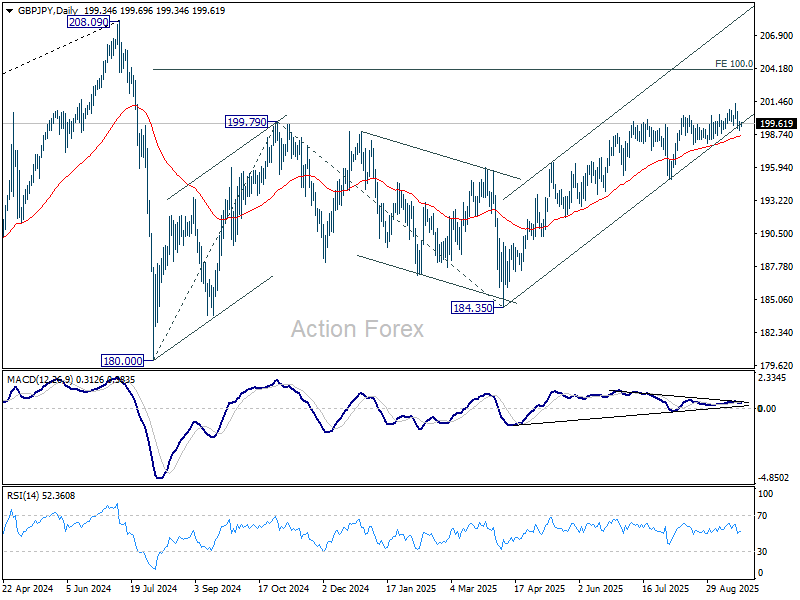
GBP/JPY is staying in consolidations below 201.24 and intraday bias remains neutral. Further rise is expected as long as 197.93 support holds. Firm break of 201.24 will target 100% projection of 180.00 to 199.79 from 184.35 at 204.14. However, considering bearish divergence condition in both D and 4H MACD, firm break of 197.93 will indicate bearish reversal and bring deeper fall back to 195.01 support first.
In the bigger picture, price actions from 208.09 (2024 high) are seen as a correction to rally from 123.94 (2020 low). The pattern might still extend with another falling leg. But in that case, strong support should be seen from 38.2% retracement of 123.94 to 208.09 at 175.94 to contain downside. Meanwhile, decisive break of 208.09 will confirm long term up trend resumption.
EUR/JPY Daily Outlook
Daily Pivots: (S1) 173.91; (P) 174.15; (R1) 174.61; More...
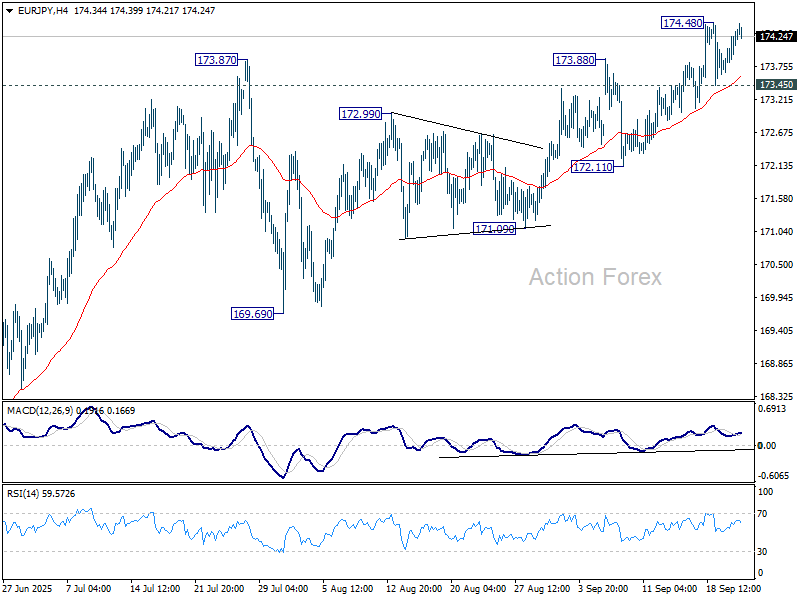
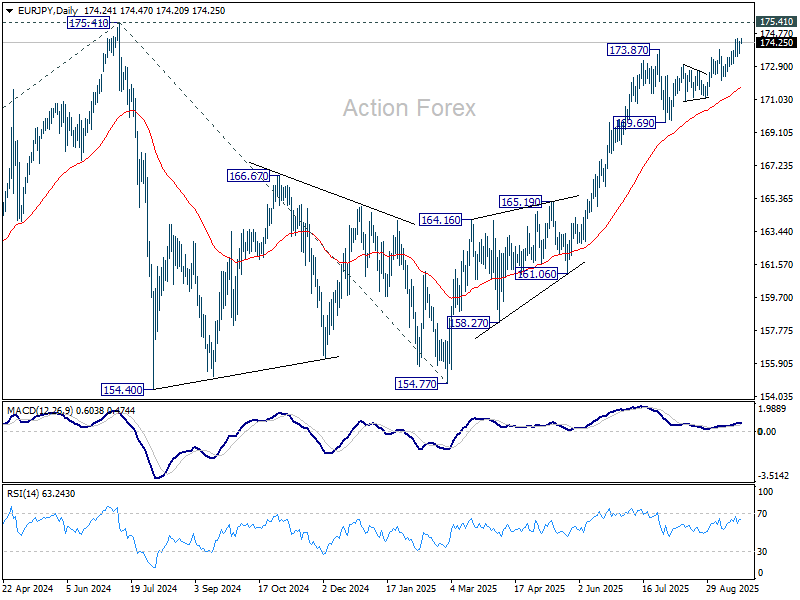
Intraday bias in EUR/JPY stays neutral and more consolidations could be seen. Further rise is expected as long as 173.45 minor support holds. Above 174.48 will target a retest on 175.41 high. However, firm break of 173.45 will turn bias back to the downside for deeper pullback to 172.11 support instead.
In the bigger picture, current rally from 154.77 is still tentatively seen as resuming the larger up trend. Firm break of 175.41 (2024 high) will confirm and target 61.8% projection of 124.37 (2022 low) to 175.41 from 154.77 (2025 low) at 186.31. However, sustained break of 169.69 support will delay this bullish case, and probably extend the correction from 175.41 with another fall.
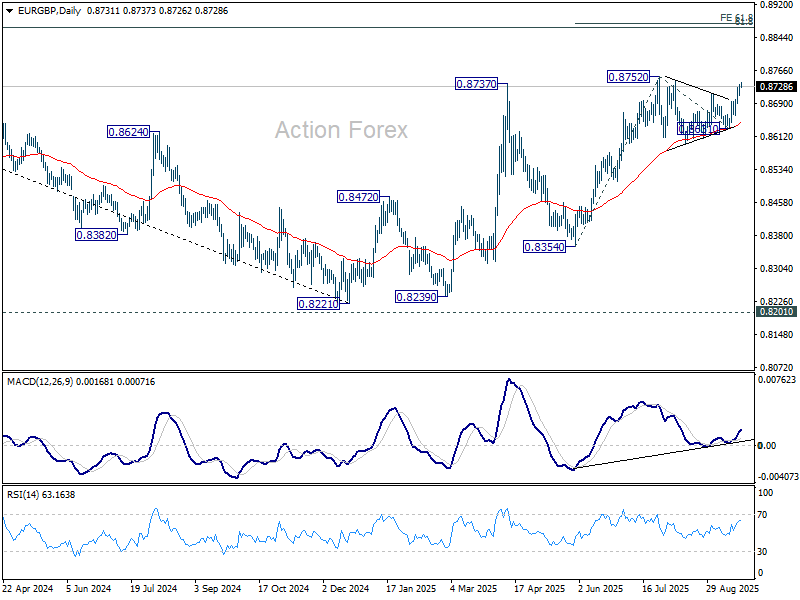
EUR/GBP Daily Outlook
Daily Pivots: (S1) 0.8717; (P) 0.8726; (R1) 0.8743; More...
EUR/GBP's rally from 0.8631 is in progress and intraday bias stays on the upside for retesting 0.8752. Firm break there will resume larger rally to 61.8% projection of 0.8354 to 0.8752 from 0.8631 at 0.8877, which is close to 0.8867 fibonacci level. On the downside, though, below 0.8694 minor support will turn bias neutral first.
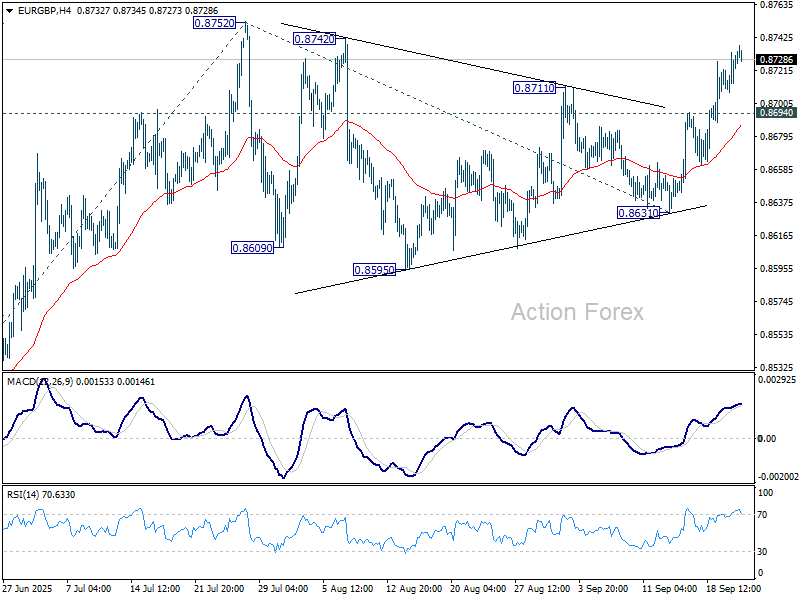
In the bigger picture, the structure from 0.8221 medium term bottom are not impulsive enough to suggest that it's reversing the down trend from 0.9267 (2022 high). But even if it's a correction, further rise could still be seen to 61.8% retracement of 0.9267 to 0.8221 at 0.8867. Nevertheless, sustained trading below 55 W EMA (now at 0.8518) will argue that the pattern has completed and bring retest of 0.8221 low.
Holy Nvidia
Every time you think the AI rally has topped out, it finds another gear. Yesterday was one of those days... Nvidia surged nearly 4% to a fresh ATH after reports that it will deepen its partnership with OpenAI to build massive new data centers and AI infrastructure. We’re talking about a capacity of around 10 gigawatts – roughly the output of 10 large nuclear reactors – it is HUGE. So basically, OpenAI will need to buy an enormous amount of Nvidia chips to make this happen, and Nvidia is making sure it has a seat at the table. It’s a genius move. It will not only help them sell more chips to one of the world’s most famous – if not the most famous – AI chatbot makers, but it also ties them closer to OpenAI’s future. Investors loved the idea. Nvidia rallied nearly 4% and hit a fresh ATH on the news – and proved again that the company constantly finds ways to cooperate, integrate, navigate political and geopolitical jungles with grace and make its way through. Holy Nvidia. It is now worth nearly $4.5 trillion.
Anyway, Oracle did even better yesterday – with a more than 6% rally – on news that they will rebuild and secure the new US version of TikTok’s algorithm.
As such, the technology rally led the major US indices to fresh ATHs yesterday. The S&P 500 extended gains while the Nasdaq 100 is less than 250 points away from the 25K psychological mark. Yet the non-tech names look a bit less cheery – with the equal-weighted version of the S&P 500 trading flat, and European carmakers tanking as Porsche and VW cut their outlook for the year.
In the bond space, the US 2-year yield rebounded past 3.60% even after Trump-linked economist Stephen Miran – now in the headlines for his push for lower rates – argued that the neutral rate is much lower than current levels and that he would cut rates by 150bp very quickly to get there. He even added that such a move wouldn’t be “panic,” while a 75bp cut would be. The kind of comments that are so far-stretched they can’t be taken seriously enough to shift market expectations. Proof? The 2-year didn’t budge – on the contrary, it went higher. That’s a sign that lowering rates wouldn’t necessarily bring down long-term borrowing costs if the size and the speed of easing aren’t warranted. Because lower rates also boost inflation expectations and limit room for further cuts down the road. So Miran is in, and he will be pushing for cuts. The White House is too. But the reality is that the Fed can’t hand out rate cuts like candy at a party. The economic data – growth, jobs and inflation – will matter for market pricing.
Good news is that many Federal Reserve (Fed) members are convinced that the weakening jobs market should be addressed – but carefully, by keeping inflation in mind. And good news is that US core inflation – the Fed’s favourite gauge – is expected to have eased in August. If that’s the case, dovish Fed expectations will continue to weigh enough to keep equity traders on the back of a bull, and the US dollar under pressure. The EURUSD is timidly testing the 1.18 offers, while Cable is flirting with the 1.35 resistance after holding near its 50-DMA yesterday.
Today, investors will have an eye on early PMI data for September. Encouraging eurozone numbers could cement the expectation that the European Central Bank (ECB) won’t need to deliver another cut this year and help euro bulls gain ground, while weak UK numbers could confirm slower activity and fuel worries ahead of the next budget announcement – not expected to be a sweet moment for taxpayers. Fundamentally, the euro benefits from relatively stronger conditions than sterling or the dollar. Therefore, the bullish move in EURGBP is backed by diverging outlooks. For EURUSD and Cable, it’s trickier. The divergence between more hawkish ECB/Bank of England (BoE) vs the Fed is already largely priced in. The long-term outlook for the dollar remains bearish as the US exceptionalism trade wanes. But in the short run, a minor USD rebound is still possible, fueled by yields reminding traders: hey, rates won’t come down that fast.
Interestingly, yesterday’s tech-led rally couldn’t save crypto. Bitcoin lost more than 2% and slipped below its 100-DMA, while altcoins took a heavier hit – Ethereum fell more than 5% and Solana slid over 6%.
Gold, on the other hand, extended its rally to a fresh ATH near $2,600 per ounce, on tense geopolitical risks in Ukraine and Gaza. For Gaza, an increasing number of developed nations are recognizing the state of Palestine, straining relations with Israel and the US – the latest being France. In Europe, meanwhile, countries close to Russia’s border worry that Moscow is testing NATO’s nerves with repeated airspace violations. Surprisingly, oil bulls remain muted despite the rising geopolitical risks. US crude is testing the $62pb support regardless of tensions, hinting that the bears could gain the upper hand and push the price of a barrel to $60/62pb range – and potentially below.
Eyes on EA, UK, and US PMIs
In focus today
Focus turns to the highly important September flash PMI indicator for the euro area (EA), the UK, and the US. For the EA, manufacturing has continued to improve lately while the services sector has softened. We expect this development to have continued in September with EA manufacturing PMIs rising slightly to 50.9, while services are likely to have declined marginally to 50.2. Following better-than-expected growth in the first half of the year, we expect the EA economy to be close to stagnant in the second half of the year with 0.1% q/q growth in both Q3 and Q4. This is in line with PMIs just marginally above the 50-mark.
In Sweden, the Riksbank is set to announce its rate decision. We expect an unchanged policy rate at 2.00%, but that they keep the door open for further easing, aligning with our expectations of a 25bp rate cut to 1.75% in November.
Economic and market news
What happened overnight
France, Luxembourg, Malta, Belgium, and Monaco officially recognised Palestine as a state during a high-level UN event in New York. This adds to the growing list of countries advocating for a two-state solution amidst the ongoing Gaza conflict, despite strong objections from Israel and the US.
What happened yesterday
In the US, White House officials announced progress on the deal to divest TikTok's US operations from its Chinese owner, ByteDance, which will retain less than 20% ownership. The new entity will include investors such as Oracle and Silver Lake, with Oracle managing all US user data on domestic cloud infrastructure. President Trump is expected to certify the deal with an executive order, granting a 120-day enforcement pause to finalise the agreement. While US officials are confident China has approved the deal, Beijing has yet to confirm its position.
A US federal judge ruled in favour of Ørsted, allowing the USD 5bn Revolution Wind project off Rhode Island to resume after a month-long halt ordered by the Trump administration. The court called the halt "arbitrary and capricious," boosting Ørsted's US shares by nearly 9%.
US Treasury Secretary Scott Bessent announced plans for "large and forceful" support for Argentina, including options like swap lines and currency purchases. Actions will follow today's meeting between President Trump and Argentina's President Milei.
Trump's new USD 100,000 H-1B visa fee drew backlash from the tech industry, with critics warning it could hurt start-ups, reduce talent inflow, and weaken US productivity. Some executives, however, praised the focus on high-value roles, while others predicted firms may shift hiring abroad.
In the euro area, consumer confidence rose as expected in September to -14.9 (cons: -15.0) from -15.5. The weak consumer confidence should dampen growth in private consumption, but we do still expect a gradual normalisation in confidence due to real income gains and lower borrowing costs. These factors should also contribute to a modest rise in private consumption the coming year.
In Denmark, consumer confidence continued its decline to -18.7 (prior: -17.2), driven by concerns over personal finances and food price increases despite overall inflation being under control. This contrasts with positive economic indicators like job growth, rising wages, and a strong housing market.
In geopolitics, Russian President Putin proposed a one-year extension of the New START treaty, which limits US and Russian nuclear arsenals, citing global non-proliferation interests. The offer, conditional on US reciprocity, comes amid heightened tensions over Ukraine and as the treaty's expiration in February 2026 approaches.
Equities: US equities were slightly higher on the day, while non-US equities were mixed during a session with little new data. The S&P500 rose 0.4%, while Nasdaq was up 0.7%. European indices were marginally lower at around -0.3%. European consumer confidence was slightly higher than in previous months but remains gloomy, especially in a historical context, as it has yet to recover from the 2022 inflation fallout. That said, the employment expectations were slightly higher in August relative to July, thus pointing to lower unemployment rates.
FI and FX: The US Treasury curve continues its modest selloff with yields edging slightly higher ahead of tonight's speech by Jerome Powell and Friday's important PCE data. EUR/USD found support at 1.1730 and is now back close to 1.18. Small moves with G10 FX overnight, though. Today, the Scandi market is all about Riksbank's rate decision and communication where the money market is pricing in 9bp of cuts. We expect them to stay on hold, which should lend some temporary support to the SEK.
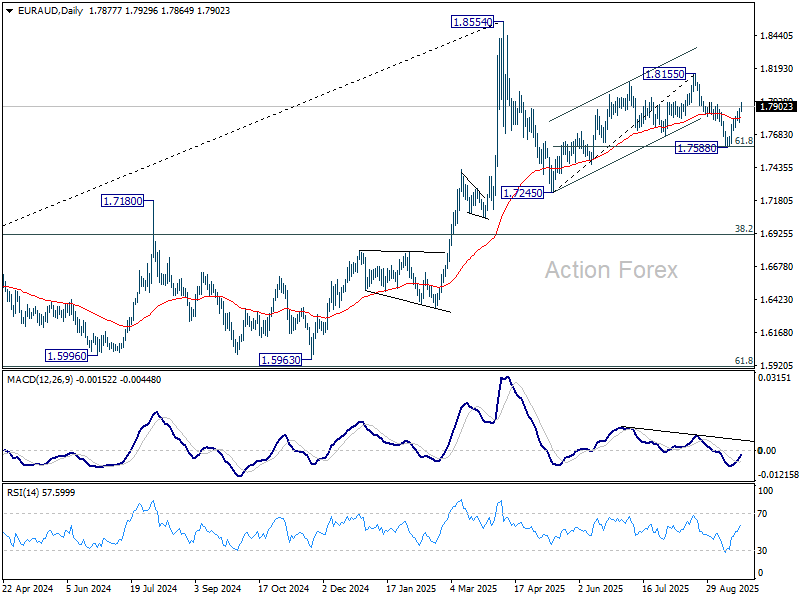
EUR/AUD Daily Outlook
Daily Pivots: (S1) 1.7812; (P) 1.7850; (R1) 1.7916; More...
EUR/AUD's rally from 1.7588 continues today and intraday bias stays on the upside. Further rally should be seen to retest 1.8155 resistance next. Firm break there will resume the whole rise from 1.7245. On the downside, below 1.7781 minor support will turn intraday bias neutral first.
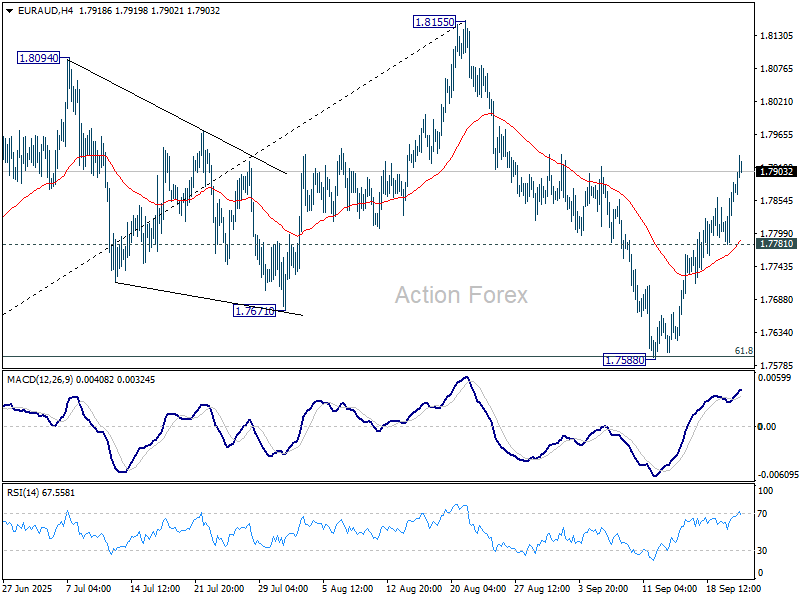
In the bigger picture, price actions from 1.8554 medium term top are seen as a corrective pattern. Deeper fall could be seen as the pattern extends, but downside should be contained by 38.2% retracement of 1.4281 (2022 low) to 1.8554 at 1.6922 to bring rebound. Uptrend from 1.4281 is expected to resume at a later stage.
Aussie, Kiwi Slip on Asia Stock Retreat, PMIs Weigh, Dollar Awaits Fed’s Bowman and Powell
Commodity currencies slipped in quiet trading today, with Aussie and Kiwi leading losses as regional equities pulled back. With Japan on holiday, volumes were thin, but risk sentiment deteriorated after both Chinese and Hong Kong tech stocks retreated from a month-long rally.
Australia’s PMI data added further weight to the currency. The September surveys showed softening momentum in both manufacturing and services, eroding confidence and fueling expectations that growth may be fragile heading into year-end. Markets widely expect the RBA to stand pat next week, but speculation lingers over whether policymakers will signal readiness to cut again in November.
Dollar, meanwhile, traded mixed. Investors are parsing a steady stream of Fed commentary following last week’s 25bps rate cut. New Governor Stephen Miran continued to push for larger moves, but other officials leaned more cautious, stressing that additional cuts are not automatic and depend on data.
Attention now turns to upcoming speeches from other Fed officials, with focus on Governor Michelle Bowman. Markets will be listening for her explanation of why she backed a 25bps reduction but resisted a deeper 50bps move last week. Chair Jerome Powell is also due to speak, though few expect him to deviate from the steady tone he struck just a week ago.
In performance terms, Loonie is the weakest performer so far this week, followed by Kiwi and Aussie. On the other side, Euro leads gains, with Swiss Franc and Sterling also firm. Dollar and Yen are positioned mid-pack. The tilt in momentum now favors Europe.
In Asia, at the time of writing, Hong Kong HSI is down -1.10%. China Shanghai SSE is down -1.22%. Singapore Strait Times is up 0.18%. Japan is on holiday. Overnight, DOW rose 0.14%. S&P 500 rose 0.44%. NASDAQ rose 0.70%. 10-year yield rose 0.004 to 4.122.
Fed’s Miran pushes for aggressive cuts, Bostic and others push back
New Fed Governor Stephen Miran defended his lone call for a 50bps rate cut last week, signaling he would back another such move if given the chance. In a speech overnight, Miran warned that the central bank is underestimating how tight policy is, putting the job market at risk without faster easing.
Miran argued that the appropriate federal funds rate should be in the “mid-2 percent area,” nearly 200 basis points below the current target. He said leaving policy this restrictive risks unnecessary layoffs and higher unemployment, with monetary settings “well into restrictive territory.”
His remarks highlighted the divide inside the FOMC. While Miran sees the economy requiring swift and decisive support, other Fed officials made clear they prefer a slower pace of adjustment.
Atlanta Fed President Raphael Bostic told the Wall Street Journal that inflation remains “too high for a long time” and warned against signaling premature victory. He flatly opposed another cut at the October meeting, indicating that "I today would not be...in favor of it."
Cleveland Fed President Beth Hammack echoed caution, saying the policy rate is only a "short distance to neutral". She warned that removing too much restriction could "start overheating again", urging the Fed to tread carefully, and "stay restrictive to bring inflation back down to target."
St. Louis Fed President Alberto Musalem said he backed last week’s 25bps cut as a "precautionary" measure to support employment but stressed there is only “limited room for easing further” without risking an overly accommodative stance.
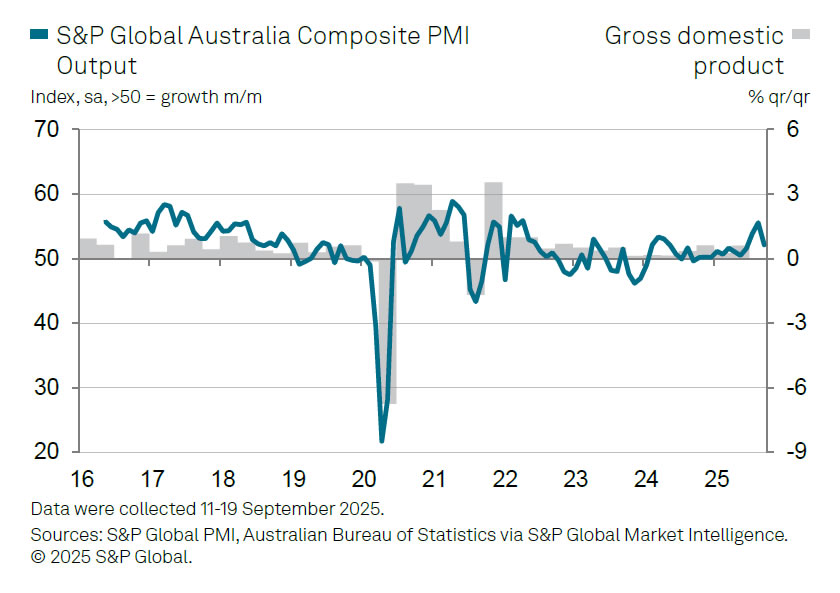
Australia PMI composite hits three-month low at 52.1, confidence slumps
Australia’s private sector momentum slowed sharply in September, with PMI Composite falling from 55.5 to 52.1, its lowest in three months. Manufacturing eased from 53.0 to 51.6, while services slipped more heavily from 55.8 to 52.0, signaling a broad moderation in activity.
S&P Global’s Jingyi Pan noted that new business growth weakened after two strong months, with manufacturing orders slipping back into contraction as U.S. tariffs began to weigh. Export orders also faltered, while overall business confidence dropped to its lowest in a year, hinting at a softer growth outlook into Q4.
The survey did show resilience in employment, with job creation little changed from August. However, selling price inflation remained "at a level that was above the long-run average", and a steep rise in manufacturing cost inflation underscored margin pressures for goods producers.
Gold’s record surge sets sights on 4000; Silver pushes toward 50
Gold and Silver extended their relentless rallies this week, with the former printing fresh record highs and the latter touching its strongest levels since 2011. The moves came despite a rebound in Dollar, highlighting the resilience of demand for safe-haven and strategic asset allocations. Gold is eyeing 4000 level, while Silver is pushing toward 50 mark, both psychologically and technically significant.
Extended inflows from central banks, sovereign wealth funds, and institutional investors remain at the core of the rally. The World Gold Council’s 2025 Central Bank Gold Reserves Survey, released in June, showed that 95% of central bankers expect global reserves to rise this year, with none forecasting a decline. Heightened geopolitical risk is the primary driver, while diversification away from Dollar continues to add impetus.
Silver’s fundamentals have reinforced its performance too. Tight supply conditions have helped maintain upward momentum, while structural demand from solar energy, electric vehicles, and electronics has added another source of resilience. Together, these factors explain why Silver has outpaced Gold in recent weeks.
Technically, there are various interpretations on the price actions since last record high at 3499.79. But in most cases, current up-leg should have started from 3267.90. For now, near term outlook will stay bullish as long as 3627.76 support holds. Next target is 61.8% projection of 2584.24 to 3499.79 from 3267.90 at 3833.70.
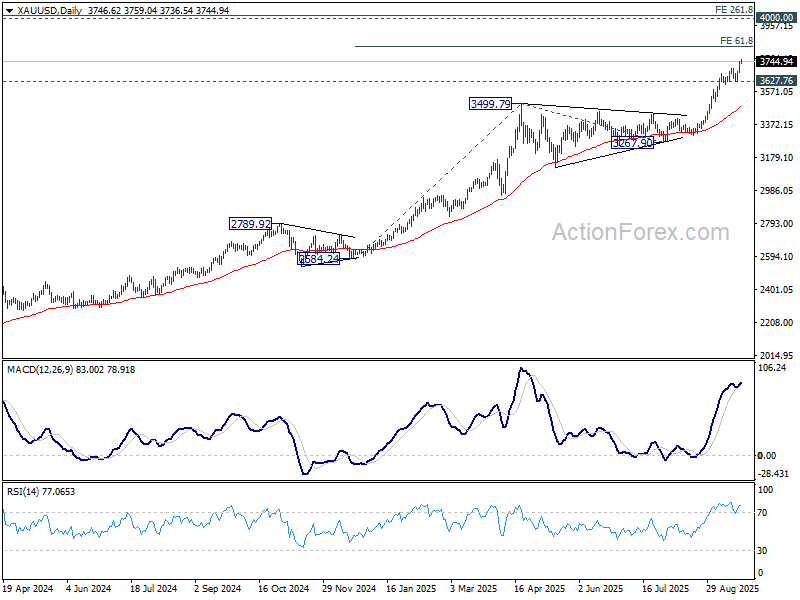
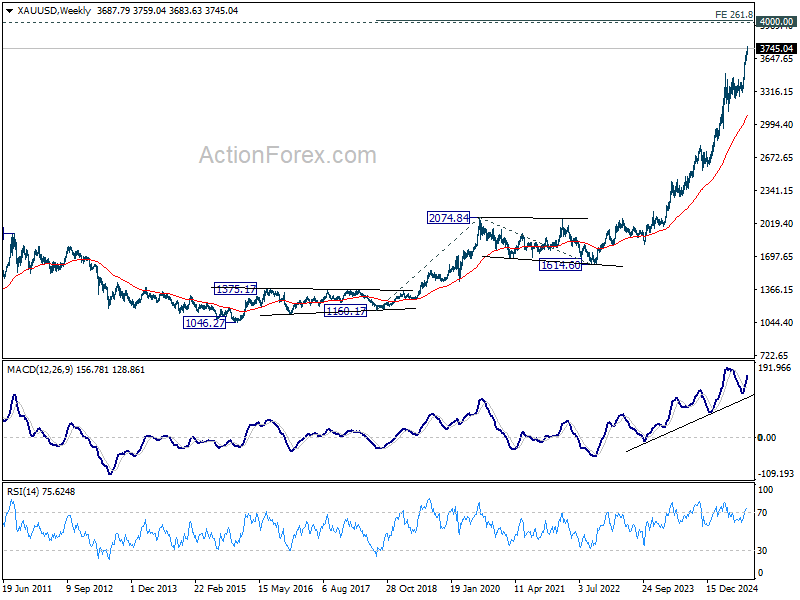
The longer-term picture for Gold is more compelling. The uptrend from 1046.27 (2015 low) is still in acceleration phase. Current rise from 1614.60 is seen as the fifth leg of the rally, targeting 261.8% projection of 1160.17 to 2074.84 from 1614.60 at 4009.20.
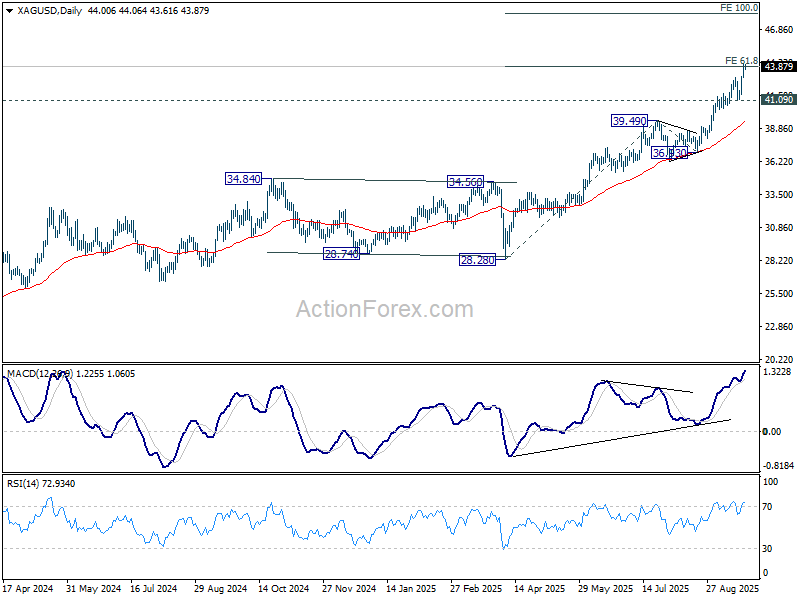
As for Silver, 61.8% projection of 28.28 to 39.49 from 36.93 at 43.85 target is already met and momentum stays strong as seen in D MACD. Outlook will remain bullish as long as 41.09 support holds even in case of retreat. Sustained trading above 43.85 will pave the way to 100% projection at 48.14.
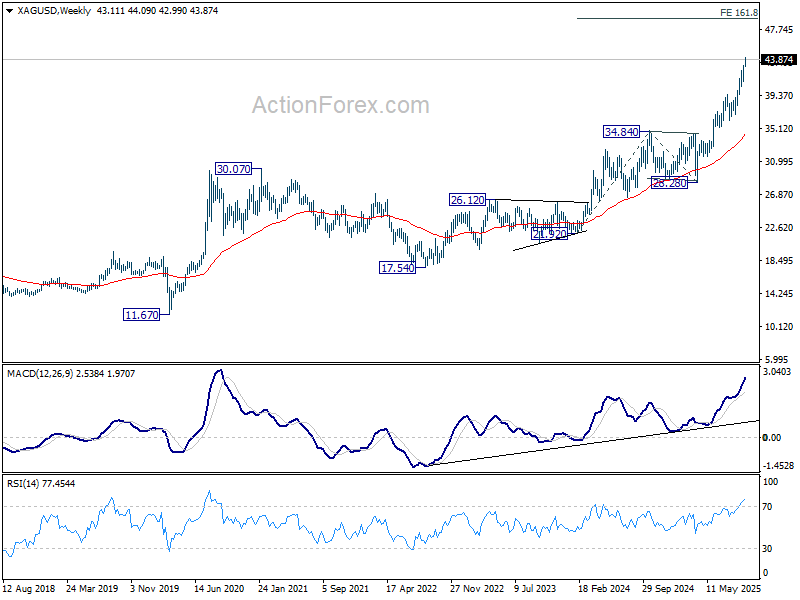
More importantly, as the fifth wave of the rise from 17.54 (2022 low), Silver is on track to 161.8% projection of 21.92 to 34.84 from 28.28 at 49.18 too.
EUR/AUD Daily Outlook
Daily Pivots: (S1) 1.7812; (P) 1.7850; (R1) 1.7916; More...
EUR/AUD's rally from 1.7588 continues today and intraday bias stays on the upside. Further rally should be seen to retest 1.8155 resistance next. Firm break there will resume the whole rise from 1.7245. On the downside, below 1.7781 minor support will turn intraday bias neutral first.
In the bigger picture, price actions from 1.8554 medium term top are seen as a corrective pattern. Deeper fall could be seen as the pattern extends, but downside should be contained by 38.2% retracement of 1.4281 (2022 low) to 1.8554 at 1.6922 to bring rebound. Uptrend from 1.4281 is expected to resume at a later stage.
Gold’s record surge sets sights on 4000; Silver pushes toward 50
Gold and Silver extended their relentless rallies this week, with the former printing fresh record highs and the latter touching its strongest levels since 2011. The moves came despite a rebound in Dollar, highlighting the resilience of demand for safe-haven and strategic asset allocations. Gold is eyeing 4000 level, while Silver is pushing toward 50 mark, both psychologically and technically significant.
Extended inflows from central banks, sovereign wealth funds, and institutional investors remain at the core of the rally. The World Gold Council’s 2025 Central Bank Gold Reserves Survey, released in June, showed that 95% of central bankers expect global reserves to rise this year, with none forecasting a decline. Heightened geopolitical risk is the primary driver, while diversification away from Dollar continues to add impetus.
Silver’s fundamentals have reinforced its performance too. Tight supply conditions have helped maintain upward momentum, while structural demand from solar energy, electric vehicles, and electronics has added another source of resilience. Together, these factors explain why Silver has outpaced Gold in recent weeks.
Technically, there are various interpretations on the price actions since last record high at 3499.79. But in most cases, current up-leg should have started from 3267.90. For now, near term outlook will stay bullish as long as 3627.76 support holds. Next target is 61.8% projection of 2584.24 to 3499.79 from 3267.90 at 3833.70.
The longer-term picture for Gold is more compelling. The uptrend from 1046.27 (2015 low) is still in acceleration phase. Current rise from 1614.60 is seen as the fifth leg of the rally, targeting 261.8% projection of 1160.17 to 2074.84 from 1614.60 at 4009.20.
As for Silver, 61.8% projection of 28.28 to 39.49 from 36.93 at 43.85 target is already met and momentum stays strong as seen in D MACD. Outlook will remain bullish as long as 41.09 support holds even in case of retreat. Sustained trading above 43.85 will pave the way to 100% projection at 48.14.
More importantly, as the fifth wave of the rise from 17.54 (2022 low), Silver is on track to 161.8% projection of 21.92 to 34.84 from 28.28 at 49.18 too.
Australia PMI composite hits three-month low at 52.1, confidence slumps
Australia’s private sector momentum slowed sharply in September, with PMI Composite falling from 55.5 to 52.1, its lowest in three months. Manufacturing eased from 53.0 to 51.6, while services slipped more heavily from 55.8 to 52.0, signaling a broad moderation in activity.
S&P Global’s Jingyi Pan noted that new business growth weakened after two strong months, with manufacturing orders slipping back into contraction as U.S. tariffs began to weigh. Export orders also faltered, while overall business confidence dropped to its lowest in a year, hinting at a softer growth outlook into Q4.
The survey did show resilience in employment, with job creation little changed from August. However, selling price inflation remained "at a level that was above the long-run average", and a steep rise in manufacturing cost inflation underscored margin pressures for goods producers.