

Sample Category Title
China CPI falls -0.4% yoy, core inflation hits 2-1/2 year high
China’s consumer prices slipped deeper into deflation in August, with CPI down -0.4% yoy after July’s flat reading, worse than expectations of -0.2% yoy and the weakest in six months. Food prices were the main drag, falling -4.3% yoy versus -1.6% yoy previously. On a monthly basis, CPI was unchanged, undershooting forecasts for a small 0.1% mom rise.
At the same time, core inflation showed signs of life, rising 0.9% yoy in August compared with 0.8% yoyin July — the fastest pace in two and a half years. The pickup suggests underlying demand in services and other non-food sectors is holding up better than headline numbers imply, even as consumers face falling food costs.
Producer prices continued to contract, though at a slower pace. PPI dropped -2.9% yoy, in line with expectations and an improvement from -3.6% yoy in July. The figures highlight China’s ongoing struggle with persistent factory-gate deflation, which has now lasted nearly three years.
US CPI Preview: Implications for the DXY & Federal Reserve
The CPI outlook looks shaky and this week's print may show a rise of about 0.3% this past month, which could lift the annual rate to roughly 2.9%. Some analysts even think it might hit 3% year‑over‑year.
The boost seems tied to higher food and energy costs. One estimate even points to a 2% jump in gas prices month‑to‑month, therefore pressure stays on and shoppers likely notice higher costs at checkout.
US Core CPI Debate
The real debate, though, centers on core CPI numbers – the ones that leave out the wild food and energy swings. Different analysts see two paths ahead. One camp thinks we’ll see a 0.3 % rise from month to month, which would leave the annual rate stuck around 3.1 %. The other, more cautious group, pictures a 0.4 % jump, the biggest since January and the second biggest in almost two years. That tiny gap between 0.3 and 0.4 isn’t just a math detail; it could change how we read inflation.
A 0.3 increase might still be called “sticky,” yet it could be part of a rough but steady slowdown in price growth. A 0.4 rise, however, seems to signal a clear push back up, shaking the idea that inflation is finally easing.
If that happens, the question is will the Fed change its policy stance? My answer is no but markets would probably react quickly, and investors might demand higher yields on bonds.
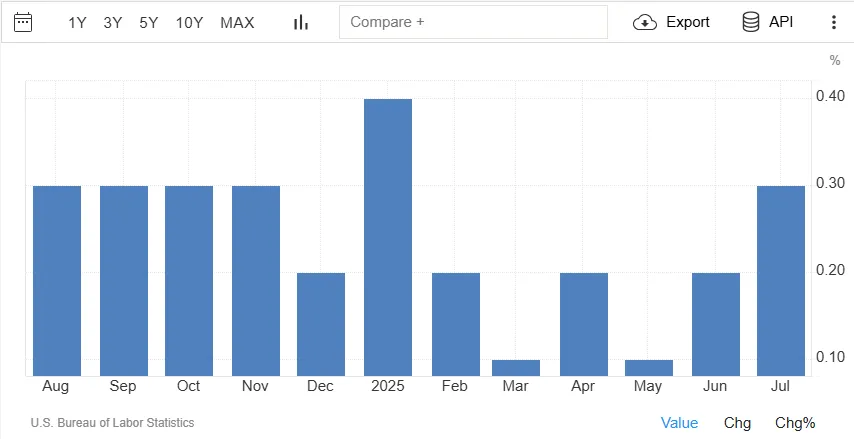
Source: TradingEconomics
Underlying Drivers: Where the Inflationary Pressures Originate
The rise in inflation looks like it will be spread across many items, not just a few. A bounce back in core goods prices may add about 0.25 % from month to month, which could push the annual rate up to its biggest point since May 2023. Parts of this push could be new cars, clothing, sports gear, and even phones or tablets.
At the same time, the hoped‑for relief from slower service inflation appears to be fading. Forecasts suggest core services might go up roughly 0.30 % in August, with travel‑related services—especially hotel costs—showing a strong climb of around 1.0 %. This broader strength in both goods and services therefore hints that price pressures are no longer limited to narrow sectors but may be more rooted in the overall economy.
Policymakers will be watching these trends closely even as the labor market dominates the discussion at the moment.
The Fed’s Policy Puzzle: A Rough Road Ahead
The road ahead for the Federal Reserve is expected to be a bumpy one. Concerns about Fed independence, worsening labor market conditions and political drama will keep the Fed the center of attention for the remainder of 2025.
As things stand, the labor market is going to be the center of focus for now. However, if inflation begins to rise again as tariffs begin to start filtering through and companies pass the increases to consumers, inflation could play a much bigger role later in the year.
Potential Implications for the US Dollar and Rate Cut Expectations
Two things mainly push the dollar when a CPI report comes out. First, interest‑rate gaps – the difference between U.S. Treasury yields and the yields you see in other countries. Those gaps decide where money moves.
Second, Fed‑policy guesses – how people see the chances of the Fed raising or lowering rates. Those guesses shift the gaps. When CPI numbers change what folks expect the Fed will do, they also change how attractive U.S. assets look. That can lift the dollar or drop it.
When the CPI looks “hot” – say the core number is 0.4 % or higher – it hints that inflation is still strong. That may mean the Fed will keep tightening or even go harder. Traders then want more dollars, Treasury yields climb, and the DXY (the dollar index) usually goes up. At the same time, stocks can feel pressure because borrowing costs look higher.
But a “cool” CPI – core 0.3 % or lower – suggests price growth is slowing. The market may turn more dovish, thinking the Fed could pause or cut rates sooner. Lower expected yields make the dollar less tasty, so it often slides down. Treasury yields tend to fall, and risk assets like equities might get a boost from cheaper money.
In short, the dollar’s move is a straight line from CPI‑driven belief changes to interest‑rate gaps, then to the dollar’s strength.
What could happen based on those ideas:
- Hot CPI (core 0.4 %+): Dollar likely goes up against other currencies (DXY climbs); Treasury yields rise; stocks may drop.
- Cool or Neutral CPI (core ≤0.3 %): Dollar may sell off; Treasury yields fall; equities could rally.
If the CPI lands right at the expected 0.3 % core, markets sometimes do a “buy the rumor, sell the fact” trick. If people already priced in a hawkish Fed, the on‑target number can cause a quick, technical dip in the dollar. That shows why the headline number and how it differs from consensus both matter.
So, in the current climate markets are expecting a slight uptick in inflation. Meaning if we do get a softer print, the immediate reaction could see the probability of a 50 bps rate cut on September 17 rise. This will lead to a selloff in the US Dollar but is unlikely to last as markets will likely cool off once the data has been fully digested.
US Equities may attract a lot of interest as they have continued to rise in recent trading sessions. I expect that the volatility we see with US equities will outweigh volatility elsewhere irrespective of whether the data is positive or negative.
US Dollar Index (DXY) Daily Chart, September 9, 2025
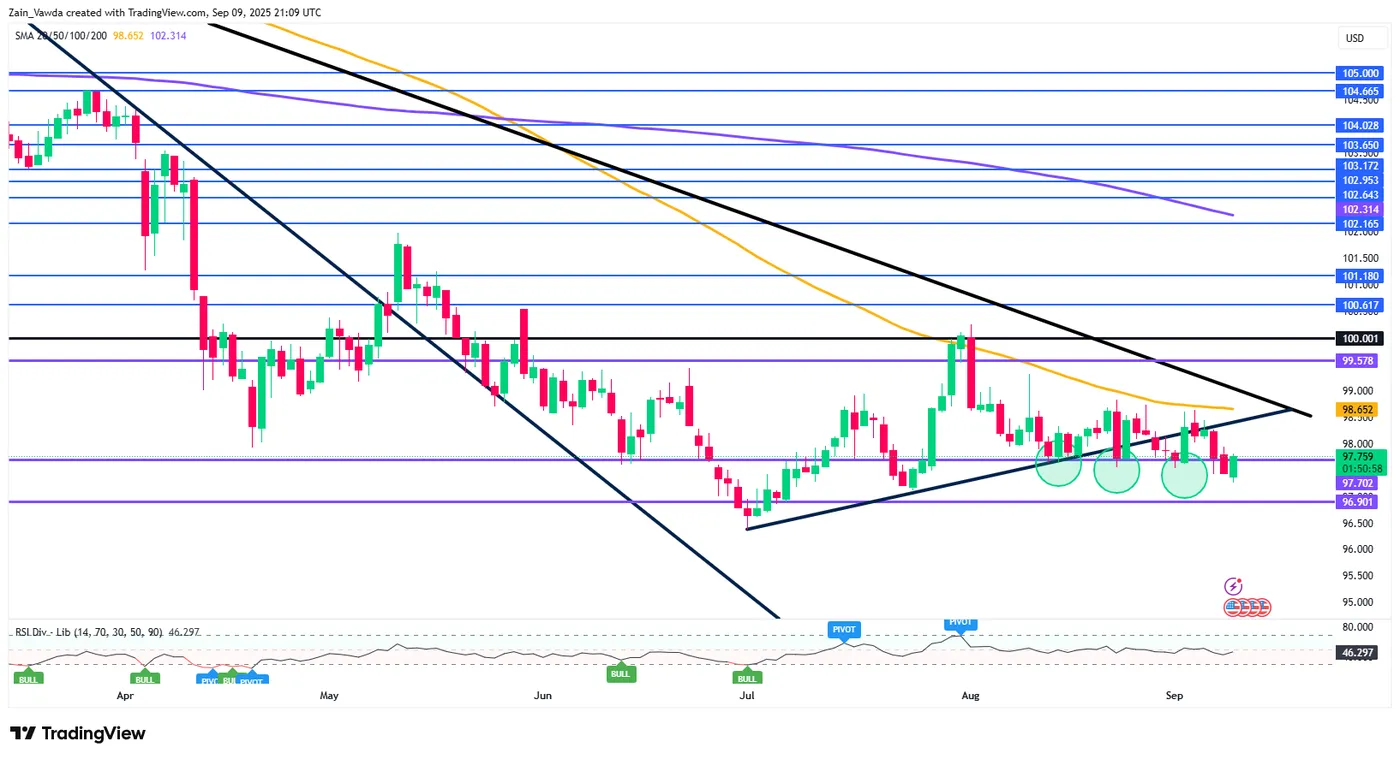
Source: TradingView.com (click to enlarge)
Dollar Index (DXY) Faces Key Test from Upcoming PPI and CPI – Potential Reactions
Some contradicting headlines are influencing the US Dollar in a battle of wits right ahead of quintessential inflation data.
Markets have been unable to provide a clear answer on how the upcoming FOMC (September 17th) and its rate cut expectations will affect the future outlook for the Dollar.
The thesis had been that despite negative news (Jerome Powell's change in tone at Jackson Hole or the recent Non-Farm Payrolls), traders have failed to sell the US Dollar convincingly, with the DXY doomed in sideways action.
The freshly released downward revisioned BLS report (bearish for the USD) and the rising tensions in the Middle East with Israel-Hamas war taking another turn (bullish for the USD) are once again prevented a clear path ahead for the Greenback.
However, some interesting technical patterns might be getting into play as we approach the surely decisive pair of inflation reports in the US PPI (8:30 E.T. tomorrow) and Thursday's CPI report.
Let's take a look at the Dollar Index.
How could the data influence the US Dollar? Potential reactions
The upcoming PPI report should bring back memories of the previous humoungous beat in the past month (0.9% vs 0.2% exp) pushing inflation expectations higher for the consecutive University of Michigan surveys (the FED hates that).
This comes as Participants started to be less and less cocnerned by tariffs and their impact.
Despite hurting producers before consumers, fears are that Producer Prices increases will repercutate in upcoming CPI releases, highlighting Thursday's number even more.
A relatively weak PPI could help to support current sentiment quite largely, indicating that the past month increase was just a one off – This should support a 50 bps cut further (Dollar down).
However an upward beat should do just the reverse and add to the anxiety (Dollar up)
CPI will really be in focus however as Participants look to see if the higher producing costs have started to bite in consumers pockets.
Reactions should be similar to the PPI, but their extent could be much larger: A higher inflation for Consumers should prevent a 50 bps entirely, towards more gradual cut and spark stagflation fears.
US Dollar could hence maintain its sideways movement.
Dollar Index intraday outlook
Dollar Index 4H Chart
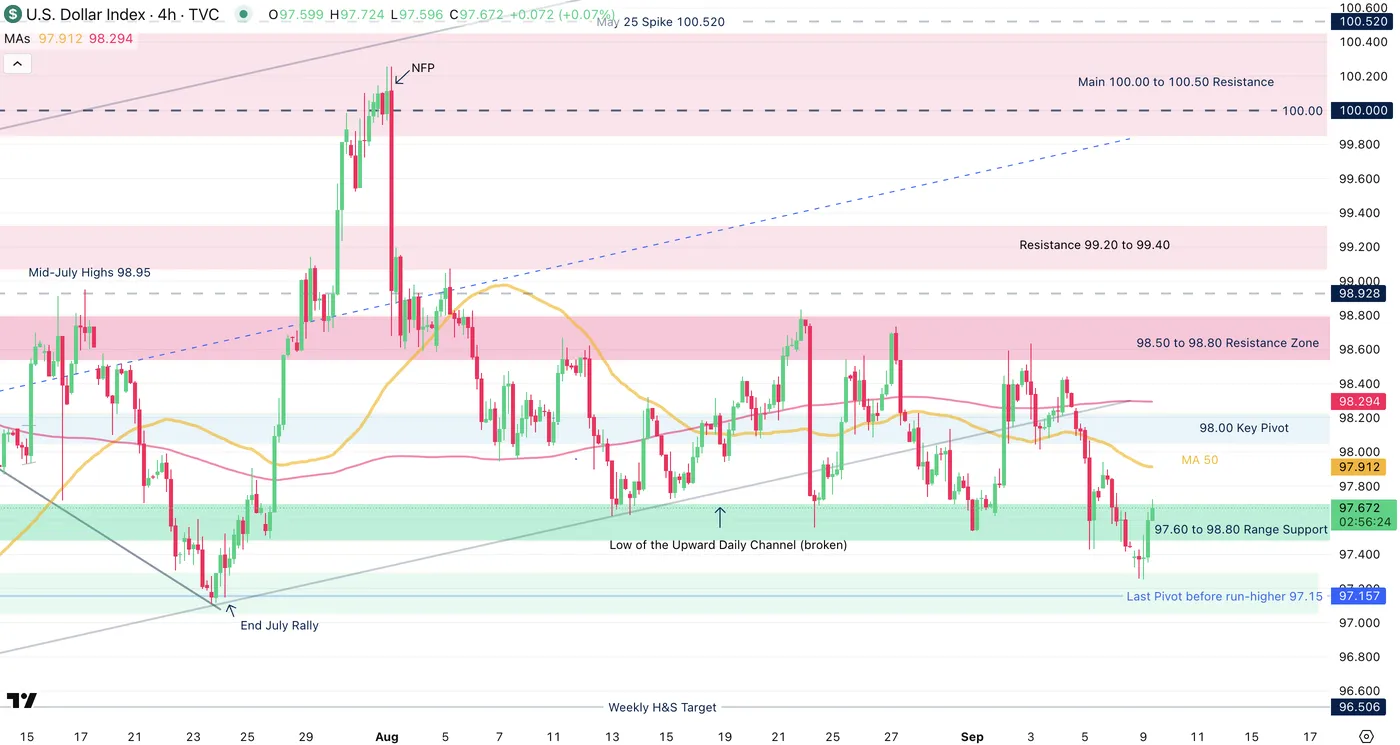
US Dollar Index (DXY) 4H Chart, September 9, 2025 – Source: TradingView
Last week's data has brought some renewed selling momentum as bears have managed to form a downward tight bear channel (bear candles overlapping each other).
The weekly open hence formed a small gap to test the July support/pivot zone, and this morning of action actually saw a decent rebound, undoing some of the bear advantage.
Arriving at a key technical standpoint, bears entering here could take the hand by rejecting the 97.60 to 97.80 range lows (break-retest style).
Keep in mind that action will be swift tomorrow (expect spikes) and prices may just dawdle around until then.
Key levels of interest for the Dollar Index:
Support Levels:
- 97.40 to 97.80 Range Support (currently getting tested)
- Last Pivot before run-higher 97.15 Zone acting as Key Support
- 2025 Lows Major support 96.50 to 97.00
Resistance Levels:
- 98.00 Mid-Range pivot
- 98.50 to 98.80 Resistance Zone
- Mid-line of the ascending channel and psychological level 99.50
- 100.00 Main resistance zone
Dollar Index 30m Chart
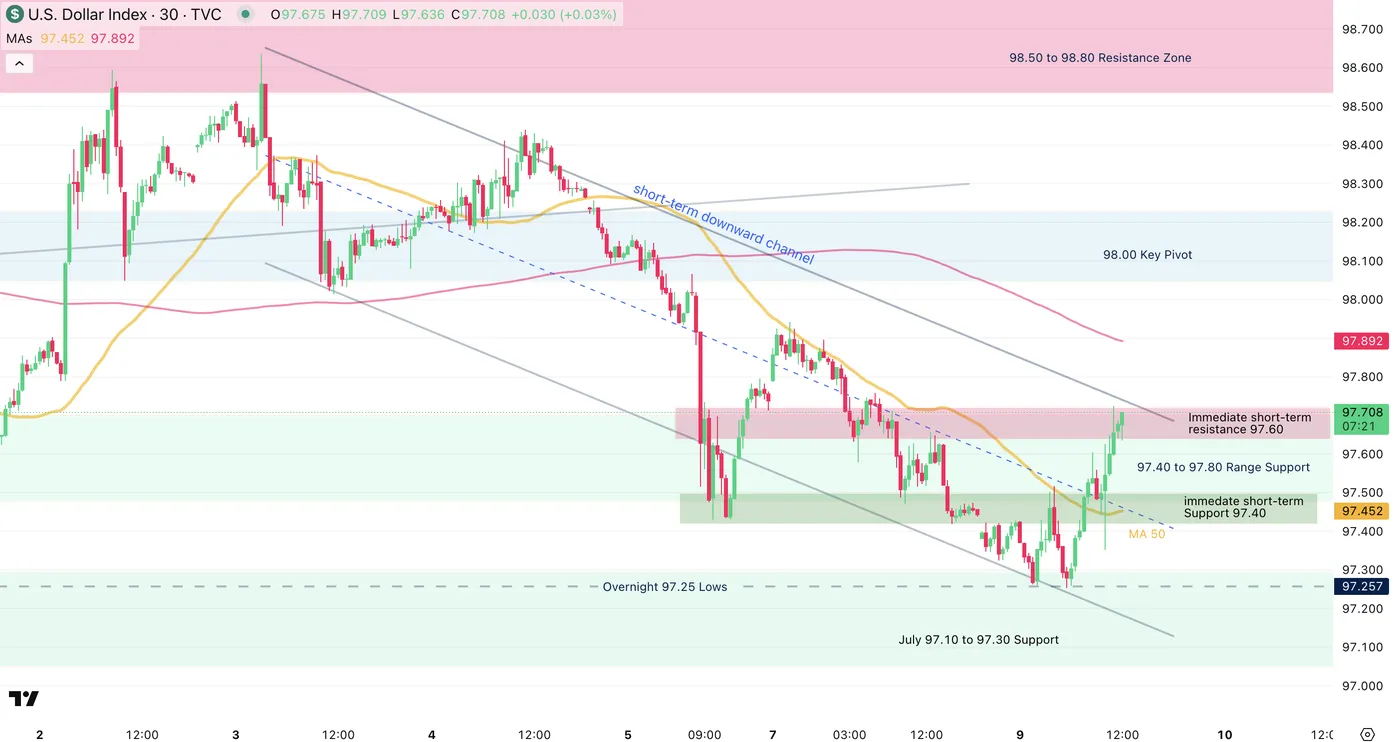
Dollar Index (DXY) 30M Chart, September 9, 2025 – Source: TradingView
Looking closer to the short-timeframe, the support zone that is currently trading will be a major test for bulls.
Managing to hold the lows of the current support (97.40, immediate short-term support) would indicate balanced action, which would be more in the bulls favor after failing to hold lower.
On the other hand, sellers appearing at the immediate short-term resistance (97.70) could trigger break-retest selling reactions.
A breakout in any direction should see continuation.
Safe Trades!
Dow Jones 30 (DJIA): Dow Renews Highs at the Close, Breaks Above Consolidation
Closing at $45,711, up +0.43%, the Dow Jones 30 has renewed recent highs in today’s session, breaking above previously held consolidation at around $45,642.
Dow Jones 30 (DJIA): Key takeaways from today’s session
- Up around 7.00% year-to-date, recent developments suggesting the Fed will cut in their upcoming decision are benefiting US equity pricing
- While interest rate cuts stand to benefit Dow Jones pricing, weak jobs data and a potential for infamous ‘stagflation’ could limit upside in the medium term
Dow Jones 30 (DJIA): Interest rate cut predictions boost Dow Jones pricing
Although playing second fiddle to the tech-dominant Nasdaq-100 for much of 2025, the Dow Jones remains around ~7.83% year-to-date, even with zero interest rate cuts, which, on paper, would be negative for index pricing.
As we all know by now, this could be about to change; most predict that the Fed will cut rates by 25 bps in their upcoming decision, while others are even expecting a cut of 50 bps in response to poor US labour data.
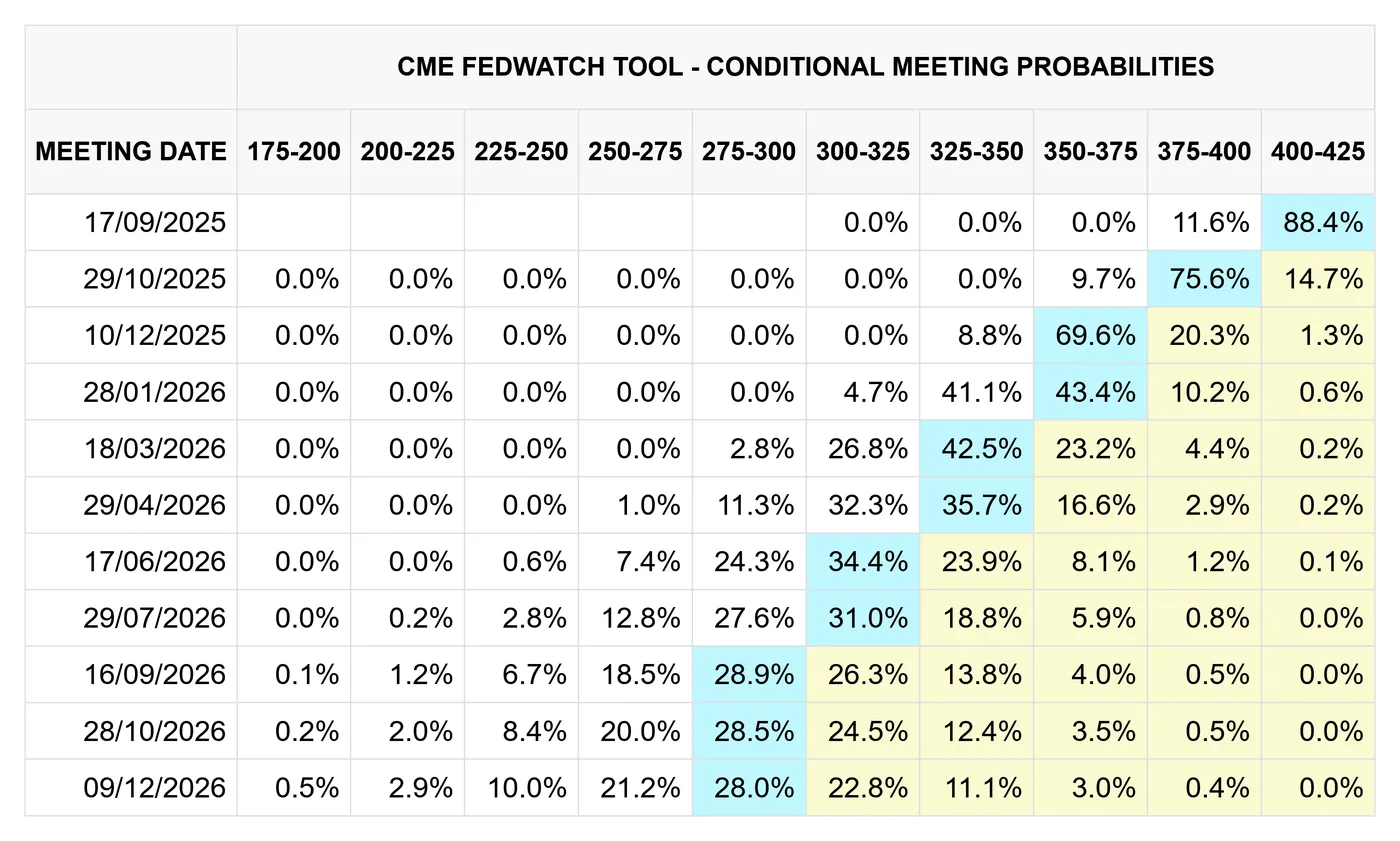
CME FedWatch, 08/09/2025
While the latter remains unlikely compared to a more tame approach, what is more certain is that a Fed rate cut is undeniably positive for the Dow Jones, with the benefit of holding dollars instead of investing set to be lowered for the first time in 2025.
It should be noted that despite the Fed's choice of tight monetary policy, the Dow Jones has performed fairly well this year, all things considered. While we can expect some short-term upside from expectations of rate cuts, the proof in the metaphorical pudding will be how data reacts to a change in interest rates, especially regarding inflation and labour data
Dow Jones 30 (DJIA): Stagflation fears and poor labour data cast doubt over upside
With poor labour data having virtually cemented the chances of an interest rate cut next week, markets are keenly watching upcoming US inflation data releases to understand whether fears of ‘stagflation’ are justified:
- Core Producer Price Index (MoM) (Aug), Wednesday, September 10th, 08:30 ET
- Core Producer Price Index (YoY) (Aug), Wednesday, September 10th, 08:30 ET
- Producer Price Index (MoM) (Aug), Wednesday, September 10th, 08:30 ET
- Producer Price Index (YoY) (Aug), Wednesday, September 10th, 08:30 ET
- Core Consumer Price Index (MoM) (Aug), Thursday, September 11th, 08:30 ET
- Core Consumer Price Index (YoY) (Aug), Thursday, September 11th, 08:30 ET
- Consumer Price Index (MoM) (Aug), Thursday, September 11th, 08:30 ET
- Consumer Price Index (YoY) (Aug), Thursday, September 11th, 08:30 ET
It’s important to remember that, even if interest rates are to be cut, sentiment and general confidence in the US economy will be the most significant determining factor in equity performance in the near future.
As such, labour and inflation data remain as crucial as ever. When considering the Fed’s dual mandate, here are a couple possible outcomes in the next few months:
- Lower rates boost jobs growth while inflation starts to fall
If a decision to cut rates is made, and the labour market responds well, while inflation starts to fall, we can consider this the best possible outcome. Naturally, this would substantially boost belief in the US economy, which would be US equity positive
2. Lower rates fail to promote jobs growth, while inflation remains stubborn
If the Federal Reserve decides to cut rates and the labour market responds poorly while inflation proves stubborn, this would be a very difficult position to maintain. While further rate cuts would potentially help the labour market, maintaining or even hiking rates would better control inflation, making monetary policy decisions difficult. In this scenario, we can expect higher levels of market uncertainty, which would be generally US equity negative
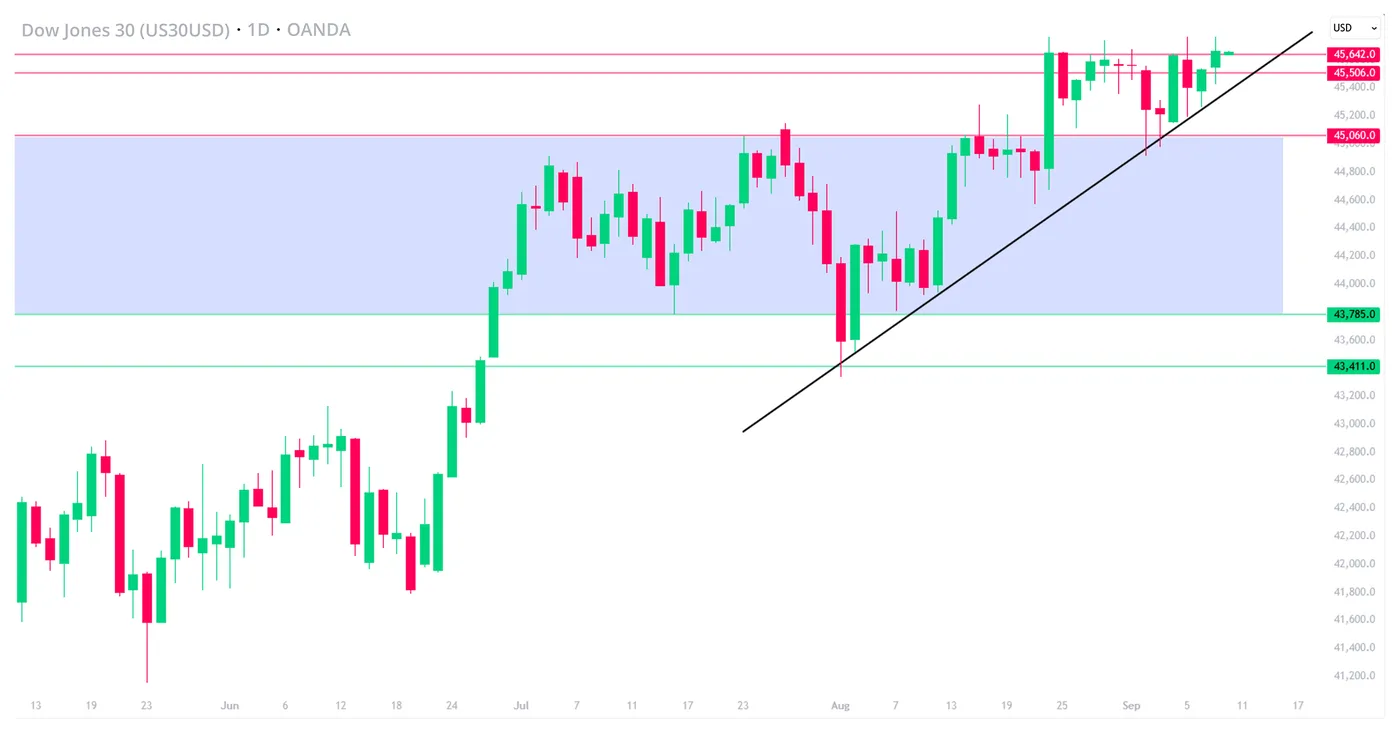
Dow Jones 30 (US30USD), OANDA, TradingView, 09/09/2025
EURNZD Wave Analysis
EURNZD: ⬇️ Sell
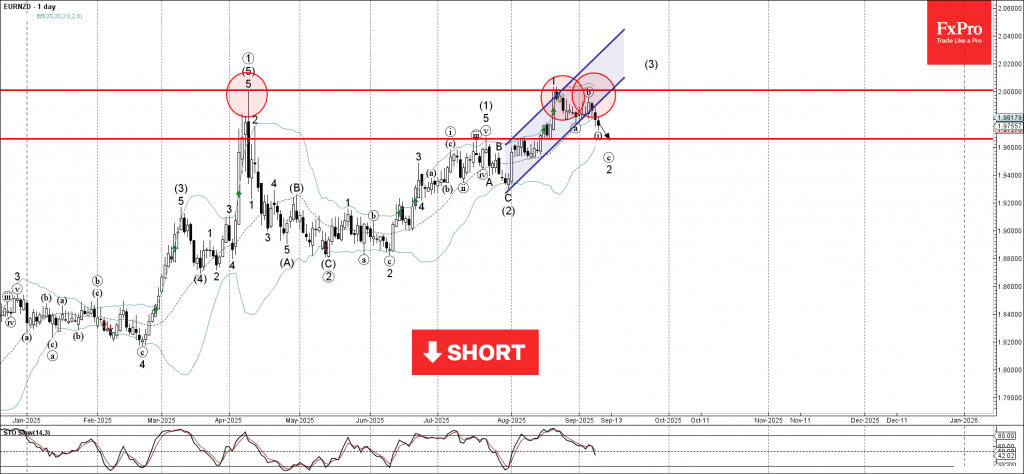
- EURNZD broke daily up channel
- Likely to fall to support level 1.9660
EURNZD currency pair recently reversed down from the resistance area between the round resistance level 2.0000 (former powerful resistance from April) and the upper daily Bollinger Band.
The downward reversal from this resistance area started active short-term impulse wave c, which then broke the daily up channel from July.
EURNZD currency pair can be expected to fall toward the next support level 1.9660 (former resistance from July and the start of August).
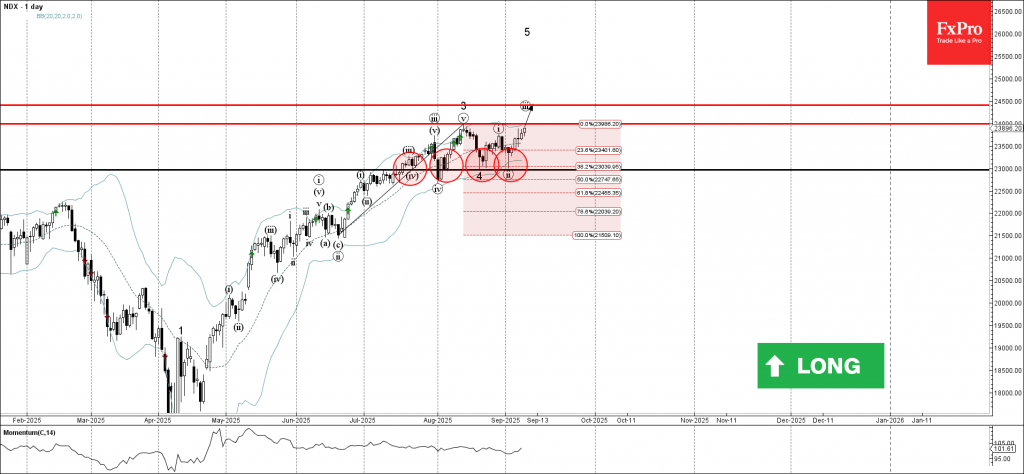
Nasdaq-100 Wave Analysis – 9 September 2025
Nasdaq-100: ⬆️ Buy
- Nasdaq-100 reversed from the support area
- Likely to rise to resistance level 24500.00
Nasdaq-100 index recently reversed up from the support area between the pivotal support level 23000.00 (which has been reversing the price from July), lower daily Bollinger Band and the 38.2% Fibonacci correction of the upward impulse from June.
The upward reversal from this support zone created the daily Japanese candlesticks reversal pattern Hammer – which started the active impulse wave iii.
Given the clear daily uptrend, Nasdaq-100 index can be expected to rise toward the next resistance level 24000.00 (top of wave 3), the breakout of which can lead to further gains toward 24500.00.
Sunset Market Commentary
Markets
Most markets were mired in technical trading today. Core bonds, at least up until now, are taking a breather after soft US labour market data that last week supported bets for accelerated Fed easing and a further easing of (global) financial conditions. Markets usually take a forward looking approach, mostly ignoring statistical data revisions. For once, this might be different with the BLS benchmark payrolls revision spanning the period April 2024-March 2025 to be published later today. With markets expecting in a downward revision of potentially 700k or more, the report in some way might profoundly ‘rewrite recent US economic history’, with equally important consequences for the Fed’s assessment. After the recent bond market rally and with money markets already discounting a sub 3% Fed policy rate, US yield markets today are shifting to a wait-and-see modus ahead of the BLS revision. US yields add between 1.5 bp (2-y) and 2.5 bps (30-y). US price data tomorrow (PPI) and on Thursday (CPI) maybe also cause some caution. Questions remains how much weight inflation still gets in both markets’ and the Fed’s assessment. With the Fed policy rate still in restrictive territory, we continue to see the risk for faster Fed easing in case of weak (labour) data. Later today, the US Treasury will sell $58 of 3-y notes. Interesting to see investor appetite after the recent rally and given higher yield levels for short-term US T-bills. Also little news on this side of the Atlantic. The German curve corrects sightly on recent flattening move with yields rising between 1.2 bps (2-y) and 3.0 bps (30-y). The (unsurprising) fall of the Bayrou government in France and President Macron restarting its exercise to find a new Prime Minister, is holding the French-German 10-y spread at a fragile ‘equilibrium’ near 80 bps. Both US equities (S&P 500 unchanged, EuroStoxx 50 -0.2%) are going nowhere. Oil jumps on the headlines of an Israeli strike against senior Hamas leadership in Doha (Brent $ 67 p/b).
On FX markets, the dollar took a weak start in Europe this morning, but reversed initial losses later in the session. DXY trades marginally higher at 97.55. EUR/USD came within reach of the 1.1789 level (24 July top and finally hurdle ahead of the 1.1829 YTD top). However, a real test/break didn’t occur yet. A combination of USD-rebound and euro-softness currently brings EUR/USD back to the 1.174 area. The yen slightly outperforms both the dollar and the euro on headlines of a BOJ still considering a rate hike this year (USD/JPY 146.8; EUR/JPY 172.35).
News & Views
Hungarian inflation figures printed exactly in line with consensus for the month of August. There was no price growth on average on a monthly basis with the annual figure stabilizing at 4.3%, above the central bank’s 3% inflation target. A separate analysis by the MNB shows core inflation excluding processed food dipping below 4% (3.9% Y/Y) for the first time since August 2021. Its sticky price inflation gauge was unchanged at 4.8% Y/Y Monthly data showed food and energy prices unchanged. The highest price rise of 0.6% was measured for alcoholic beverages and tobacco. Service prices rose by 0.5% on average and those of durable consumer goods by 0.4% M/M. In annual terms, Hungarian food prices rose by 5.9% with energy prices increasing by 11%. Services became 5.4% more expensive while consumer durable prices were up by 2.4%. Today’s data suggest that the MNB will stick with its stead, hawkish, monetary course for the foreseeable future. The Hungarian forint didn’t respond to the data and holds its ground near strongest HUF-levels since the summer of last year (EUR/HUF 393).
People familiar with the matter told Bloomberg that the Bank of Japan is of the view that it may be possible to raise the benchmark interest rate again this year regardless of domestic political instability, as economic conditions have developed in line with expectations. The US-Japan trade deal has also removed a key source of uncertainty. While an unchanged decision will be the outcome at the September central meeting, odds for a 25 bps rate hike to 0.75% in October (meeting with new quarterly forecasts) surged from 44% to 64%. Earlier today, Reuters reported that the BoJ is highly likely to trim purchases of 10- to 25-yr Japanese government bonds in its Q4 plan. The Japanese yen initially gained ground on the rate hike rumours with USD/JPY slipping from 147.30 to 146.30 before returning towards 146.80.
US: Small Business Optimism Improves Modestly in August
The NFIB's Small Business Optimism Index rose 0.5 points to 100.8 in August, coming in right in line with market expectations. As confidence improved, uncertainty pulled back, falling 4 points to a still elevated reading of 93.
Four out of ten subcomponents improved on the month, four decreased, and two remained unchanged. The largest gains were in expectations about higher real sales (up 6 points to 12%), earnings trends (up 3 points to -19%), and current inventory being too low (up 3 points to 0%). The declines among key subcomponents were more muted in comparison.
The net share of businesses planning to increase employment rose 1 point for the third month in a row to 15%, but the share of firms with unfilled job openings continued to trend lower (down 1 point to 32%). Quality of labor concerns remained unchanged at an elevated level, with 21% of business owners identifying this as their top business problem.
The share of firms reporting "few or no qualified workers for job openings" fell 5 points to 43% – aside from the start of the pandemic, this is the lowest level since early 2016.
Inflation metrics were muted. The share of businesses 'raising' average selling prices fell 3 points to 21%, while the share of those 'planning’ to raise average selling prices ahead 2 points to 28% – both measures remain well above their historical averages. Meanwhile, inflation concerns held steady at 11% for the third month in a row – lower than the 20-25% in the 2023-24 period, but still elevated compared to historical norms.
Key Implications
Small business optimism improved modestly in August, extending the turnaround in the confidence measure that began back in April. Among the key developments in today's report is the fact that, alongside some normalization in inflation-related metrics, businesses have been feeling more upbeat about 'real sales' in the months ahead.
Following a period of job cuts at small firms (June to August), the share of businesses planning to increase employment in the months ahead has also trended moderately higher. While 'quality of labor' remains the top concern, small businesses appear to have plenty of applicants for their job openings. The not so good news is that these openings continue to trend lower, which speaks to a more moderate pace of job creation ahead. Overall, with the Fed putting more emphasis on labor market concerns recently, this data leans in favor of a rate cut at next week's FOMC meeting.
Elliott Wave Blue Box Payoff: CADJPY Drops as Predicted
In this technical blog, we are going to take a look at the past performance of CADJPY Daily Elliott wave Charts that we presented to our members. In which, the decline from 7.10.2024 high took place in a double three corrective sequence and showed a lower sequence calling for more downside to happen. Therefore, our members knew that selling the bounces in the direction of the right side tag remained the preferred path. We will explain the Elliott wave structure & selling opportunity our members took below:
CADJPY Daily Elliott Wave Chart From 7.19.2025

CADJPY Daily Elliott Wave Chart from 7.19.2025 Weekend update. In which the pair is showing 5 swings lower low sequence supporting 6th bounce to fail for another leg lower to complete 7 swings corrective sequence from the peak. Whereas the decline to 101.26 low ended wave (A) of ((Y)). Up from there, the pair made a bounce towards the blue box area within wave (B). The internals of that bounce unfolded as zigzag structure where wave A ended at 106.25 high. Wave B pullback ended at 103.01 low. And wave C managed to reach the blue box area. From there, sellers were expected to appear looking for further downside or a minimum 3-wave reaction lower.
CADJPY Latest Daily Elliott Wave Chart From 9.06.2025

This is the latest Daily view from the 9.06.2025 Weekend update. In which the pair is showing a reaction lower taking place from the blue box area. Allowing shorts to get into a risk-free position shortly after taking the position. However, a break below 101.26 low is needed to confirm the next extension lower & avoid double correction lower.