Sample Category Title
Is AUD/USD Ready to Thrive After Monthly Pause?
- AUD/USD bulls resurface, test long-term resistance.
- Short-term risk titled to the upside.
- Buyers need a close above 0.6600.
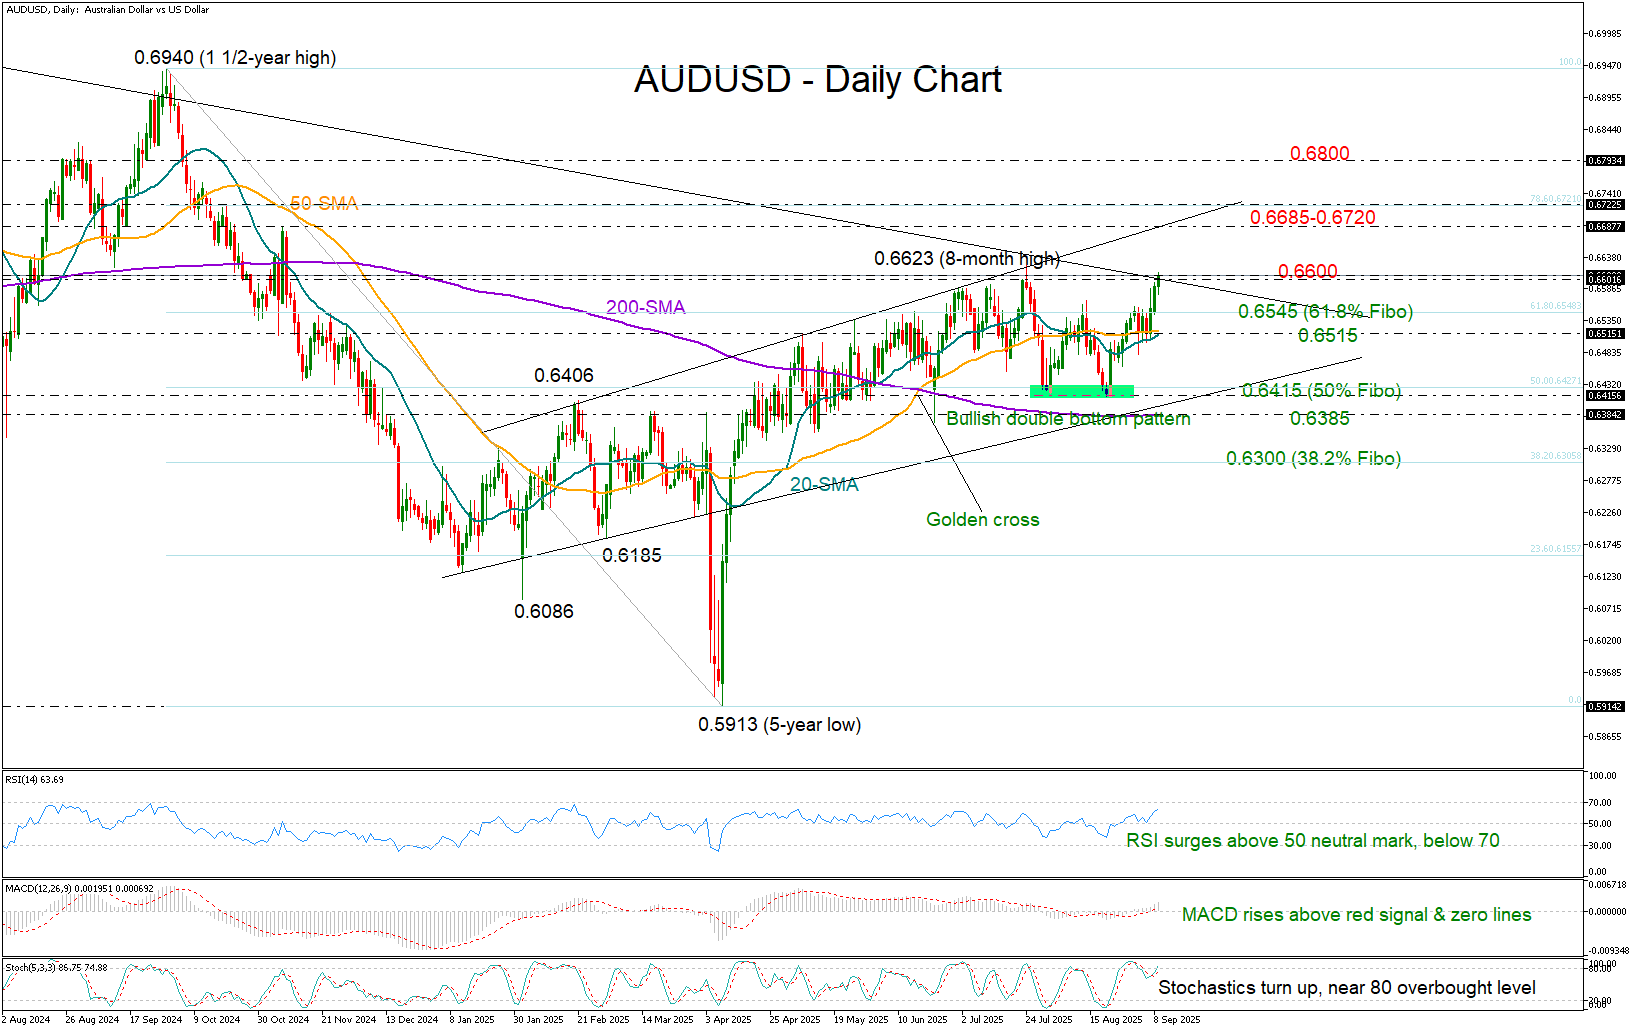
AUD/USD drifted higher following last Friday’s downbeat US Nonfarm Payrolls, exiting a break consolidation pause to stretch directly to the 0.6600 level, where July’s bullish attempt had previously stalled. Notably, a long-term resistance trendline drawn from the 2021 peak is now challenging the bulls, raising doubts about whether upside momentum can be sustained.
Encouragingly though, the post-NFP breakout appears to have confirmed a bullish double-bottom pattern above the 0.6548 region. With technical indicators maintaining a positive trajectory, the pair has scope for further gains. However, it is worth noting that the stochastic oscillator is hovering near the overbought 80 level, implying that bullish momentum may soon run out of steam.
If the price clears the 0.6600 barrier, the next target could be the 2025 resistance line at 0.6685, followed by the 78.6% Fibonacci retracement level of the prior downleg at 0.6720. Additional advances from there may open the way towards the 0.6800 handle and then to the 2024 ceiling of 0.6900–0.6940.
On the flip side, a reversal below the 0.6545 zone - and more importantly beneath the 20- and 50-day simple moving averages (SMAs) around 0.6515 - would shift the focus back to the double bottom area of 0.6415. The 200-day SMA at 0.6388 could then come into play before sellers aim for the 0.6300 region.
Overall, AUDUSD is looking promising in the short-term picture as analysts are eagerly waiting for the US CPI and PPI inflation indices, though a confirmation above 0.6600 is still needed to activate fresh buying orders.
EUR/USD Technical: Euro Bullish Breakout, What’s Next?
The EUR/USD has formed the expected bullish breakout above the former medium-term descending trendline resistance, which was in place from the 1 July 2025 high, and rallied by 0.8% to print an intraday high of 1.1778 on Tuesday, 9 September, during the Asia session at the time of writing.
After last Friday's, 5 September, weaker-than-expected US non-farm payrolls data print for August, this week’s key risk events that are likely to trigger a significant volatile movement in the EUR/USD will be the ECB monetary policy decision cum ECB President Lagarde’s press conference, and the release of the US core CPI inflation rate for August, both of them taking place around the same time on Thursday, 11 September between 12.15 pm to 12.45 pm GMT.
ECB is likely to signal the end of its interest rate cut cycle
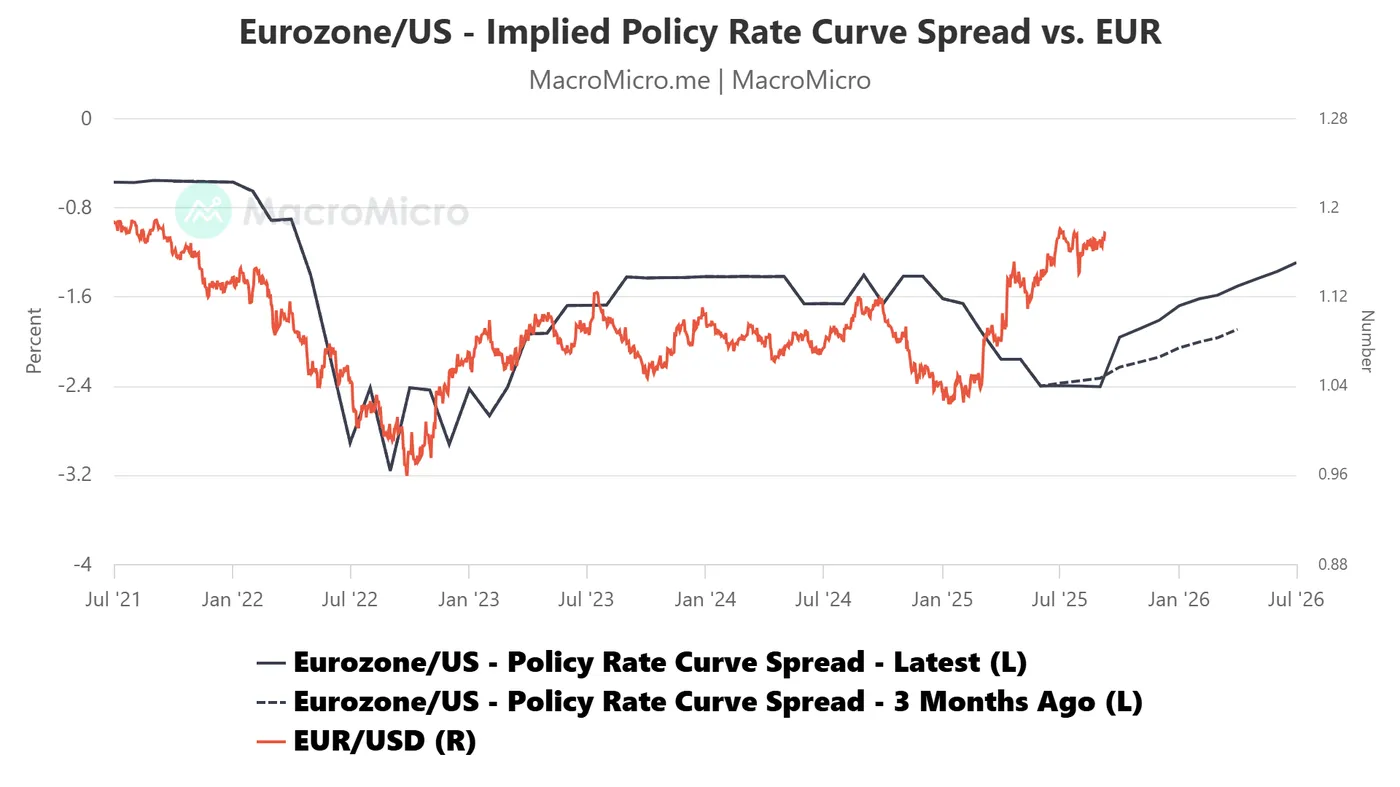
Fig. 1: The Eurozone/US implied policy interest rate curve spread with EUR/USD as of 9 Sep 2025 (Source: MacroMicro)
The European Central Bank (ECB) is expected to leave its deposit facility rate unchanged at 2% for the second consecutive policy meeting this Thursday.
Latest data from monthly implied future policy rate curves, derived from short-term interest rate futures for both the Eurozone and the US, suggest a high probability that the ECB has reached the end of its current rate-cut cycle.
The Eurozone/US implied policy interest rate curve spread has inched higher to -1.97% in October 2025, from -2.33% in September 2025, and rose steadily in the next few months to -1.62% by January 2026. Also, the curve spread has shifted upwards from three months ago (see Fig. 1).
A pause in the ECB’s rate-cut cycle, combined with expectations of an imminent Fed dovish pivot, suggests the euro is likely to continue appreciating against the greenback in the medium term.
Let’s now examine the latest technical factors on the EUR/USD to determine the next potential short-term (1 to 3 days) trajectory and its key levels to watch ahead of the ECB’s monetary policy decision and the release of the US core CPI inflation data.
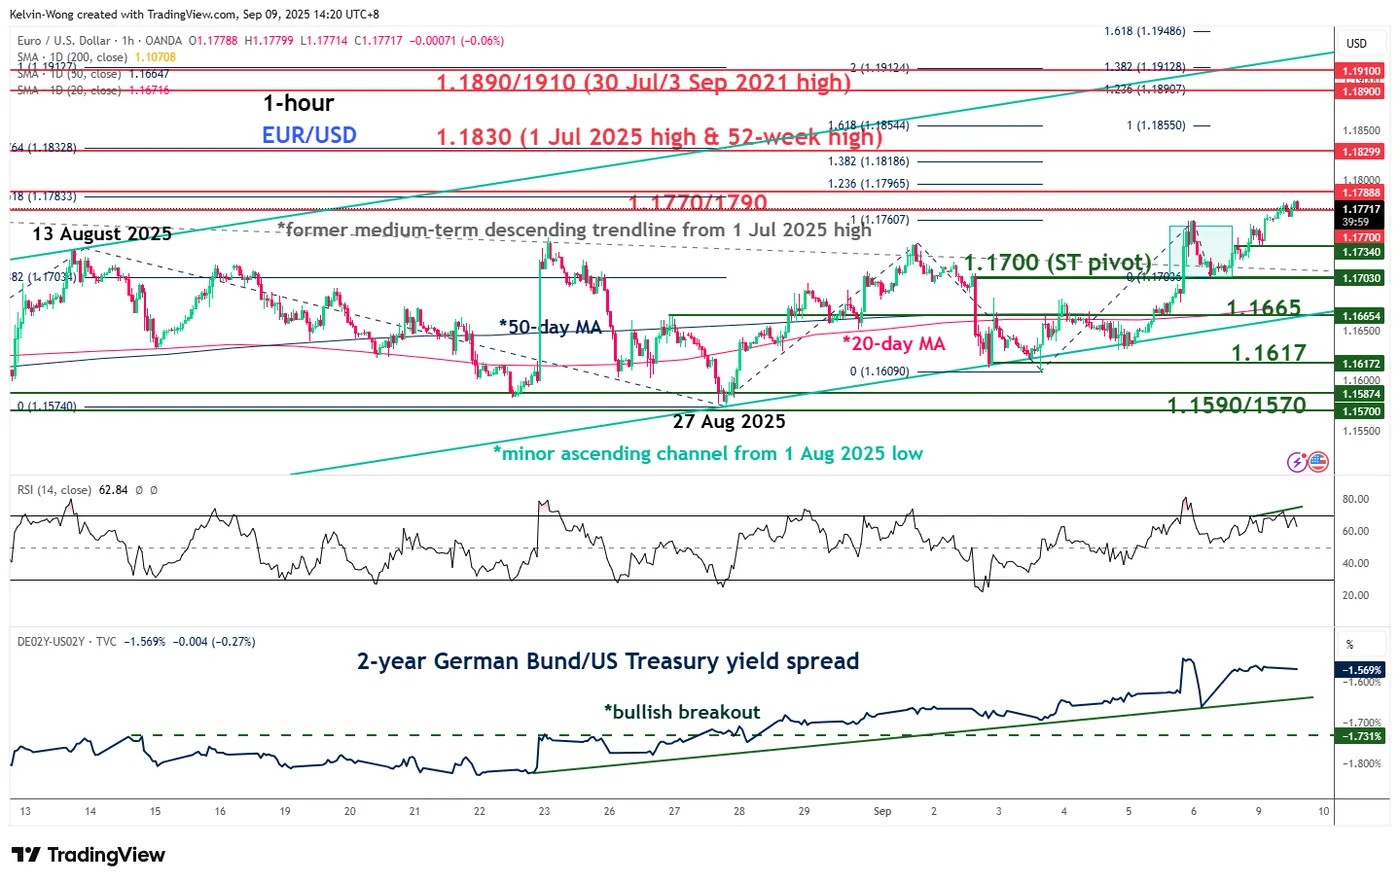
Fig. 2: EUR/USD minor trend as of 9 Sep 2025 (Source: TradingView)
Preferred trend bias (1-3 days)
Maintain bullish bias with key short-term pivotal support at 1.1700 for the next intermediate resistances to come in at 1.1830 and 1.1890/1.1910 (also a Fibonacci extension cluster and the upper boundary of the minor ascending channel from 1 August 2025 low).
Key elements
- The price action of the EUR/USD has reintegrated above its 20-day moving average since last Friday, 5 September, which supports the ongoing minor bullish impulsive up move sequence.
- The hourly RSI momentum indicator has not displayed a bearish divergence condition at its overbought zone, suggesting that the short-term bullish momentum remains intact.
- The yield spread between the 2-year German Bund and the US Treasury note has continued to narrow further after its bullish breakout on Thursday, 28 August. It narrowed to a current level of -1.57% from -1.68% on last Wednesday, 3 September. This development indicates a relative decline in the yield attractiveness of the 2-year US Treasury versus its German counterpart, which in turn exerts downside pressure on the US dollar against the euro.
Alternative trend bias (1 to 3 days)
Failure to hold at the 1.1700 short-term key support negates the bullish tone on the EUR/USD to open scope for another round of minor corrective decline to expose the next intermediate support at 1.1665 (also the 20-day moving average).
A break below 1.1665 may trigger a deeper slide towards 1.1617 next.
Dollar Index (DXY) Drops to 7-Week Low Ahead of Key Inflation Data
As the US Dollar Index (DXY) chart shows, the value of the USD against a basket of other currencies has fallen below 97.30 – its lowest level since late July.
The reasons lie in market sentiment ahead of major data releases:
→ On Wednesday at 15:30 GMT+3, Producer Price Index (PPI) figures will be published; a month ago they came in extremely high.
→ On Thursday at 15:30 GMT+3, Consumer Price Index (CPI) figures are due.
These releases are particularly significant as next week the Federal Reserve is set to announce its decision on interest rates – a 25-basis-point cut is widely expected.
Technical Analysis of the DXY Chart
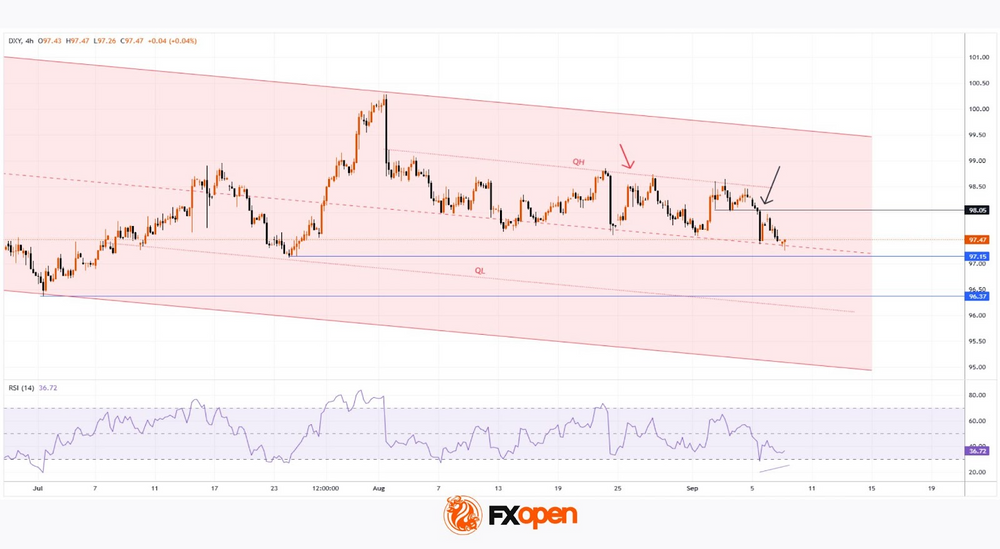
On 18 August, we identified a descending channel (shown in red) based on a sequence of lower highs and lower lows → it remains valid.
In addition, our base scenario suggested that the index might test one of the quartile lines (QL and/or QH) dividing the channel → indeed, since then the QH line has been tested several times (red arrow), convincingly acting as resistance.
What Next?
Bearish case:
→ Lower highs and lows throughout the second half of August indicate that sellers are in control of the DXY market.
→ The black arrow marks bearish momentum that broke through support at 98.05 last week.
→ The drop was sharp (a sign of imbalance in favour of sellers), and yesterday the 98.05 level acted as resistance.
Bullish case:
→ The DXY has dropped into the median zone, where supply and demand often balance. Buyers may step in, viewing current levels as attractive for entry.
→ The RSI may potentially form a bullish divergence.
→ The latest candle on the right shows a long lower wick (a bullish pin bar pattern), underlining buyers’ determination.
Given the above, we could expect the DXY to hover around the median area. However, the upcoming US inflation reports could trigger volatility across financial markets. A test of support at 97.15 could occur.
Trade global index CFDs with zero commission and tight spreads. Open your FXOpen account now or learn more about trading index CFDs with FXOpen.
This article represents the opinion of the Companies operating under the FXOpen brand only. It is not to be construed as an offer, solicitation, or recommendation with respect to products and services provided by the Companies operating under the FXOpen brand, nor is it to be considered financial advice.
European Markets Will Keep an Eye on How French President Macron Manages the Political Crisis
Markets
Markets started slow but after all constructive to the new trading week, with bonds and equities closing in green. Upcoming event risk (French confidence vote a.o.) for now didn’t spoil the game. US interest rate markets facilitated a further easing of global financing conditions, with today’s BLS benchmark revision for the US payrolls a potential catalyst for more aggressive Fed easing. The US yield curve in a nice bull flattening move eased between 2.3 bps (2-y) and 6.7 bps (30-y). Fiscal worries/risk premia have subsided a bit, at least for now. EMU/German yields followed this trend, albeit at a distance as the ECB has ended its easing cycle. Bund yields declined between 0.3 bps (2-y) and 3.3 bps (30-y). The French-German 10-y spread was unchanged (77 bps), slightly off last week’s peak levels. After the close of European markets, French PM Bayrou as expected lost the confidence vote in Parliament over his budget plans, highlighting the political stalemate. However, for now, markets apparently feel no need to push French risk premia even wider as long as president Macron doesn’t call new snap elections. Short-term, Friday’s rating review by Fitch (AA- with negative outlook) still might cause some additional jitters. The global easing of financing conditions also supported equites (Nasdaq +0.45%, EuroStoxx 50 +0.84%). On FX markets, the dollar on Friday only lost modest ground in the wake of much weaker than expected payrolls. Still, losses were extended in yesterday’s ‘risk-on’ context. DXY (Close 97.45) is at risk of slipping below the July/August lows near 97.55. Dollar weakness also dominated in the EUR/USD cross rate, with the pair drifting higher in the 1.17 big figure (close 1.1763).
Today’s eco calendar is thin. European markets will keep an eye on how French president Macron manages the political crisis. In the US, NFIB small business confidence is interesting when assessing the broader picture on the US economy, but no market mover. The market focus will be on the BLS benchmark revision of the US payrolls’ statistics. Consensus sees a potential downward revision of US payrolls in the year up to March 2025 by 700K. Whatever the number, the report probably will indicate a much weaker starting point as the Fed is embarking for a next phase in its policy normalization process. This might cause the central bank to add further weight to labour market conditions and raise expectations on accelerated easing. The US 2-y yield has downward potential towards a neutral 3% and also trigger further USD weakness. EUR/USD 1.1789 is final intermediate resistance ahead of the YTD top at 1.1829. Later today, the US Treasury starts its mid-month refinancing operation with a $58bn 3-y Note sale.
News & Views
Inflation expectations ticked up 0.1 ppt to 3.2% at the one-year-ahead horizon, the New York Fed August survey revealed yesterday. The gauge hasn’t been below 3% this year so far and the closest it got to the Fed’s 2% target since the start of 2024 was in October (2.9%). The 3-yr and 5-yr horizon expectations were unchanged at 3% and 2.9% respectively. Job market sentiment showed further cracks with the perceived probability of finding a job fell 5.8 ppt to a series low (since June 2013) of 44.9%. Consumers also find it more likely that the unemployment rate will rise one year from now (+1.7ppt to 39.1%) and that they’ll lose their jobs (+0.1 ppt to 14.5%). Income expectations remain unchanged for a second month straight (2.9%) while those for spending growth rose marginally to 5%.
Data from the US Treasury Department showed that India has been steadily reducing its purchases of US bonds. Investment in June dropped to $227.4bn from $235.3bn in May and around $242bn a year ago. India’s central bank (RBI) has also increased the amount of gold reserves, other data revealed. The country’s finance minister said last week the RBI was taking a “very considered decision” to diversify its reserves, which are the world’s fourth-largest. The moves are seen as geopolitically inspired and happen against the backdrop of a trade dispute with the US. The latter in August imposed a 50% levy on Indian exports, with half of that being a penalty for buying Russian oil..
GBP/JPY Daily Outlook
Daily Pivots: (S1) 199.34; (P) 199.85; (R1) 200.32; More...
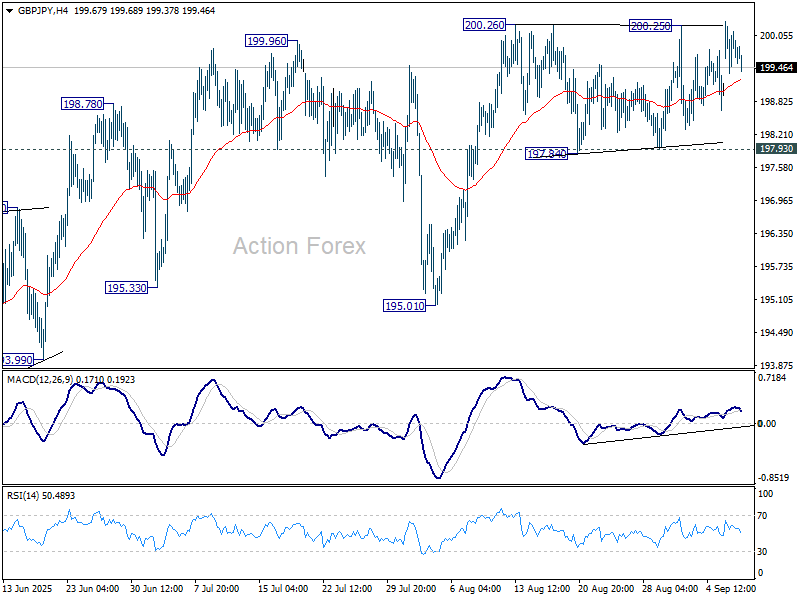
GBP/JPY failed to break through 200.26 resistance decisively and retreated. Intraday bias remains neutral first. Further rise is expected as long as 197.93 support holds. Firm break of 200.26 resistance will resume the rally from 184.35 to 100% projection of 180.00 to 199.79 from 184.35 at 204.14. On the downside, however, break of 197.93 support will turn bias to the downside for 195.01 support next.
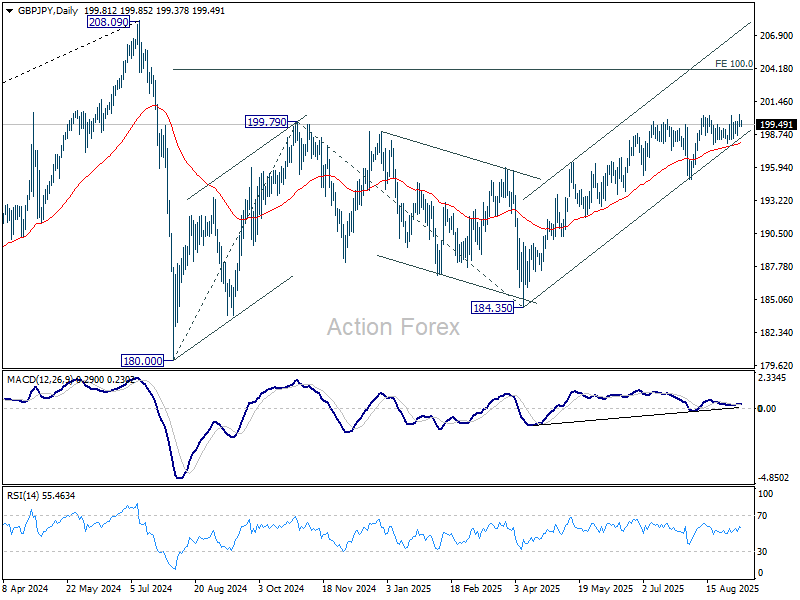
In the bigger picture, price actions from 208.09 (2024 high) are seen as a correction to rally from 123.94 (2020 low). The pattern might still extend with another falling leg. But in that case, strong support should be seen from 38.2% retracement of 123.94 to 208.09 at 175.94 to contain downside. Meanwhile, decisive break of 208.09 will confirm long term up trend resumption.
EUR/JPY Daily Outlook
Daily Pivots: (S1) 173.10; (P) 173.50; (R1) 173.94; More...
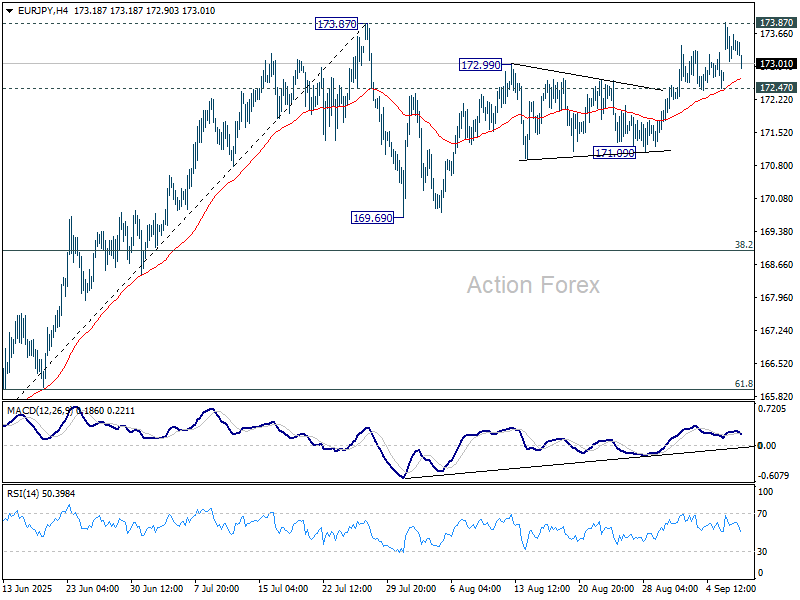
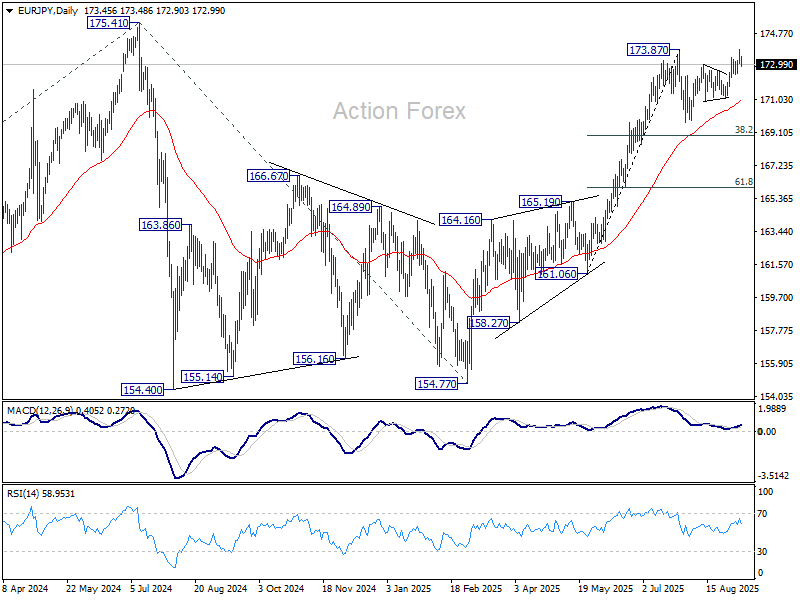
EUR/JPY failed to break through 173.87 resistance decisively and retreated. Intraday bias is turned neutral first. Some consolidations could be seen first. On the upside, firm break of 173.87 will resume larger rise to retest 175.41 key resistance. On the downside, though, break of 172.47 support will extend the corrective pattern from 173.87 with another falling leg, before rally resumption.
In the bigger picture, current rally from 154.77 is still tentatively seen as resuming the larger up trend. Firm break of 175.41 (2024 high) will confirm and target 61.8% projection of 124.37 to 175.41 from 154.77 at 186.31. However, sustained break of 38.2% retracement of 161.06 to 173.87 at 168.97 will delay this bullish case, and probably extend the correction from 175.41 with another fall.
EUR/GBP Daily Outlook
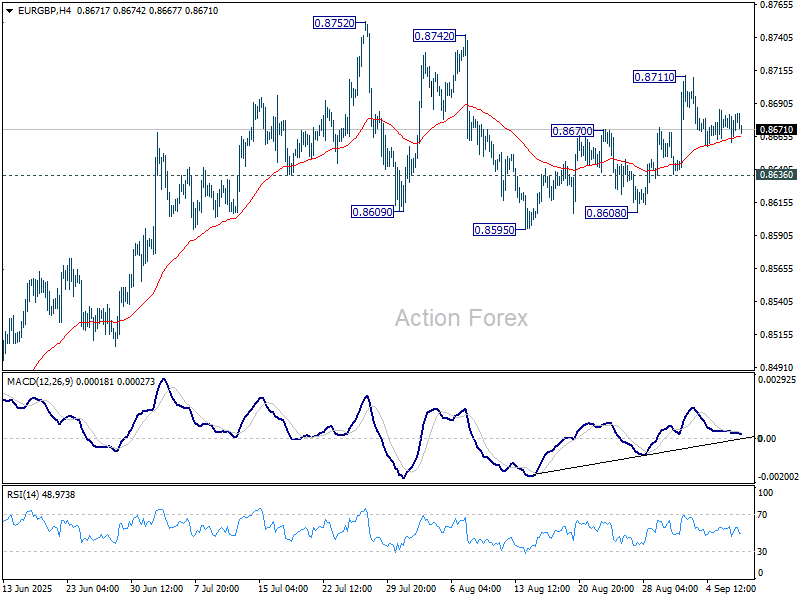
Daily Pivots: (S1) 0.8670; (P) 0.8678; (R1) 0.8693; More...
No change in EUR/GBP's outlook. Intraday bias stays neutral and further rise is mildly in favor with 0.8636 minor support intact. On the upside above 0.8711 will bring retest of 0.8752 high. However, break of 0.8636 will extend the pattern from 0.88752 with another falling leg, and target 0.8959 support.
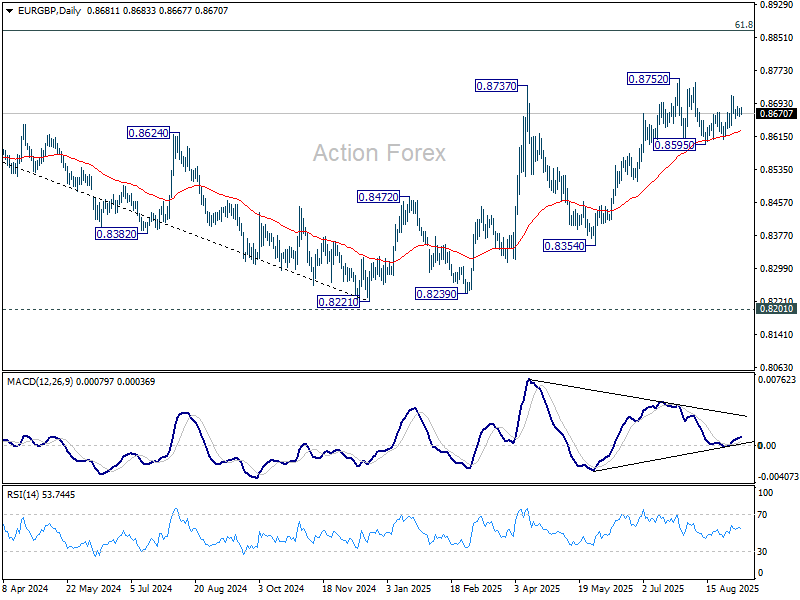
In the bigger picture, the structure from 0.8221 medium term bottom are not impulsive enough to suggest that it's reversing the down trend from 0.9267 (2022 high). But even if it's a correction, further rise could still be seen to 61.8% retracement of 0.9267 to 0.8221 at 0.8867. Nevertheless, sustained trading below 55 W EMA (now at 0.8519) will argue that the pattern has completed and bring retest of 0.8221 low.
EUR/AUD Daily Outlook
Daily Pivots: (S1) 1.7792; (P) 1.7840; (R1) 1.7892; More...
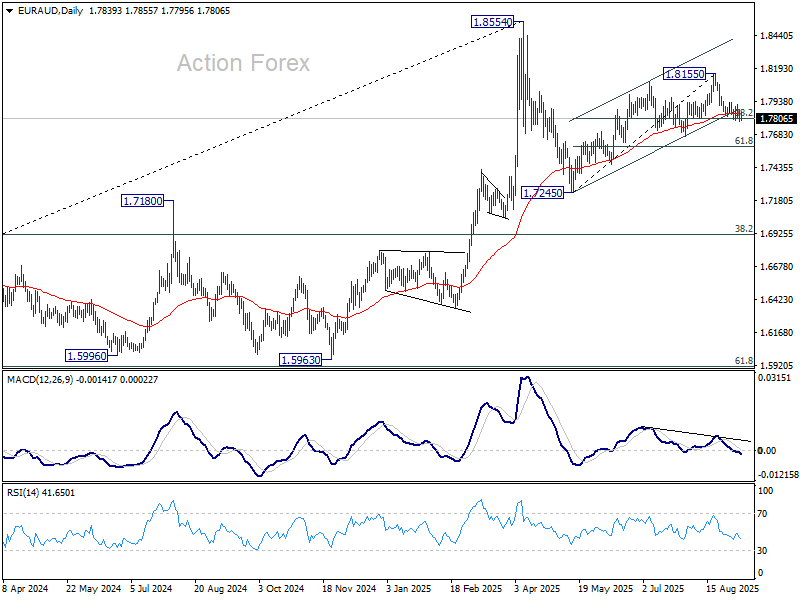
EUR/AUD is still struggling to sustain below 38.2% retracement of 1.7245 to 1.8155 at 1.7807 and intraday bias stays neutral first. Firm break of 1.7807 will should confirm that whole rise from 1.7245 has completed at 1.8155. Corrective pattern from 1.8554 should then be in its third leg. Further decline should be seen to 61.8% retracement at 1.7593. On the upside, break of 1.7932 resistance will retain near term bullishness and bring retest of 1.8155 resistance instead.
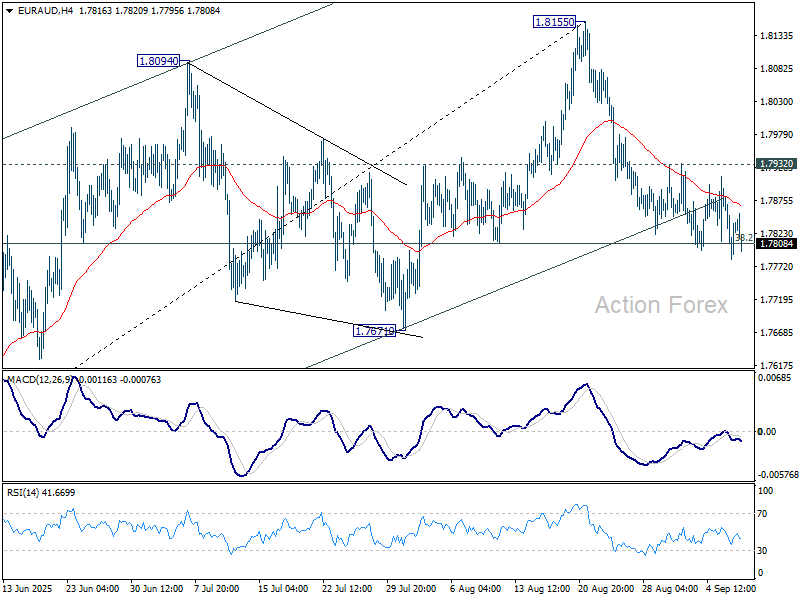
In the bigger picture, price actions from 1.8554 medium term top are seen as a corrective pattern. Such pattern could extend further with another falling leg. But even in that case, downside should be contained by 38.2% retracement of 1.4281 (2022 low) to 1.8554 at 1.6922 to bring rebound. Uptrend from 1.4281 is expected to resume at a later stage.
EUR/CHF Daily Outlook
Daily Pivots: (S1) 0.9313; (P) 0.9338; (R1) 0.9358; More....
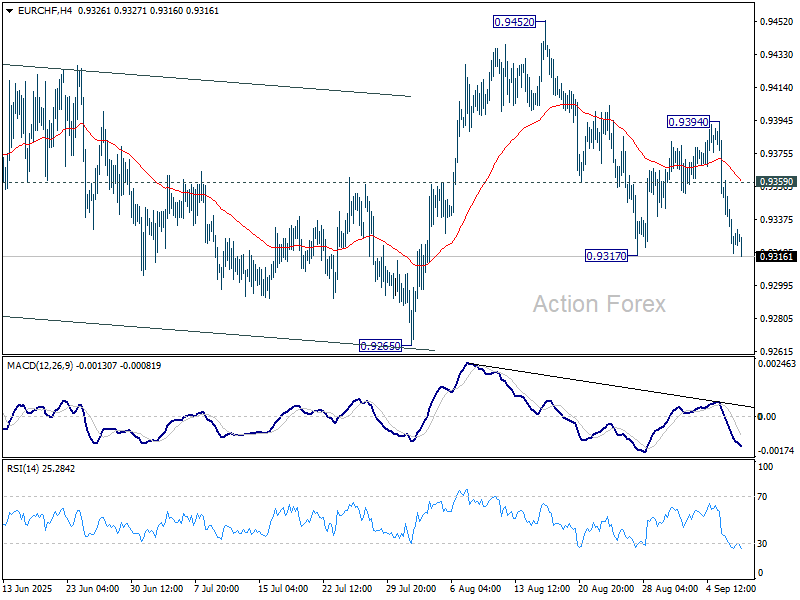
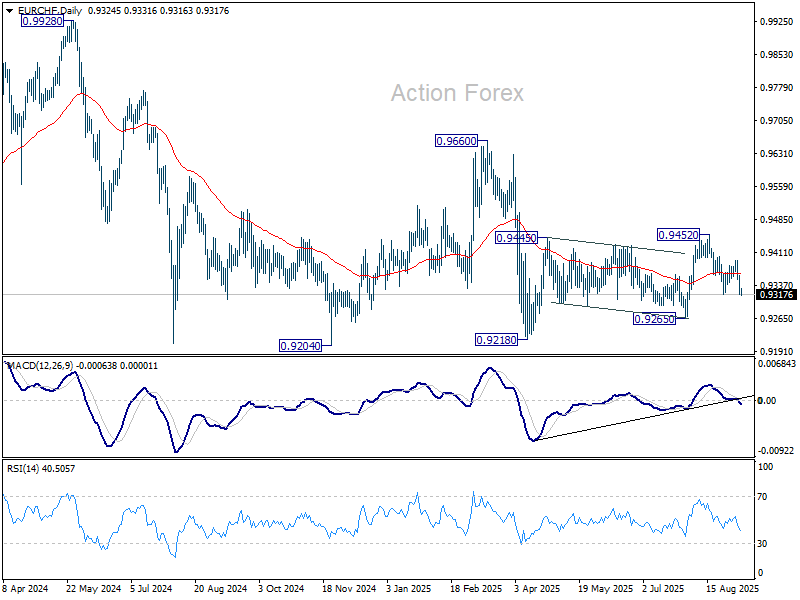
Intraday bias in EUR/CHF remains on the downside at this point. Firm break of 0.9317 would resume the decline from 0.9452. That would also solidify the bearish case that corrective pattern from 0.9218 has completed with three waves up to 0.9452 already. Deeper fall should then be seen to 0.9265 support, and then 0.9204 low. On the upside, above 0.9359 minor resistance will turn intraday bias neutral first. But risk will stay on the downside as long as 0.9394 resistance holds, in case of recovery.
In the bigger picture, the down trend from 0.9204 (2018 high) might still be in progress considering that EUR/CHF is staying well inside the long term falling channel. However, with bullish convergence condition in W MACD, downside potential should be limited in case of another fall. Instead, firm break of 0.9660 resistance will be an important sign of medium term bullish trend reversal.
USD/CAD Daily Outlook
Daily Pivots: (S1) 1.3779; (P) 1.3812; (R1) 1.3836; More...
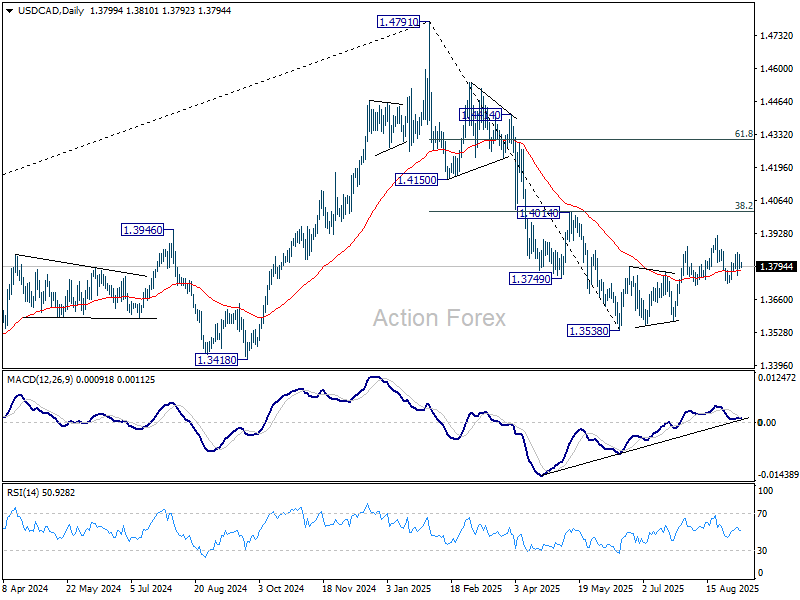
Intraday bias in USD/CAD is turned neutral again with current retreat. On the upside, firm break of 13.923 resistance will resume whole corrective rebound from 1.3538. However, sustained break of 1.3725 will argue that the rebound has completed at 1.3923, and turn near term outlook bearish.
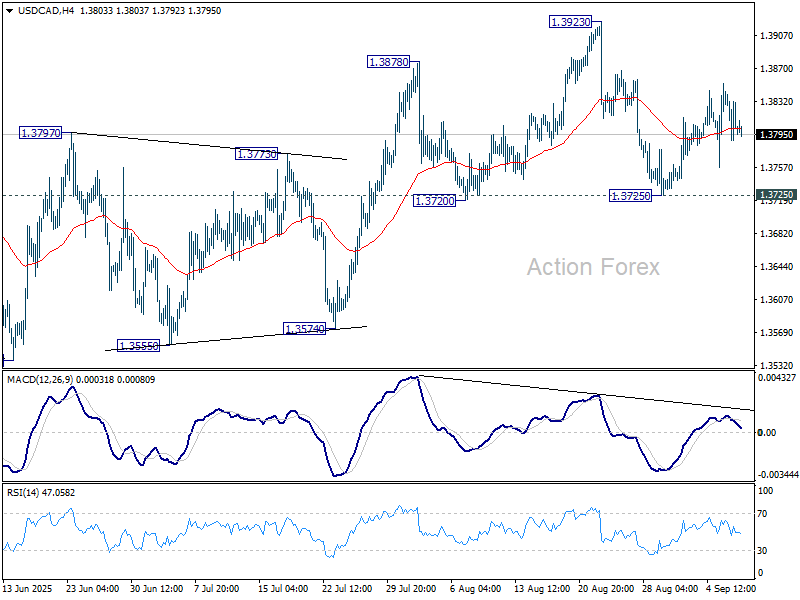
In the bigger picture, price actions from 1.4791 medium term top could either be a correction to rise from 1.2005 (2021 low), or trend reversal. In either case, further decline is expected as long as 1.4014 cluster resistance (38.2% retracement of 1.4791 to 1.3538 at 1.4017) holds. Next target is 61.8% retracement of 1.2005 (2021 low) to 1.4791 at 1.3069.