Sample Category Title
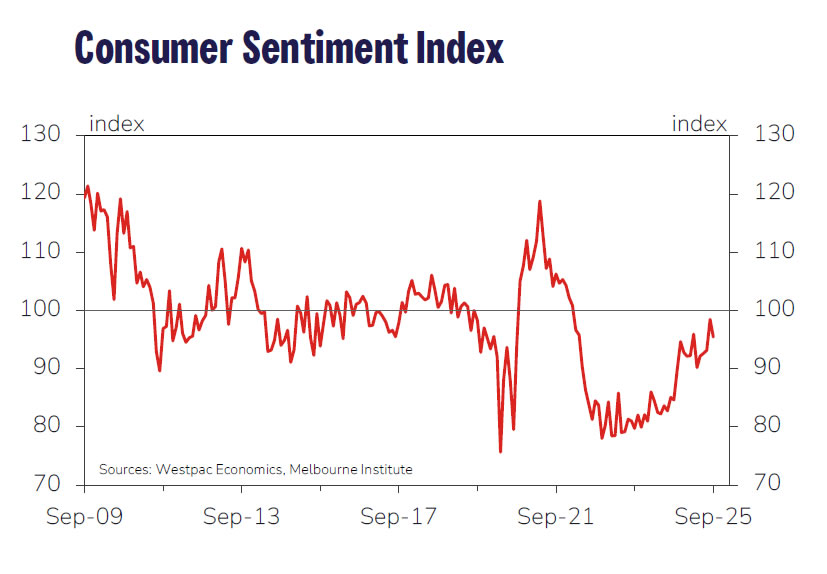
Westpac: Australia consumer optimism elusive, RBA to pause in September
Australia’s Westpac Consumer Sentiment Index dropped -3.1% mom to 95.4 in September, reversing part of last month’s boost from the RBA’s third rate cut. While sentiment remains modestly above July levels and well above the April tariff-driven low, the index has slipped back into “cautiously pessimistic” territory. Westpac said outright optimism remains "elusive", with households still uneasy about the path ahead despite relief from the cost-of-living crisis.
The RBA is expected to keep its cash rate steady at 3.6% when it meets later this month. Westpac noted recent data on inflation and demand came in "somewhat firmer than expected", reinforcing the case for caution. Policymakers are seen waiting for further confirmation that underlying trends remain benign before resuming cuts.
For now, consumer recovery looks sluggish, and Westpac expects "further easing will likely be needed" to sustain momentum. It forecasts another 25bp cut in November and two additional moves in 2026, underscoring the gradual path ahead for both sentiment and policy.
Bitcoin (BTC/USD) Eyes Further Gains as Strategy Expands Holding and ETF Flows Remain Strong
Bitcoin (BTC/USD) has been moving higher at a grind since the beginning of September and is up nearly 2% over the last two days.
Friday saw a significant spike for Bitcoin in a similar manner to Gold and other US Dollar denominated assets, but in the case of Bitcoin, the gains were surrendered before the end of the day.
Whales are Offloading Coins at the Fastest Pace Since 2022
According to @caueconomy on X and on-chain data, in the last thirty days, whale reserves have fallen by more than 100,000 BTC, signaling intense risk aversion among large investors.
This selling pressure has been penalizing the price structure in the short term, ultimately pushing prices below US$108,000 last week.
At this time, we are still seeing these reductions in the portfolios of major players, which may continue to pressure Bitcoin in the coming weeks.
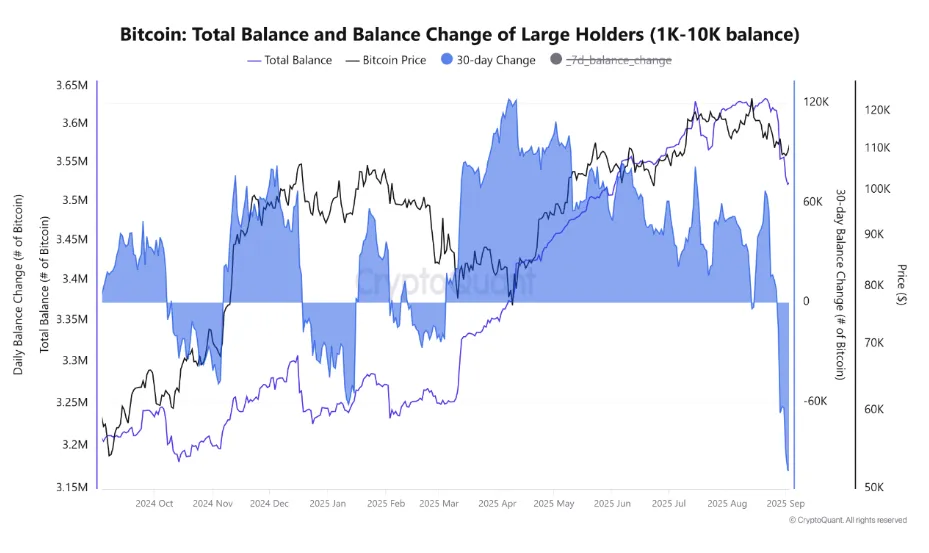
Source: CryptoQuant
The activity by whales may be concerning for market participants. Especially if institutions continue to dump holdings but this may be more clear once we see the ETF flows over the last week or so.
Bitcoin ETF Flows
The ETF flows through to Friday last week finished net positive after two strong days on Tuesday and Wednesday. Net outflows on Thursday and Friday were negative but not greater than the inflows earlier in the week.
This shows that demand still remains in the market after the recent selloff. As a further nod to confidence, ETF flows were strong in the last week of August as well.
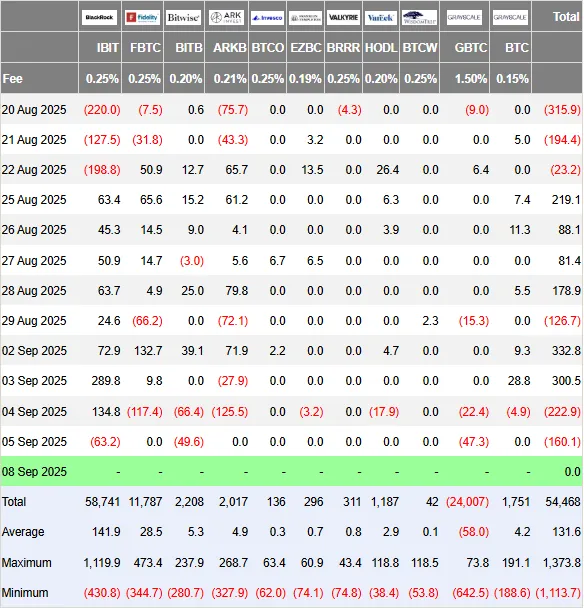
Source: Farside Investors
Strategy Expands Bitcoin Holdings
Last week, two public companies, Strategy and Metaplanet, bought over $230 million worth of Bitcoin. According to their separate announcements, their combined purchase of 2,091 Bitcoins was about two-thirds (66%) of all the new Bitcoins created by miners during that time.
On September 8, Strategy announced it had bought 1,955 of those Bitcoins for $217.4 million, which was about 62% of all the coins mined that week. After this purchase, Strategy's total Bitcoin holdings reached 638,460, valued at $71.6 billion. This means the company has an estimated profit of about 51.8% on its total investment of $47.17 billion.
The company stated in a filing that it used money from its stock program, which raised capital from Strife, Strike, and MSTR stock, to fund the purchase. In 2025 alone, Strategy has raised more than $19 billion to buy Bitcoin.
Moving forward, later this week and US CPI data will have an impact on rate cut expectations for the Fed meeting next week. This could be another catalyst for Bitcoin with a weak CPI print likely to help Bitcoin continue its advance.
Technical Analysis - BTC/USD
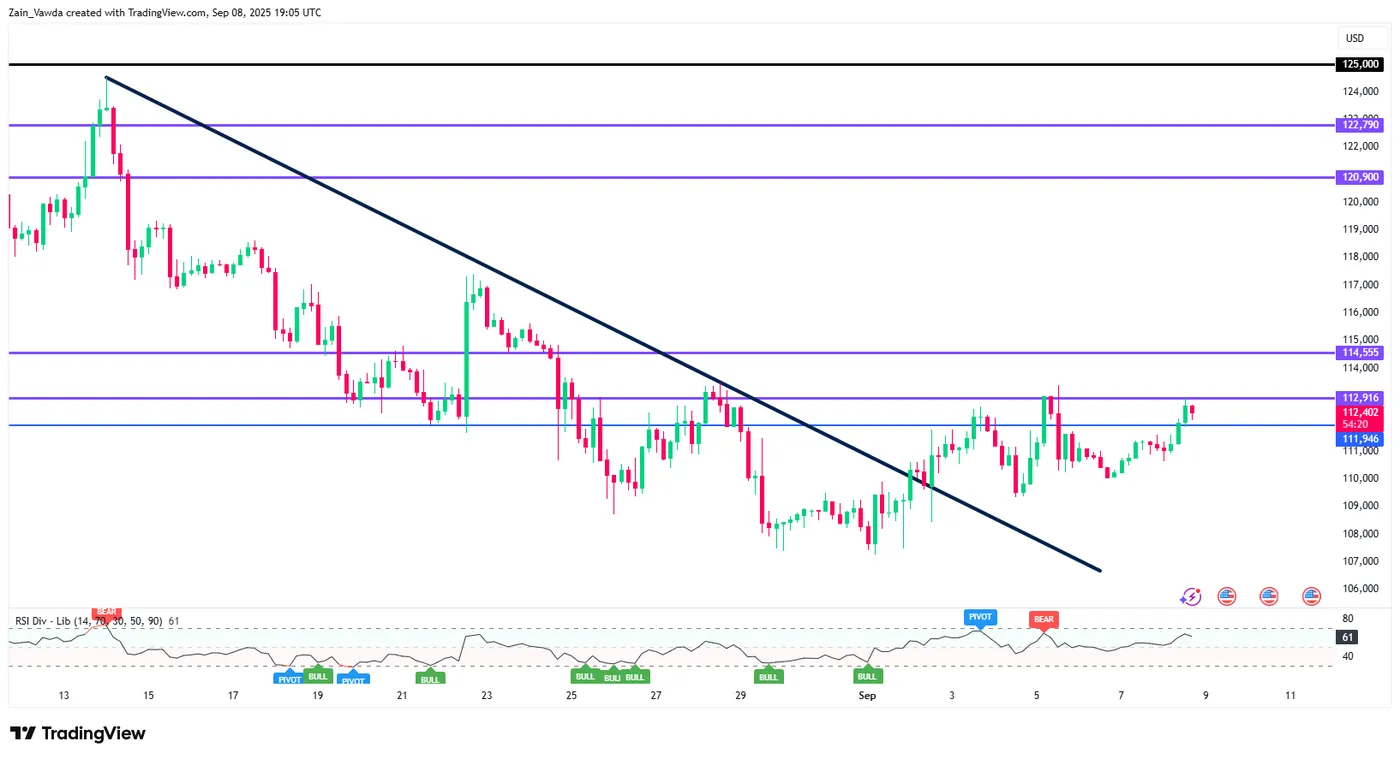
From a technical perspective, Bitcoin is hovering just below a key area of resistance at 112916.
The last two days has seen Bitcoin rise near 2%, however there are some signs that could worry bulls in the short term.
The current four-hour candle looks set to close bearish and as a inside bar which could hint at some short-term downside.
This could bring the RSI period-14 to retest the 50 neutral level and this could be used to gauge the next move for Bitcoin.
A break below the 50 level could be a sign of growing bearish momentum with a retest of recent lows at 109500 and 108000 becoming a possibility.
A bounce of the 50 level could be the precursor for a move beyond the 112916 handle before markets begin eyeing resistance at the 115000 and 117000 handles.
Bitcoin (BTC/USD) Four-Hour Chart, September 8, 2025
Source: TradingView.com (click to enlarge)
Gold (XAU/USD) Bullies Its Way to New Record Highs – Potential Targets and Fundamental Outlook
All eyes are laying on one asset class in Markets: Precious Metals
The usual suspect: Gold, A.K.A. The Bullion (or just "bully" for people who are caught short).
Gold has always been a very complex asset. It does not have a face value yet it serves as store of value for many Central Banks. It cannot be eaten yet people always starve for it.
And these days, it not-only is at the center of the 2025 Trump-Administration deglobalization theme but also a good edge against every potential catalyst against positive sentiment this year:
Rate cuts? Wars? Fiscal catastrophes? Political instability (France, Japan, US, UK, ...)
Bonds haven't seen much demand since the end of the 2022 hike cycle and stocks are at all-time highs, therefore the question is more one of currency-debasing rather than a purely risk-off Market.
Metals had been stabilizing and correcting from their relative highs as war situations seemed to be resolving, central banks had cut their purchases and a signs of higher-than-projected inflation pushed the FOMC to hold their rates higher (typically negative for Gold as a non-yielding assets).
However, Markets had calmed from their higher term overbought conditions. The latest change in Powell's tone at Jackson Hole followed by an increasingly compromised FED Independence led to a massive rebound in metals, propulsed by both Gold and Silver.
Let's attack a high to intraday timeframe analysis for Gold as it keeps breaking records, and identify levels of interest.
Multi-timeframe analysis for Gold, starting from the Weekly to intraday
Gold Weekly timeframe
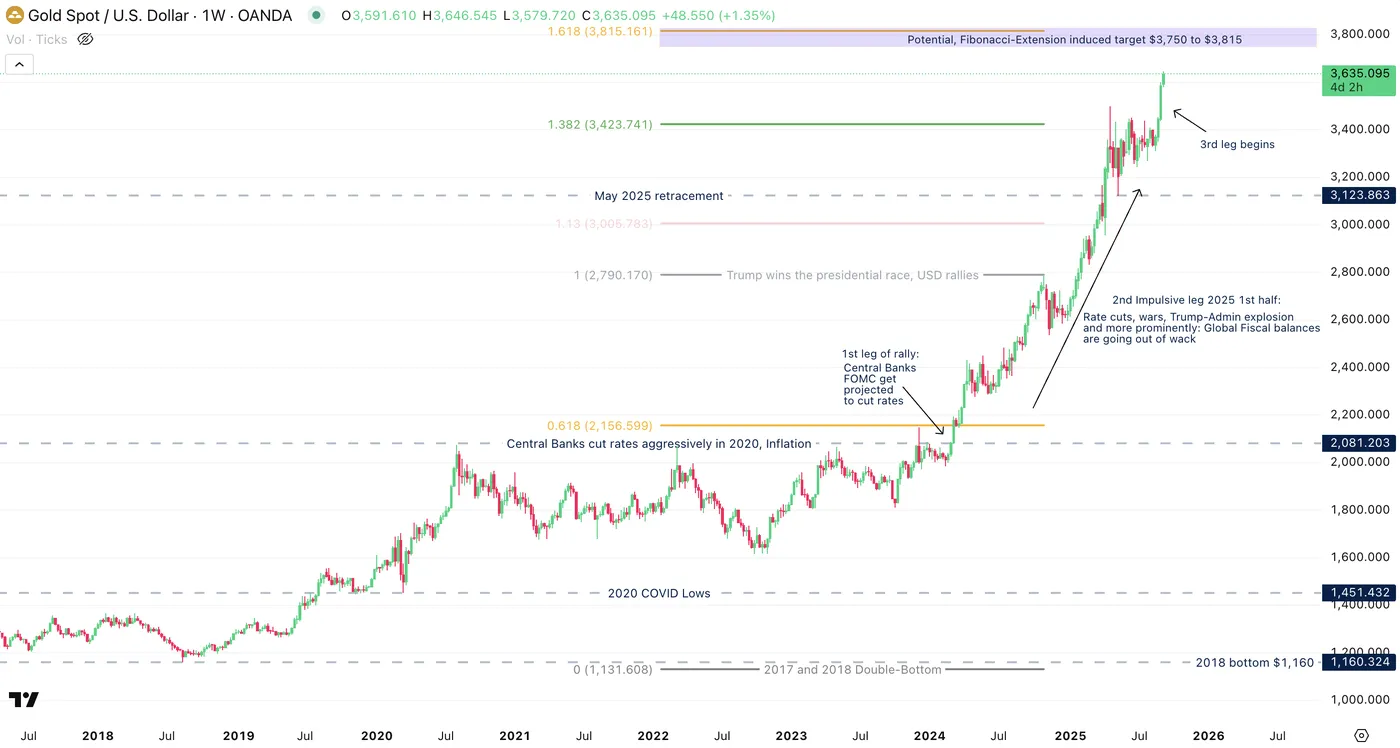
Gold Weekly Chart, September 2025, Source: TradingView
Taking a look back to the weekly charts really helps to see how significant this ongoing move in Gold is.
Some key levels and their significant events point to what trends or themes helped Gold to rally so much and actually find its own local tops.
The latest one, leading to a consolidation between May to end-August 2025 was due to uncertainty on the real impact of tariffs. They hadn't seemed to hurt economies yet, particularly the US and conflicts were resolving at the same time (Israel-Iran, easing conflict in Eastern Europe... This one aged like fine milk).
The current move seems to form a typical 3 legged impulsive move with the 3rd one starting most recently. Elliott Wave analysis, which is very useful to evaluate trending markets, helps to check the state of a current trend and the usual 3rd impulsive tends to be the final one.
The one question is: Where and how could it stop?
There's an infinity of potential answers but some key changes of theme would be necessary: A more restrictive US balance sheet, forcing other governments to do the same; conflicts resolving, particularly the ongoing technology cold-war between the occident (G7) and the orient (Russia, China) or more simply a re-globalization; Finally, Central Banks Independence (i.e. the FOMC) being able to reborn.
Gold Daily Chart
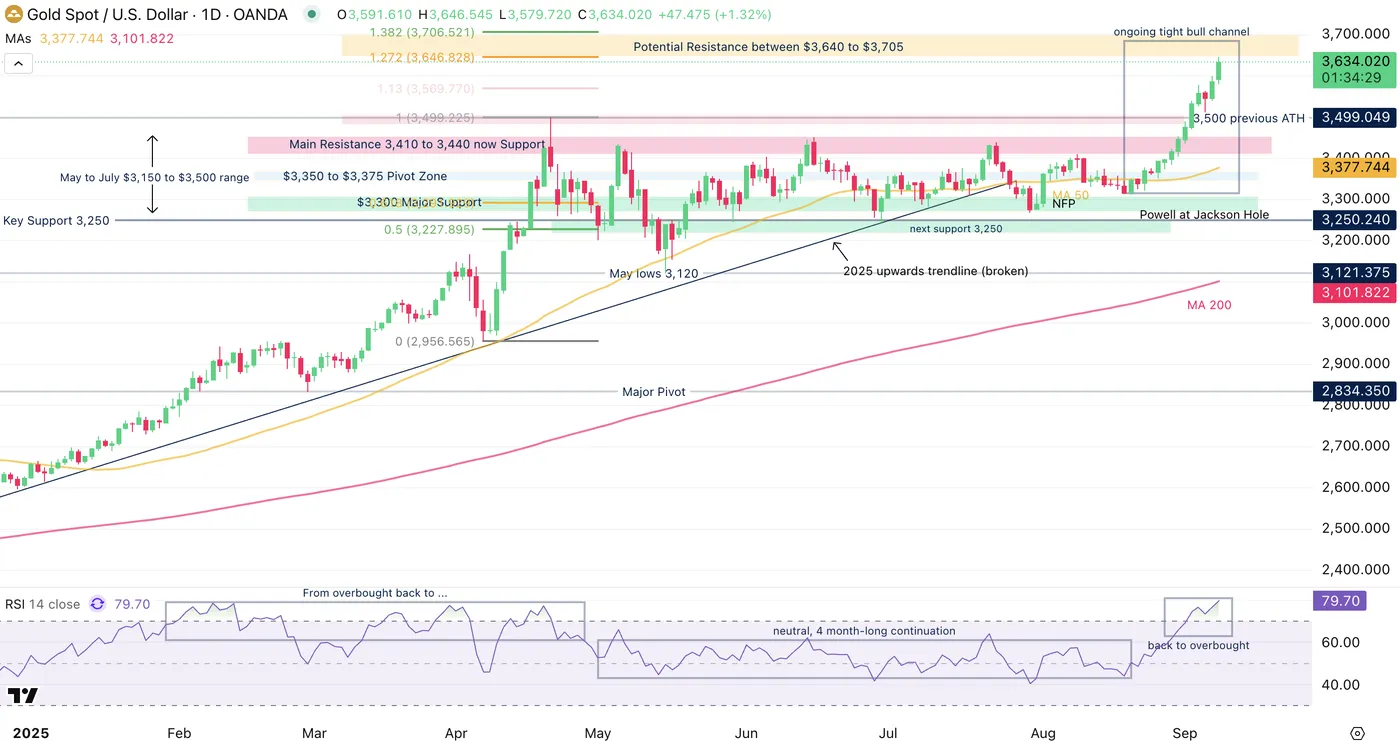
Gold Daily Chart, 8 September 2025, Source: TradingView
There is a lot to see on this daily chart but focus on these few elements:
The technical uptrend from October 2024 into the April 22nd 2025 $3,500 top in overbought conditions led to a 4-month consolidation which took the RSI back to neutral and now, the ongoing up-trend is heading back to overbought.
Remember that overbought don't mean a top, particularly in such strong trends: A tight bull channel (no red candle closing below the prior green) shows that the current price discovery is one of bullish dominance.
Any such bear candle may attract further mean-reversion.
However, some wicks are appearing after today's bull candle as the first Fibonacci-induced targets (Yellow Zone) is getting reached.
The timing coincides with Markets needing to know if the FOMC cut will be a 25 bps (consolidation/slight selloff in Gold ceteris paribus) or a 50 bps (dovish FED = metals keep flying).
Levels of interest for Gold trading:
Support:
- $3,400 to $3,500 past ATH Zone, Now Pivot/Support
- $3,300 Major Support
- $3,000 Main psychological level
Resistance and potential technical targets (due to all-time highs, can only use potential targets):
- Current session highs and ATH $3,646
- Fibonacci-Extension 1 from April Lows to April highs ($3,640 to $3,705) (yellow square)
- Potential, Fibonacci-Extension 2 from 2018 to Oct 2024 induced target: $3,750 to $3,815 (Purple square on Weekly)
Gold 4H Chart
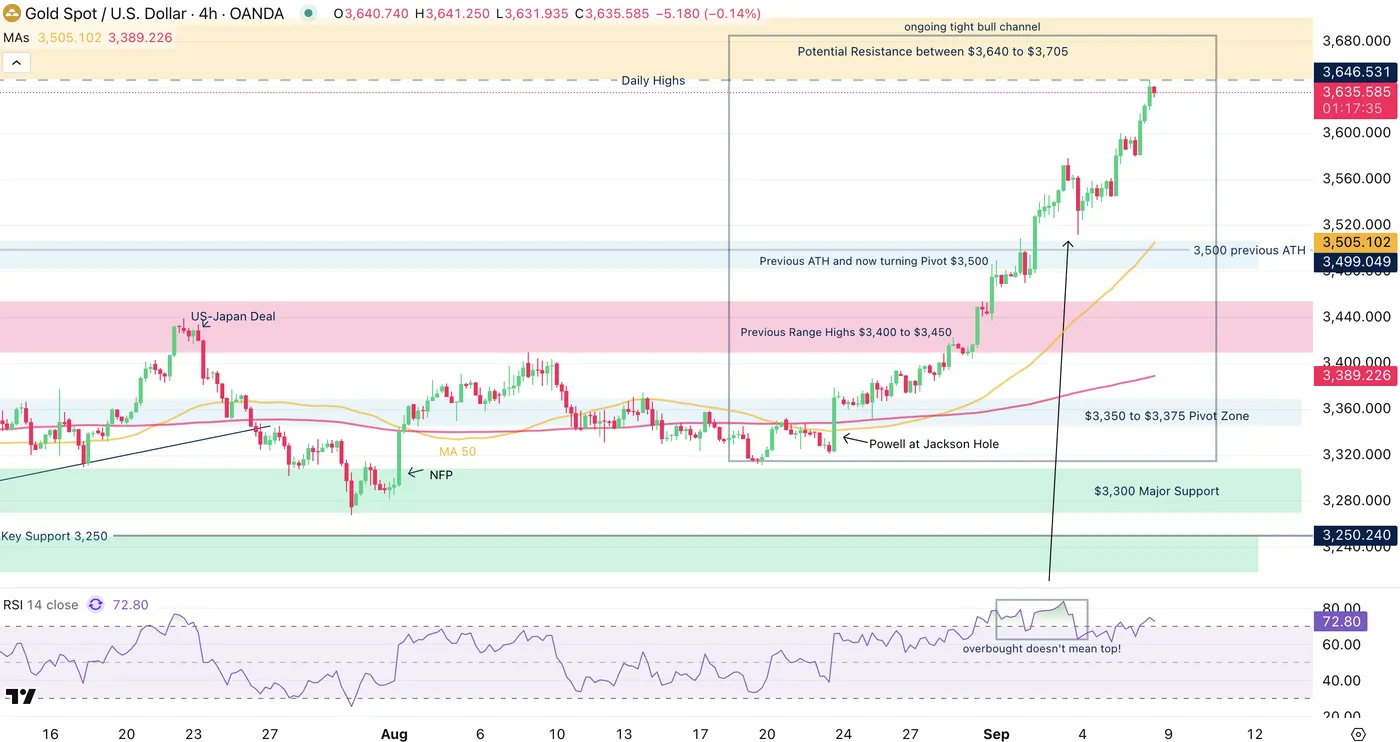
Gold 4H Chart, 8 September 2025, Source: TradingView
One highlight of this 4H intraday chart is to see how small reversals don't imply bigger trend reversals. Generally, longer term reversals show signs of forming and (tend to) start with a slowdown in the trend, except for a fundamental black swan.
We are however reaching a potential fib-target, which may imply some slowing in the buying in the waiting of US Inflation data – Do consider that the tight bull channel is still active.
Safe Trades!
Silver Price: XAG/USD Poised to Extend Gains Further, Support Likely at $40.60
Benefitting from a weak nonfarm payrolls report last week, recent demand for precious metals has secured a fresh yearly high for silver, trading at around $41.2708 at the time of writing.
Silver trades +0.68% higher in today's session.
Silver (XAG/USD): Key takeaways from today’s session
- With last week’s price action representing silver’s best weekly performance since early June, US labour data significantly missing expectations has further increased rate cut bets, benefitting non-yielding precious metals
- Otherwise, persistent inflation, spiralling US debt, and generalised lack of economic confidence are offering a significant tailwind to silver pricing
Silver (XAG/USD): September Fed rate cut virtually ‘nailed-on’ after poor labour data
Ending last week in spectacular fashion, August’s NFP report fell short of expectations significantly, offering some upside to silver, which ended
Coming in some 50,000 openings below consensus, at 22k, the result not only represents a worse-than-expected result, but also signifies the fourth consecutive month where job growth has been virtually flat.
While this is, quite literally, yesterday’s news, the report has all but confirmed that the Federal Reserve will cut target rates in its upcoming decision, aiming to kickstart an otherwise struggling labour market.
Notwithstanding, recent dovish commentary from the Federal Reserve has also fed into the same narrative.
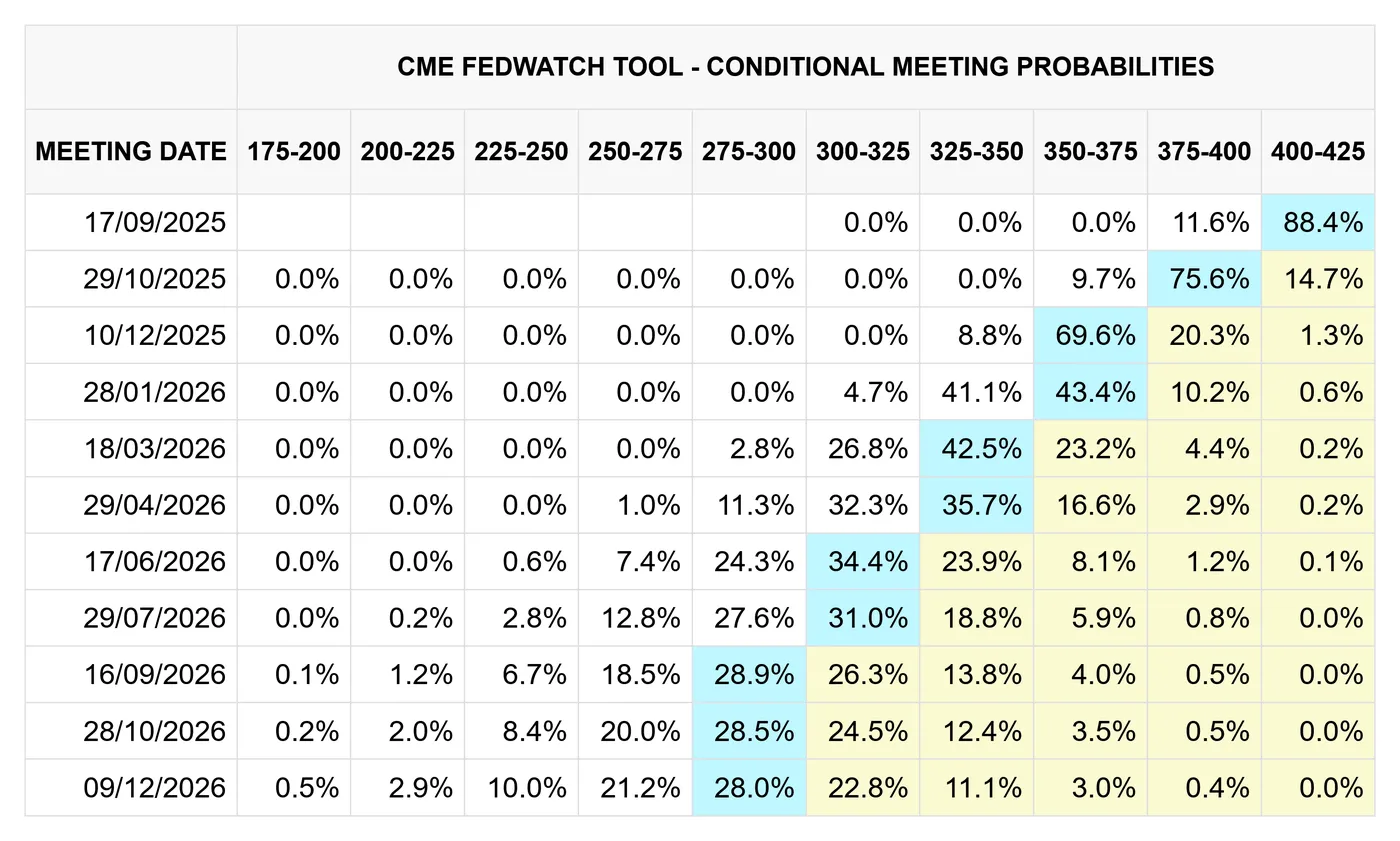
CME FedWatch, 08/09/2025
At the time of writing, CME FedWatch rates a 25 bps cut at an 88.4% probability, which indicates a rare level of confidence in the Fed’s next decision.
As expected, a non-yielding asset such as silver stands to benefit from any suggestion that rate cuts are becoming more likely, as proven by price action on Friday. At least for now, upside seems to have continued somewhat into this week’s trading.
Silver (XAG/USD): Safe-haven flows and inflationary pressures still at play
While the dollar looks set to continue its downtrend, it would be fair to say markets remain wary of the US economy, in no small part thanks to questions surrounding current sovereign debt, trade agreements and inflation.
For now, these questions largely remain unanswered. This uncertainty dampens risk appetite, significantly boosting precious metal gains, a phenomenon seen for much of this year.
In the latter case, sticky inflation, at least in a vacuum, is favourable for silver pricing, with many looking to precious metals as a means of hedging inflation. While heightened inflation can sometimes be met with a rate hike, typically silver negative, a struggling labour market will almost certainly force the Fed’s hand in cutting rates this time around.
Coupled with renewed safe-haven flows on general recession fears, at least in the short term, one outcome is a two-sided tailwind helping bolster further precious metal gains - silver included.
Silver (XAG/USD): Technical analysis - 08/09/2025
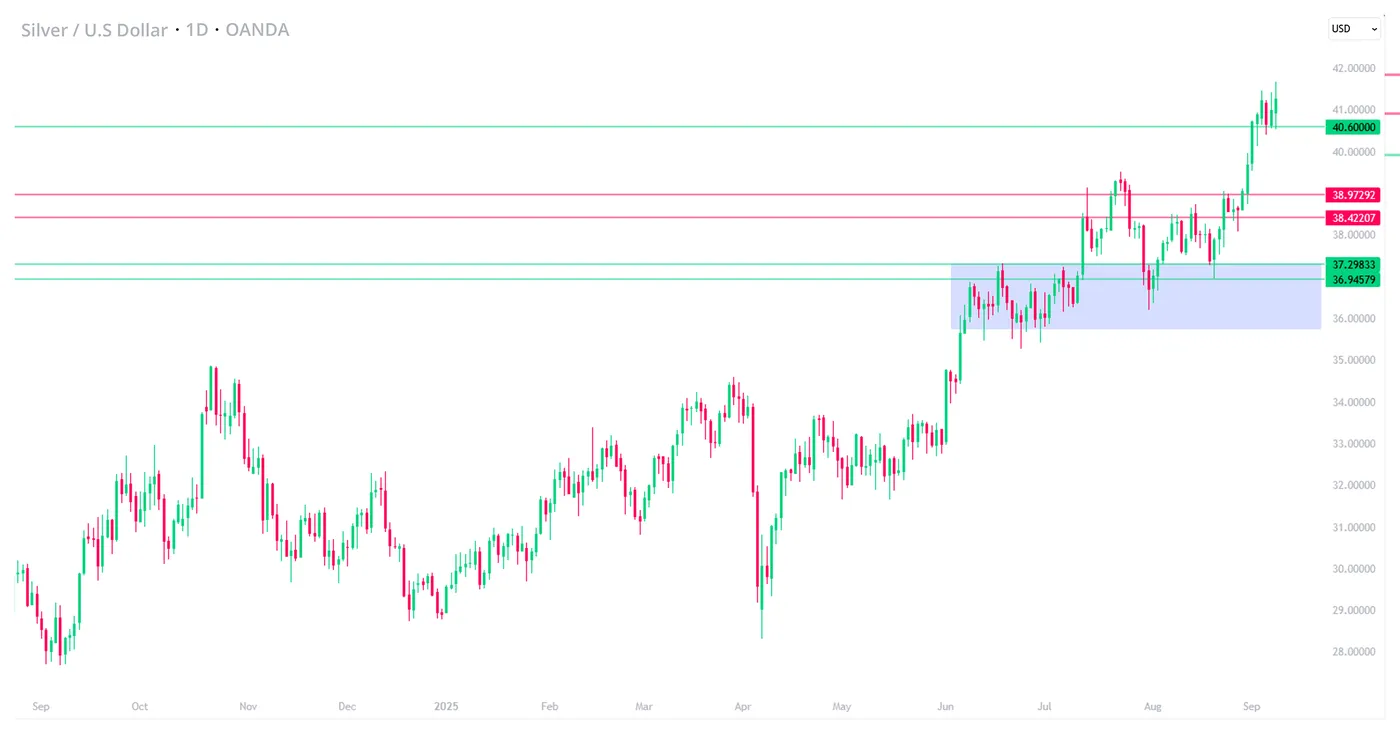
Silver (XAG/USD), OANDA, TradingView, 08/09/2025
On the daily timeframe, current price action remains well supported. If price can stay above $40.60, bulls will likely target $42.72 in the near term
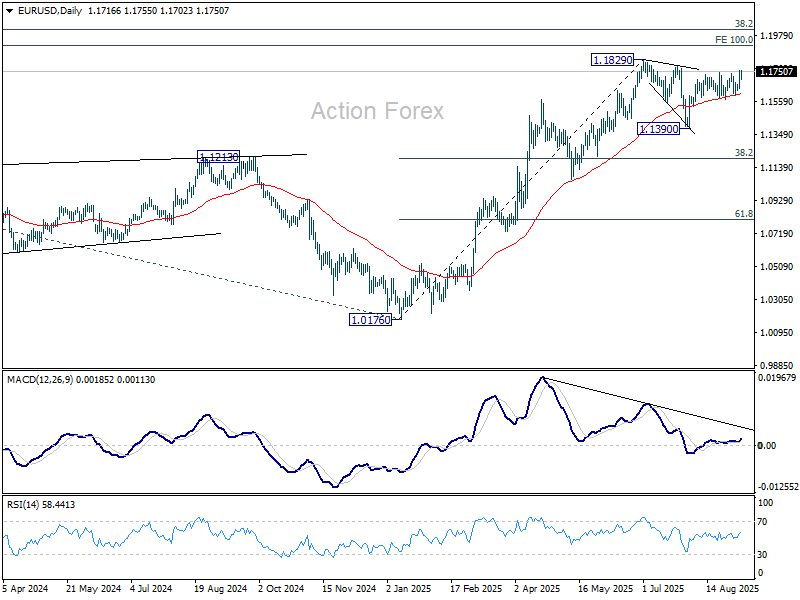
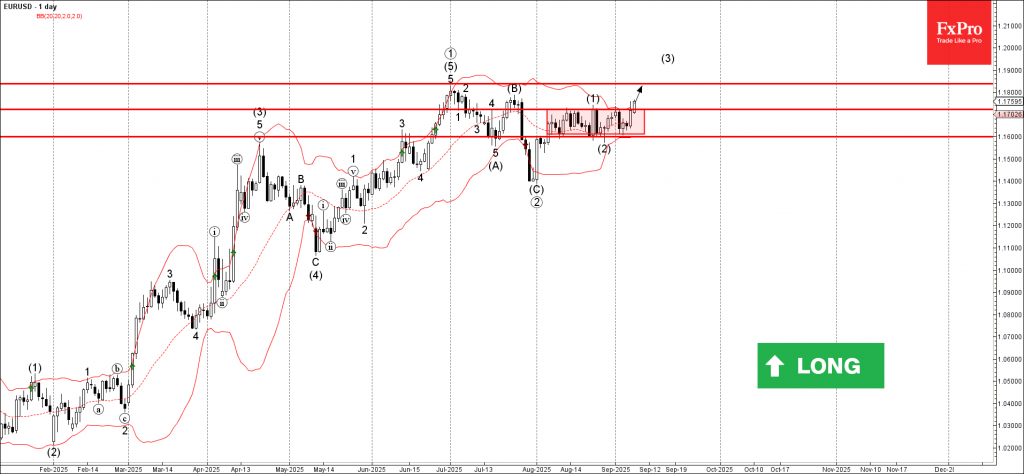
EURUSD Wave Analysis
EURUSD: ⬆️ Buy
- EURUSD broke resistance level 1.1720
- Likely to rise to resistance level 1.1835
EURUSD currency pair recently broke the resistance level 1.1720 (which is the upper border of the narrow sideways price range inside which the pair has been moving from the start of August).
The breakout of this sideways price range should accelerate the active impulse wave (3) from the end of last month.
Given the clear daily uptrend, EURUSD currency pair can be expected to rise toward the next resistance level 1.1835 (former multi-month high from July).
Australian Dollar Hits Two-Week High, Confidence Data Next
The Australian dollar has extended its gains on Monday. In the North American session, AUD/USD is trading at 0.6588, up 0.49% on the day. Earlier, the Australian dollar climbed to a daily high of 0.6598, its highest level since July 25.
The US dollar ended the week broadly lower, as investors dumped the greenback after the soft US employment report. August nonfarm payrolls fell to 22 thousand, well below the revised market estimate of 79 thousand and lower than the July gain of 75 thousand. The Australian dollar rose as much as 1.1% on Friday before giving up about half its gains.
Australian confidence levels are expected to show an improvement on Tuesday. Westpac Consumer Confidence is projected to rise 1.0% in September after a strong 5.7% gain in August. The NAB Business Confidence has been moving higher and is expected to rise in August to 8 points from 7 a month earlier, which was the highest reading since August 2022.
Chinese exports slip
US tariffs are taking their toll on China's economy. In August, China's exports to the US fell by 33%. The US and China extended a trade truce in August, but that has still left US tariffs of 55% on Chinese goods and 35% Chinese tariffs on US goods.
China is in a deflationary phase and growth has been subdued. This does not bode well for the Australian economy or the Aussie, as China is Australia's largest trading partner. Australia hasn't been hit as hard as other countries by US trade policy, with tariffs of 10% on Australian products, but the US-China trade war could pose a serious headache for Australia's export sector.
AUD/USD Technical
- The Australian dollar tested resistance at 0.6594 earlier. Above, there is resistance at 0.6633
- 0.6551 and 0.6512 are providing support
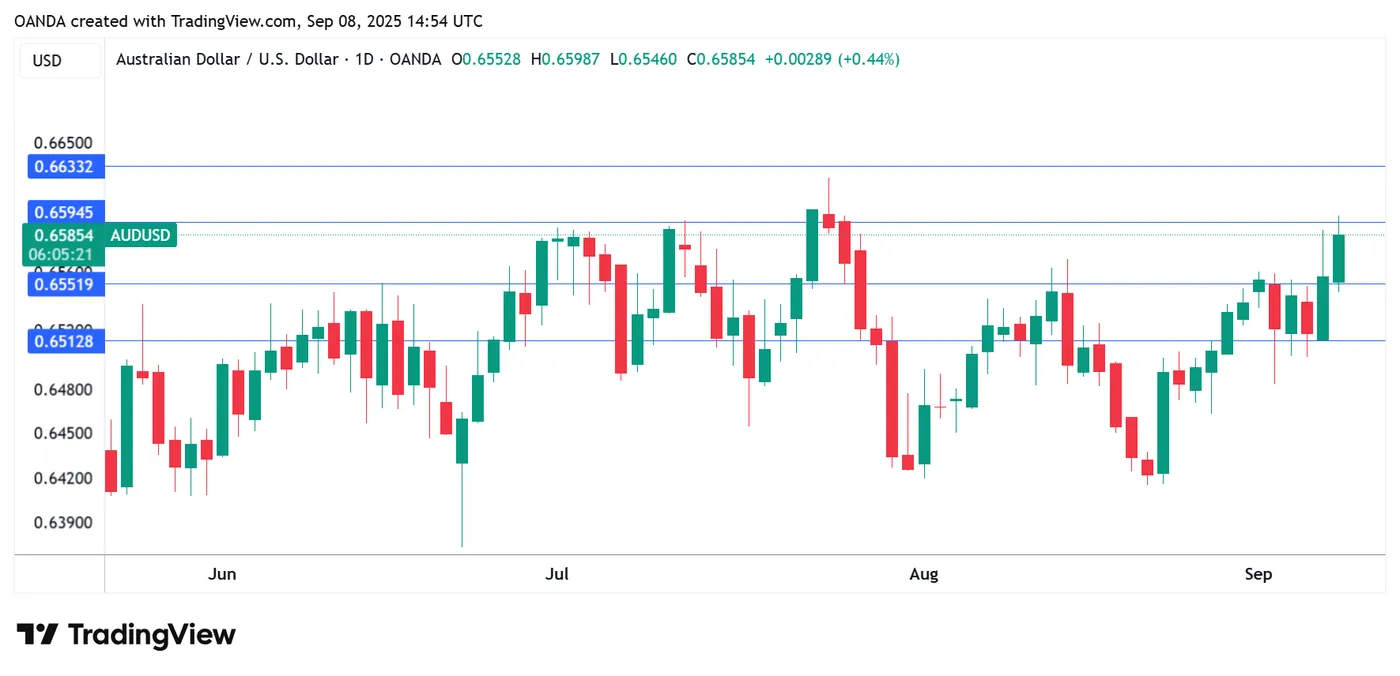
AUDUSD 1-Day Chart, September 8, 2025
Sunset Market Commentary
Markets
Markets took a calm start to what could become an interesting trading week. Things kick off tonight with French PM Bayrou’s self-imposed confidence vote on his plans to tackle derailing public finances. While a defeat is market’s base scenario, a lot uncertainty remains on the way forward with all eyes directed at French president Macron afterwards. Will he put efforts in finding yet again a new “neutral” candidate to help overcome major ideological viewpoints in the hung parliament, ending in less fiscal discipline than proposed by PM Bayrou, or immediately throw the towel by calling early elections? Both scenarios suggest French assets will face continued pressure in the short term especially with the country’s credit rating at risk on Friday (AA- with negative outlook) of falling into single A category for a first time (Moody’s Aa3 stable, S&P AA- negative). Tomorrow’s key talking point will be the US Bureau of Labour Statistics’ preliminary benchmark revision to the establishment survey data for the 12 months through March 2025. Using more comprehensive data from the Quarterly Census of Employment and Wages, the BLS revises job data with final revisions due in March of next year. Markets anticipate significant downward revisions in line with last year when the job numbers in the 12 months to March 2024 were downwardly revised by 818k mainly because of issues with the birth-death model of companies and undocumented immigration. A significant revision might push US money markets into attaching a larger probability to a 50 bps Fed rate cut next week as it confirms fears of deeper labour market weakness. The BLS revisions need to be balanced with August US producer price (Wednesday), consumer price inflation (Thursday) and inflation expectations in the University of Michigan consumer survey for September (Friday) which are expected to reveal more signs of tariff-related inflation and argue in favour of a more gentle 25 bps rate cut next week. On Thursday, ECB President Lagarde probably faces one of the more easy-going press conferences since taking the helm at the central bank. An unchanged policy decision will be backed by nearly unchanged GDP and CPI forecasts in a world of reduced geopolitical uncertainty. It helps Lagarde spreading the message that monetary policy is in a comfortable position to face the future. We see a next evaluation point as early as March of next year. EMU money markets currently err slightly on the dovish side, pricing a 37% probability of a rate cut before year-end. Finally, we keep a close eye at the US Treasury’s mid-month refinancing operation. Tuesday’s $58bn 3-yr Note sale is followed by a $39bn 10-yr Note deal on Wednesday and a $22bn 30-yr Bond auction on Thursday. The recent bull steepening of the US yield curve also helped the very long end of the curve (30-yr) away from make-or-break levels (5%). Question remains whether there will be a lot of interest at current levels given the still dire shape of US finances and political & reputational risk still present (eg Fed independence debate).
News & Views
Two weeks ahead of the Swiss National Bank’s September policy meeting, the central bank’s governor took a critical view of reintroducing negative interest rates. The current level stands at 0% and recent inflation numbers (0.2% y/y) at first glance suggest further monetary easing is perhaps needed. Martin Schlegel in an interview with Migros Magazin, however, said the hurdle to revert back to an era of negative rates is high. He added that it can have undesirable side effects, for example for savers and pension funds. Schlegel pushed back when asked whether the central bank shot its monetary powder too early, saying that making forward-looking decisions is key in order to avoid having to take stronger countermeasures later. Schlegel’s views were in line with those the vice-governor aired end of August. Market implied odds for another 25 bps cut remain around 25% for end 2025 though. The Swiss franc strengthens today to EUR/CHF 0.932. Schlegel in the interview wasn’t so concerned about the strong CHF, since its real appreciation was not as great.
The EU is considering a 19th sanction package against Russia over its war with Ukraine. The sanctions would target about half a dozen Russian banks and energy companies as well as Russia’s payment and credit card systems, crypto exchanges and additional restrictions on its oil trade. Oil prices rebound today after losing ground over the three previous trading sessions, when it anticipated OPEC’s decision last week to further restore oil output. Brent currently trades around $66.8 per barrel and remains firmly established within a $65-$75 sideways trading range.
Japan’s GDP Sparkles, Yen Pushes Higher
The Japanese yen is in positive territory on Monday. In the European sesssion, USD/JPY is trading at 147.87, down 0.35% on the day.
Japan's economy expands 2.2% in Q2
The week has started on a positive note in Japan, as GDP for the second quarter was revised sharply higher to 2.2% y/y, up from the initial reading of 1.0% and above the Q1 gain of 0.3%.
This was the fastest pace of growth since Q3 2024, as private consumption was higher, in part due to government subsidies for rice and energy. Exports were higher as firms rushed to ship to the US before the blanket 15% tariffs kicked in. On a quarterly basis, GDP expanded 0.5%, up from the initial reading of 0.3%.
The increase in exports could be short-lived, as the US tariffs are making Japanese exports more expensive. Tariffs concerns could delay the Bank of Japan from raising interest rates, and third-quarter GDP will help gauge the effect of the tariffs on Japan's economy.
The political uncertainty in Japan is another factor which supports the BoJ staying on the sidelines. Prime Minister Shigeru Ishiba has resigned after a disastrous election in which Ishiba's coalition lost its majority in the lower house of parliament. It remains unclear who will replace Ishiba, with leadership vote expected in October.
US nonfarm payrolls fall to 22 thousand
US nonfarm payrolls disappointed with a marginal gain of 22 thousand, well below the upwardly revised gain of 79 thousand in July and the market estimate of 75 thousand. The unemployment rate edged up to 4.3% from 4.2%, the highest level since December 2021.
The money markets responded to the weak nonfarm payrolls report by fully pricing in a rate cut at next week's meeting, with a 90% probability of a quarter-point cut and a 10% chance of a half-point cut, according to CME's FedWatch. Prior to the jobs release, there was a 0% chance of a half-point cut.
USD/JPY Technical
- USD/JPY is testing support at 147.60. Next, there is support at 146.62
- There is resistance at 148.37 and 149.35
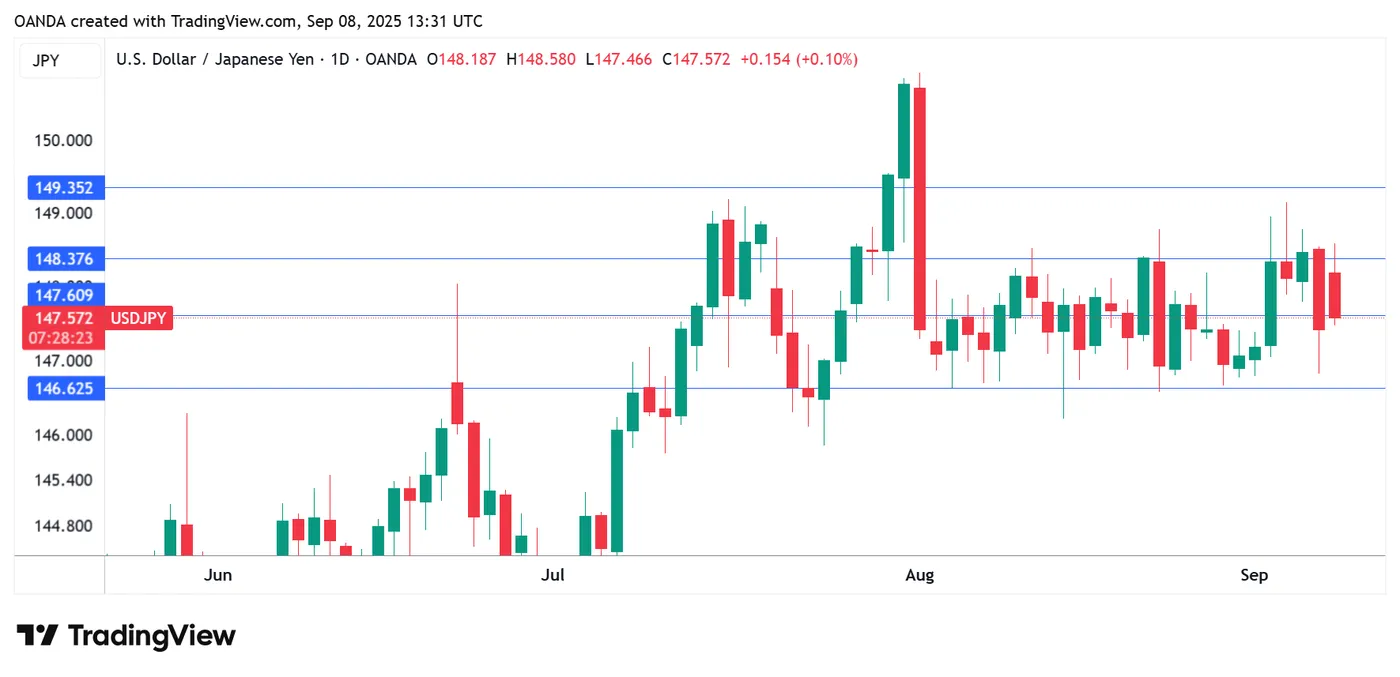
USDJPY 1-Day Chart, September 8, 2025
EUR/USD Mid-Day Outlook
Daily Pivots: (S1) 1.1656; (P) 1.1708; (R1) 1.1771; More...
Intraday bias in EUR/USD remains on the upside, and rise from 1.1390 should target a retest on 1.1829 high. Firm break there will resume larger up trend to 1.1916 projection level. On the downside, below 1.1702 minor support will turn intraday bias neutral first. But risk will stay on the upside as long as 1.1607 support holds, in case of retreat.

In the bigger picture, rise from 0.9534 (2022 low) long term bottom could be correcting the multi-decade downtrend or the start of a long term up trend. In either case, further rise should be seen to 100% projection of 0.9534 to 1.1274 from 1.0176 at 1.1916. This will remain the favored case as long as 1.1604 support holds.