Sample Category Title
Canadian Dollar Falls After Labour Market Data Release
On Friday, disappointing figures showed that in August the Canadian economy lost 65,500 jobs (the forecast had been for an increase of 10,000), while the unemployment rate rose to 7.1%. This is the highest level of unemployment since May 2016, excluding the pandemic period.
It is believed that:
→ the deterioration in the labour market (primarily in manufacturing) is a consequence of the trade war with the United States;
→ the fall in employment in Canada has increased the likelihood that the Bank of Canada will resume its monetary easing campaign.
As a result, the CAD weakened sharply against other currencies. However, the depreciation against the US dollar was less pronounced, as the USD itself is under pressure from various factors.
Technical Analysis of USD/CAD
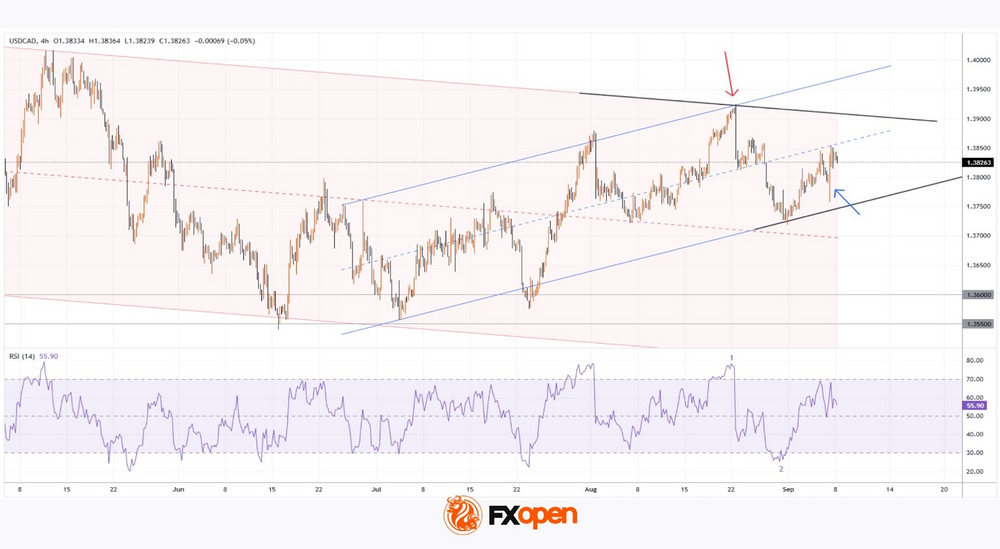
From a long-term perspective, the USD/CAD pair remains within a downward trend, highlighted by a red descending channel.
From a medium-term perspective, since July the rate has risen from the 1.3550–1.3600 support zone, forming an ascending channel (shown in blue).
Price action (indicated by arrows) shows that:
→ sellers are aggressive, pushing the price down from the upper boundary of the red channel;
→ buyers are aggressive, driving the price up from the lower boundary of the blue channel. Its median line acts as resistance.
This is compressing USD/CAD fluctuations into a pattern resembling a symmetrical narrowing triangle (shown in black), with recent overbought (1) and oversold (2) conditions on the RSI marking price reversals back into the triangle from its boundaries.
Thus, we could assume that supply and demand forces will keep USD/CAD in a state of temporary balance while awaiting key news next week:
→ 16 September – Canada CPI report;
→ 17 September – interest rate decisions from both the Bank of Canada and the Federal Reserve.
Trade over 50 forex markets 24 hours a day with FXOpen. Take advantage of low commissions, deep liquidity, and spreads from 0.0 pips. Open your FXOpen account now or learn more about trading forex with FXOpen.
This article represents the opinion of the Companies operating under the FXOpen brand only. It is not to be construed as an offer, solicitation, or recommendation with respect to products and services provided by the Companies operating under the FXOpen brand, nor is it to be considered financial advice.
NZD/USD and AUD/USD Rally Attempts, Will Buyers Stay in Charge?
AUD/USD started a decent increase above 0.6580. NZD/USD is also rising and might aim for more gains above 0.5920.
Important Takeaways for AUD USD and NZD USD Analysis Today
- The Aussie Dollar started a decent increase above 0.6545 against the US Dollar.
- There was a break above a contracting triangle with resistance at 0.6530 on the hourly chart of AUD/USD at FXOpen.
- NZD/USD is consolidating gains above the 0.5880 pivot level.
- There was a break above a major bearish trend line with resistance at 0.5870 on the hourly chart of NZD/USD at FXOpen.
AUD/USD Technical Analysis
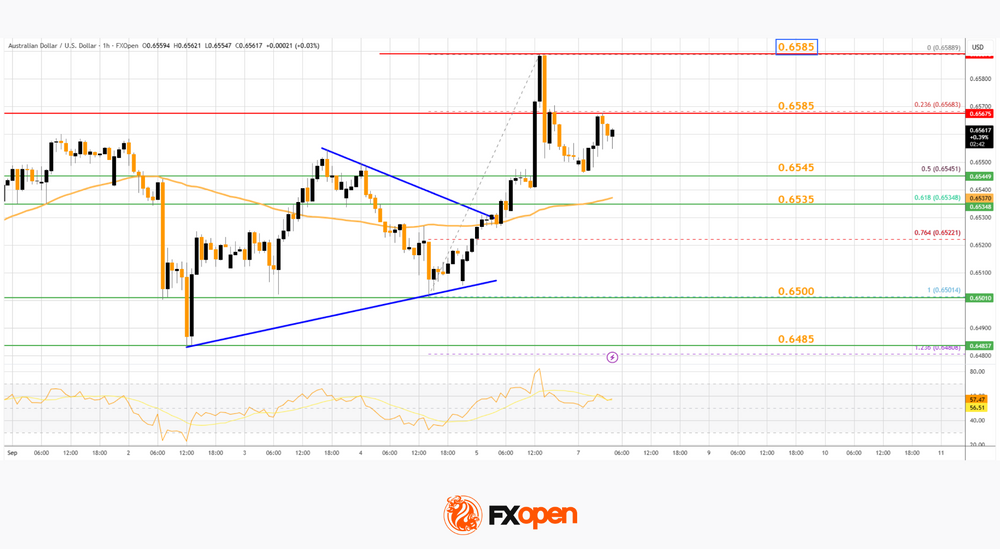
On the hourly chart of AUD/USD at FXOpen, the pair started a fresh increase from 0.6500. The Aussie Dollar was able to clear 0.6520 to move into a positive zone against the US Dollar.
The bulls cleared a contracting triangle with resistance at 0.6530. There was a close above the 0.6550 resistance and the 50-hour simple moving average. Finally, the pair tested 0.6585. A high was formed near 0.6588 and the pair recently started a consolidation phase.
There was a move below the 23.6% Fib retracement level of the upward move from the 0.6501 swing low to the 0.6588 high. On the upside, the AUD/USD chart indicates that the pair is now facing resistance near 0.6585.
An upside break above 0.6585 might send the pair further higher. The next stop is near 0.6640. Any more gains could clear the path for a move toward the 0.6700 handle.
On the downside, initial support is near the 50% Fib retracement at 0.6545. The next area of interest could be near the 50-hour simple moving average at 0.6535.
If there is a downside break below 0.6535, the pair could extend its decline toward the 0.6500 zone. Any more losses might signal a move toward 0.6485.
NZD/USD Technical Analysis
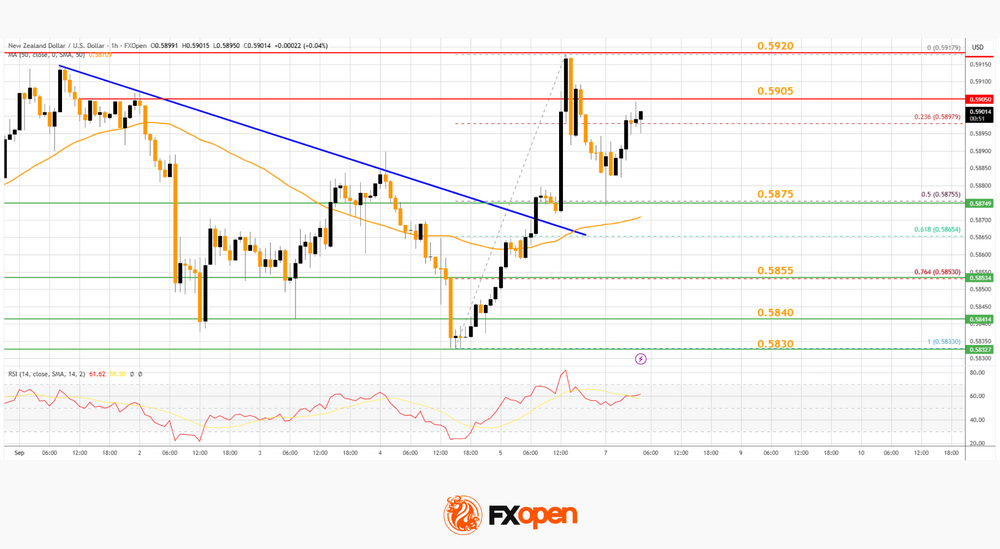
On the hourly chart of NZD/USD at FXOpen, the pair started a decent increase from 0.5830. The New Zealand Dollar broke the 0.5855 barrier to start the recent rally against the US Dollar.
Moreover, there was a break above a major bearish trend line with resistance at 0.5870. The pair settled above 0.5875 and the 50-hour simple moving average. It tested 0.5920 and is currently consolidating gains.
There was a move below the 23.6% Fib retracement level of the upward move from the 0.5833 swing low to the 0.5917 high. The NZD/USD chart suggests that the RSI is stable above 50.
On the upside, the pair might struggle near 0.5905. The next major resistance is near the 0.5920 level. A clear move above 0.5920 might even push the pair toward 0.5965. Any more gains might clear the path for a move toward the 0.6000 handle in the coming days.
On the downside, immediate support is near the 0.5875 level. The first key zone for the bulls sits at 0.5855 and the 76.4% Fib retracement. The next key level is 0.5840. If there is a downside break below 0.5840, the pair might slide toward 0.5800. Any more losses could lead NZD/USD in a bearish zone to 0.5750.
Trade over 50 forex markets 24 hours a day with FXOpen. Take advantage of low commissions, deep liquidity, and spreads from 0.0 pips. Open your FXOpen account now or learn more about trading forex with FXOpen.
This article represents the opinion of the Companies operating under the FXOpen brand only. It is not to be construed as an offer, solicitation, or recommendation with respect to products and services provided by the Companies operating under the FXOpen brand, nor is it to be considered financial advice.
Market Focus Turns to Political Issues
Markets
After a series of mediocre labour market data/subindices published earlier last week, the US payrolls report gave the final go-ahead for the Fed to restart its easing cycle and move the policy rate to a more neutral level. The US economy on August only added 22k of new jobless (75K expected) and releases of the previous two months were slightly downwardly revised. Job growth even declined in several cycle sectors. The jobless rate rose to 4.3% from 4.2%. Average hourly earnings at 0.3% M/M and 3.7% Y/Y were close to expectations but also suggest some mild easing. The soft payrolls release pulled the trigger from markets to prepare for a scenario of the Fed reducing its policy rate by 25 bps at each of the 3 remaining months of the year (+/- 70 bps cumulative discounted). US bond yields declined between 6.4 bps (5-y) and 9.5 bps (30-y). Even as the report wasn’t a reason to amend expectations on ECB policy, Germany yields in lockstep eased between 5.7 bps (10-y) and 3.5 bps (2-y). The dollar softened on losing interest rate support but the damage could have been bigger, probably as other competitors like the euro, sterling and the yen also have to cope with ‘domestic issues’. For now major US cross rates held within the established range as no key support levels were broken (DXY 97.75 from 98.24; EUR/USD 1.1717 from 1.165 & USD/JPY 147.43 from 148.49). US equities opened at record levels for the three main indices (Dow, S&P500 and Nasdaq) but gains could not be sustained (S&P 500 -0.32%).
This morning, the market focus post the US payrolls turns to political issues. There are few important eco data on the calendar in Europe or the US today. In Japan, markets are pondering the (fiscal) consequences of Japanese PM resigning. In Europe, fiscal sustainability also remains on the radar as the French government of PM Bayrou is unlikely to survive a confidence vote. President Macron can try to install a new PM/government or call early elections. However, both options provide little prospect for progress on the highly needed fiscal consolidation. The issue might weigh on intra-EMU risk premia and cap any sustained gains in EUR/USD. Sterling this morning also trades in the defensive (EUR/GBP 0.868) after PMI Starmer end last week reshuffled his government. Question remains whether this will facilitate Fin Min Reeves task of fixing the UK budget. Different indicators published this morning (Incomes Data research, KPMG & Rec) suggest ongoing cooling in the labour market and in wage growth.
News & Views
Fitch lowered Poland’s credit rating outlook to negative from stable. It kept the rating itself at A-. The outlook downgrade reflects the deteriorating public finances and the lack of credible fiscal consolidation as well as increased political challenges to implement it in the future. The rating agency said the next parliamentary elections in 2027 will likely complicate any efforts to do so. Deficits are projected to increase to 6.9% in 2025 and to remain well above 6% at least through 2027. Debt by the end of that horizon is seen rising to 68.3%, to be compared to <50% in 2023. The high credit quality Poland’s A- rating represents is supported by a large, diversified and resilient economy, a record of sound macroeconomic policies, solid external finances and a higher and more stable government revenue base than peers. Fitch said. It expects 3.2% growth in 2025 and 2026 and average inflation of 3.9% and 3.3% respectively.
Japanese prime minister Ishiba announced yesterday that he’ll resign from office. Ishiba pre-empted a vote within his own Liberal Democratic Party scheduled for today whether to bring forward a leadership election. But that increasingly risked turning into a confidence vote in which defeat was near-certain. Ishiba’s position became untenable after suffering major election losses that stripped the LDP from its majority in both chambers of parliament. The LDP is rumoured to hold leadership elections early October. The LDP leader traditionally becomes the new prime minister. Ishiba will remain in post until then. The political uncertainty comes against the backdrop of growing concerns about public finances. Ishiba so far resisted calls for even more fiscal largesse (eg. consumption tax cuts) but his successor might not. The long end of the Japanese yield curve underperforms this morning with the 30-year yield adding almost 3 bps. The Japanese yen lags peers.
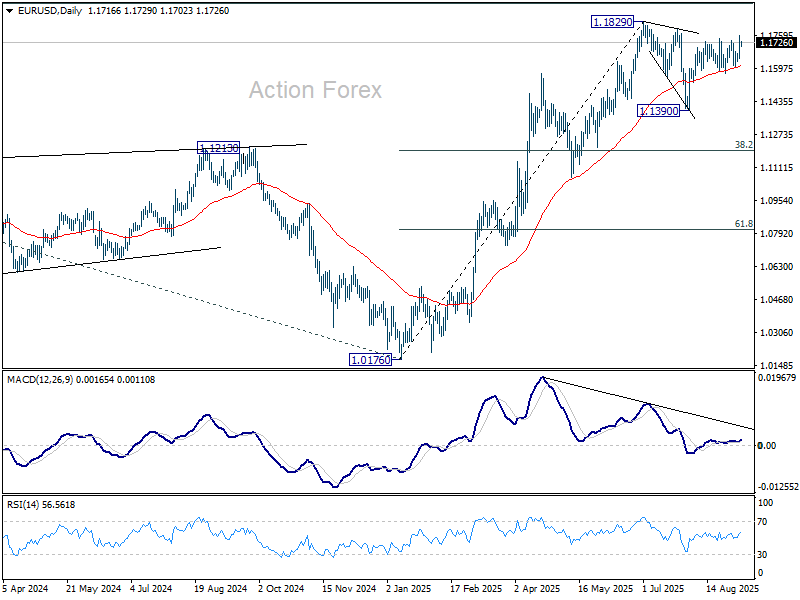
EUR/USD Daily Outlook
Daily Pivots: (S1) 1.1656; (P) 1.1708; (R1) 1.1771; More...
Intraday bias in EUR/USD remains on the upside for the moment. Rise from 1.1390 is resuming and further rally should be seen to retest 1.1829 high. Firm break there will resume larger up trend to 1.1916 projection level. For now, risk will stay on the upside as long as 1.1607 support holds, in case of retreat.
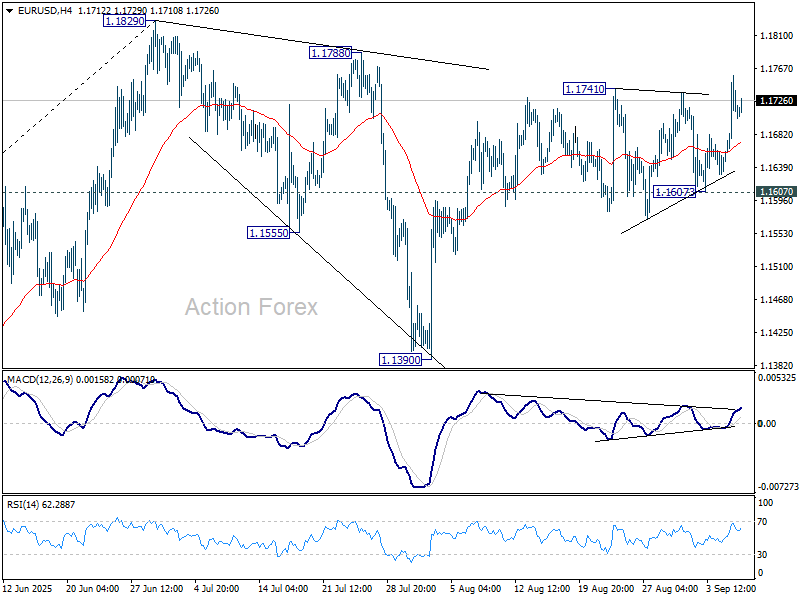
In the bigger picture, rise from 0.9534 (2022 low) long term bottom could be correcting the multi-decade downtrend or the start of a long term up trend. In either case, further rise should be seen to 100% projection of 0.9534 to 1.1274 from 1.0176 at 1.1916. This will remain the favored case as long as 1.1604 support holds.
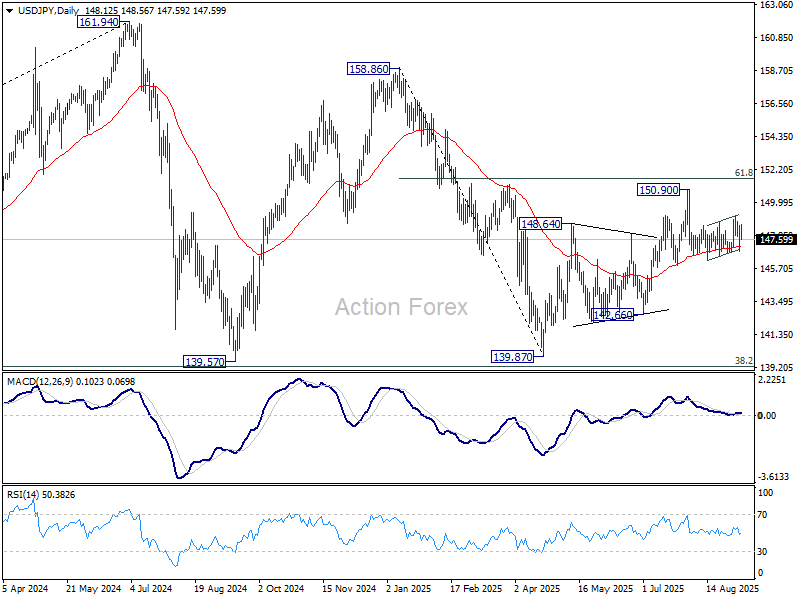
USD/JPY Daily Outlook
Daily Pivots: (S1) 146.62; (P) 147.60; (R1) 148.37; More...
USD/JPY rebounded today as range trading continues and intraday bias stays neutral. On the downside, break of 146.65 will suggest that fall from 150.90 is resuming. More importantly, sustained trading below 55 D EMA (now at 147.15) will argue that whole rebound from 139.87 has completed with three waves up to 150.90. Deeper decline should then be seen to 142.66 support next. However, break of 149.12 will turn bias back to the upside for retesting 150.90.
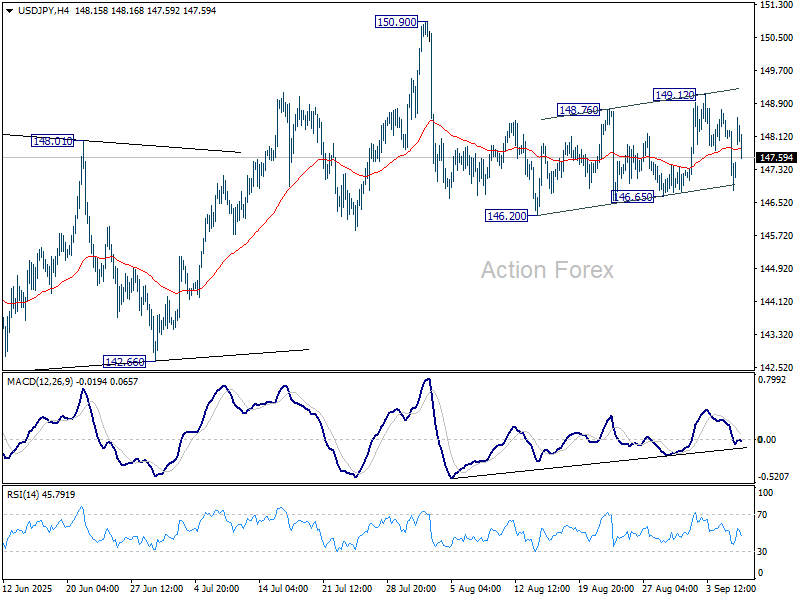
In the bigger picture, price actions from 161.94 (2024 high) are seen as a corrective pattern to rise from 102.58 (2021 low). Decisive break of 61.8% retracement of 158.86 to 139.87 at 151.22 will argue that it has already completed with three waves at 139.87. Larger up trend might then be ready to resume through 161.94 high. In case the corrective pattern extends with another fall, strong support is expected from 38.2% retracement of 102.58 to 161.94 at 139.26 to bring rebound.
GBP/USD Daily Outlook
Daily Pivots: (S1) 1.3436; (P) 1.3495; (R1) 1.3568; More...
Intraday bias in GBP/USD stays on the upside for the moment. Rise from 1.3140 should be ready to resume. Firm break of 1.3594 resistance will confirm and target a retest on 1.3787 high. For now, risk will stay on the upside as long as 1.3332 support holds, in case of retreat.
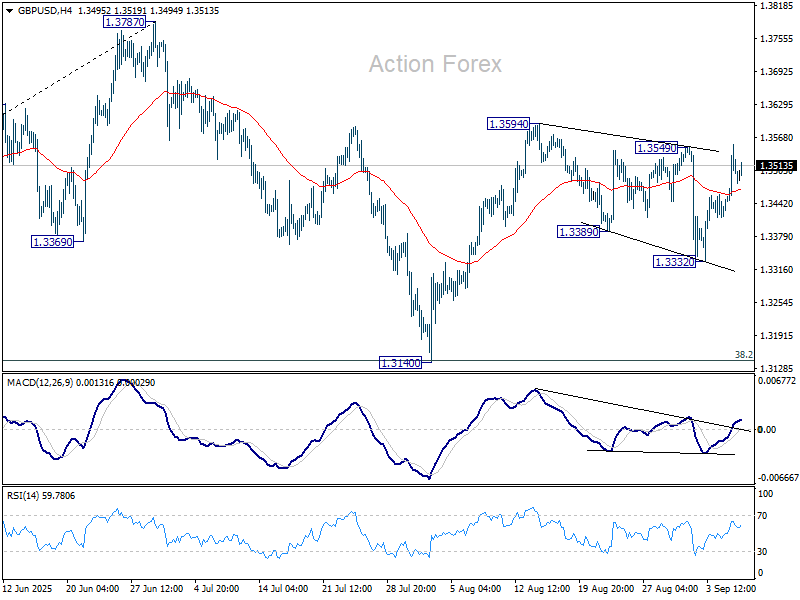
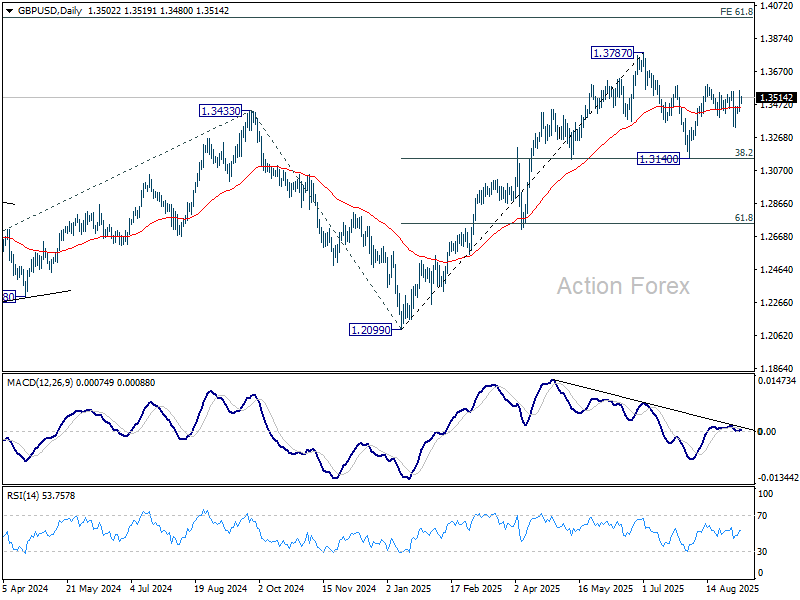
In the bigger picture, up trend from 1.3051 (2022 low) is in progress. Next medium term target is 61.8% projection of 1.0351 to 1.3433 from 1.2099 at 1.4004. Outlook will now stay bullish as long as 55 W EMA (now at 1.3132) holds, even in case of deep pullback.
USD/CHF Daily Outlook
Daily Pivots: (S1) 0.7936; (P) 0.8000; (R1) 0.8043; More….
Intraday bias in USD/CHF remains on the downside for the moment. Corrective rebound from 0.7871 should have completed with three waves up to 0.8170. Deeper fall should be seen to 0.7910 support first, and then 0.7871 low. For now, risk will stay on the downside as long as 0.8071 resistance holds, in case of recovery.

In the bigger picture, long term down trend from 1.0342 (2017 high) is still in progress. Next target is 100% projection of 1.0146 (2022 high) to 0.8332 from 0.9200 at 0.7382. In any case, outlook will stay bearish as long as 0.8475 resistance holds.

AUD/USD Daily Report
Daily Pivots: (S1) 0.6512; (P) 0.6551; (R1) 0.6594; More...
Intraday bias in AUD/USD stays on the upside and further rise should be seen to retest 0.6624 high. Firm break there will resume larger rally from 0.5913 to 0.6713 fibonacci level. For now, risk will stay on the upside as long as 0.6500 support holds, in case of retreat.
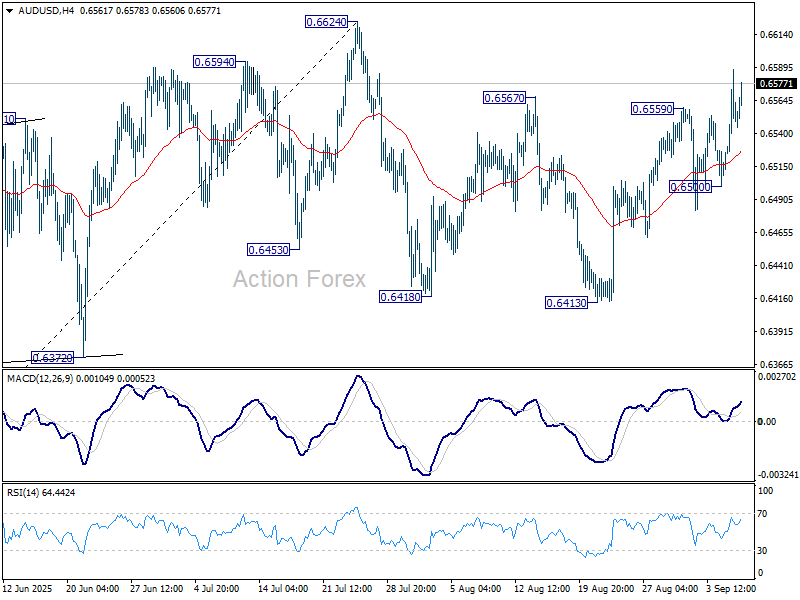
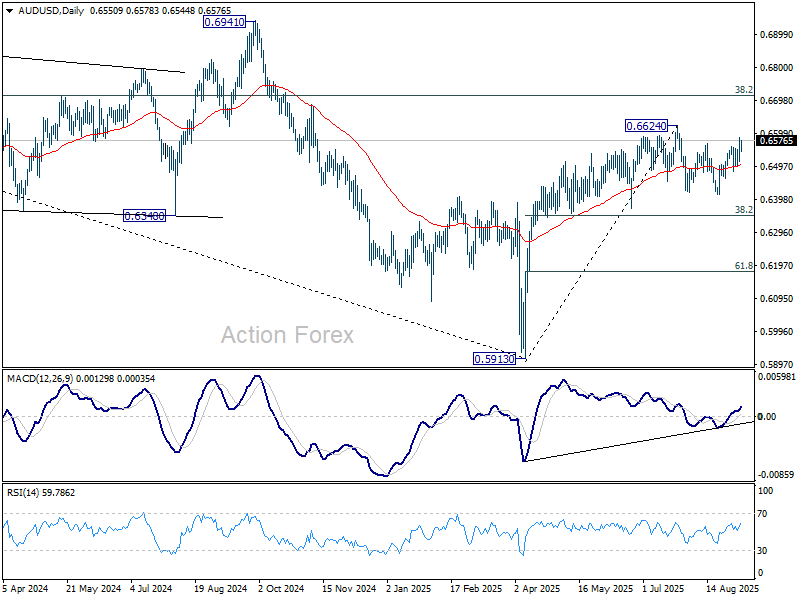
In the bigger picture, there is no clear sign that down trend from 0.8006 (2021 high) has completed. Rebound from 0.5913 is seen as a corrective move. While stronger rally cannot be ruled out, outlook will remain bearish as long as 38.2% retracement of 0.8006 to 0.5913 at 0.6713 holds. Nevertheless, considering bullish convergence condition in W MACD, even in case of another fall through 0.5913, downside should be contained above 0.5506 (2020 low).
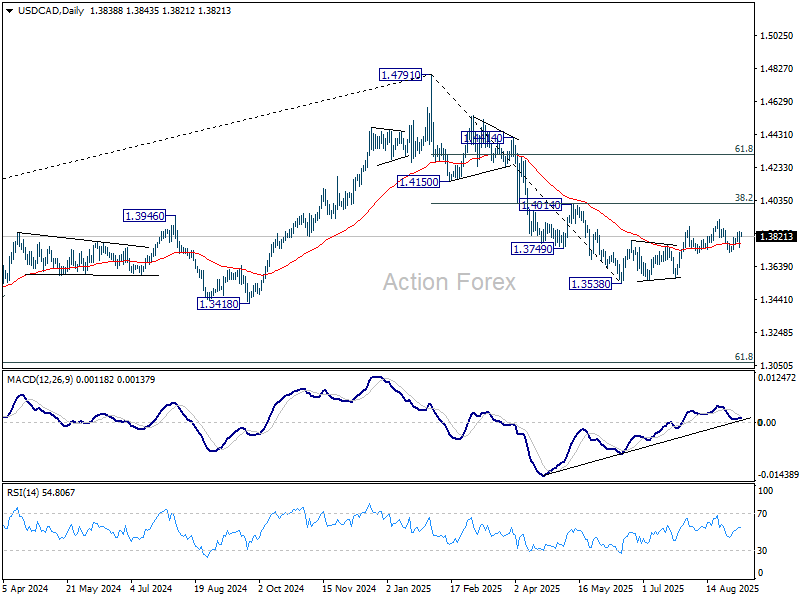
USD/CAD Daily Outlook
Daily Pivots: (S1) 1.3774; (P) 1.3814; (R1) 1.3869; More...
Intraday bias in USD/CAD remains on the upside at this point. Pullback from 1.3923 could have completed at 1.3725 already, and corrective rebound from 1.3538 is possibly resuming. Further rise should be seen to retest 1.3923 first. For now, risk will stay on the upside as long as 1.3725 support holds, in case of retreat.
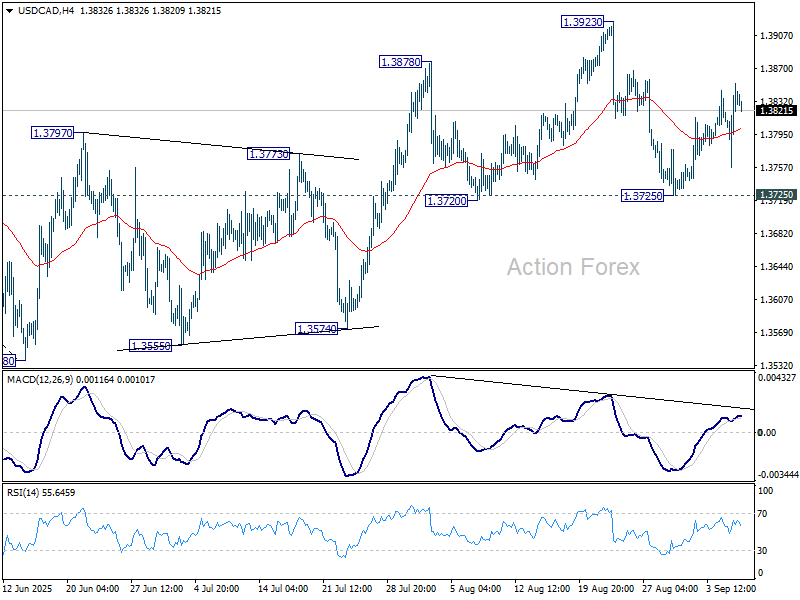
In the bigger picture, price actions from 1.4791 medium term top could either be a correction to rise from 1.2005 (2021 low), or trend reversal. In either case, further decline is expected as long as 1.4014 cluster resistance (38.2% retracement of 1.4791 to 1.3538 at 1.4017) holds. Next target is 61.8% retracement of 1.2005 (2021 low) to 1.4791 at 1.3069.
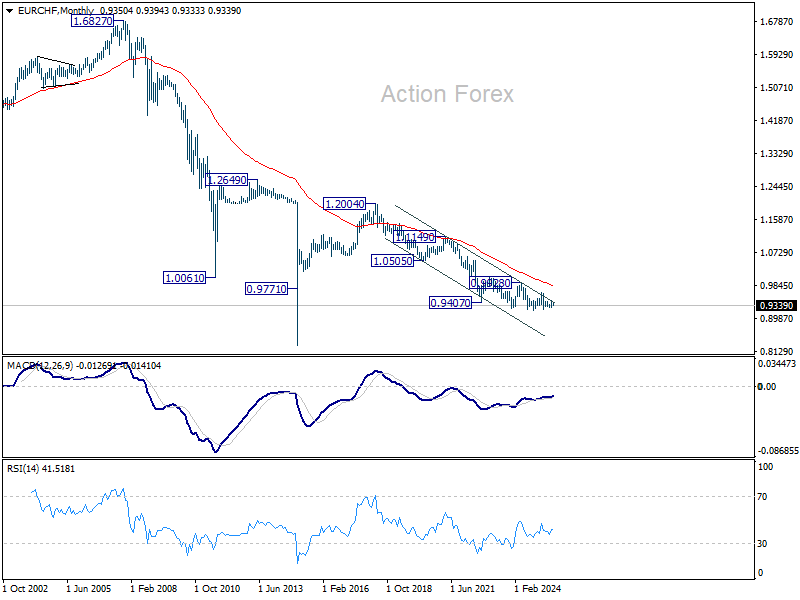
EUR/CHF Daily Outlook
Daily Pivots: (S1) 0.9334; (P) 0.9366; (R1) 0.9381; More....
Intraday bias in EUR/CHF remains on the downside for 0.9317 support. Overall outlook is unchanged that corrective pattern from 0.9218 might have completed with three waves up to 0.9452 already. Break of 0.9317 will solidify this bearish case and target 0.9265 support, and then 0.9204 low. For now, risk will stay on the downside as long as 0.9394 resistance holds, in case of recovery.
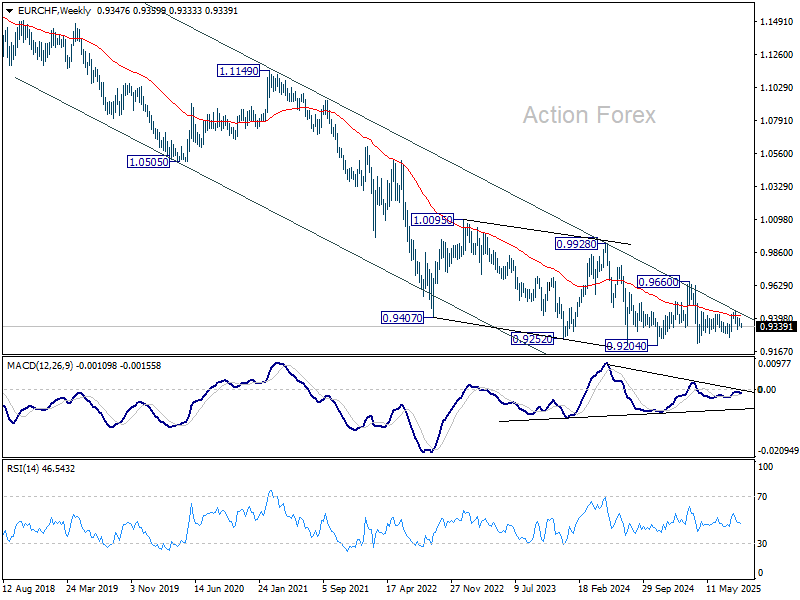
In the bigger picture, the down trend from 0.9204 (2018 high) might still be in progress considering that EUR/CHF is staying well inside the long term falling channel. However, with bullish convergence condition in W MACD, downside potential should be limited in case of another fall. Instead, firm break of 0.9660 resistance will be an important sign of medium term bullish trend reversal.