
Sample Category Title
EUR/GBP Daily Outlook
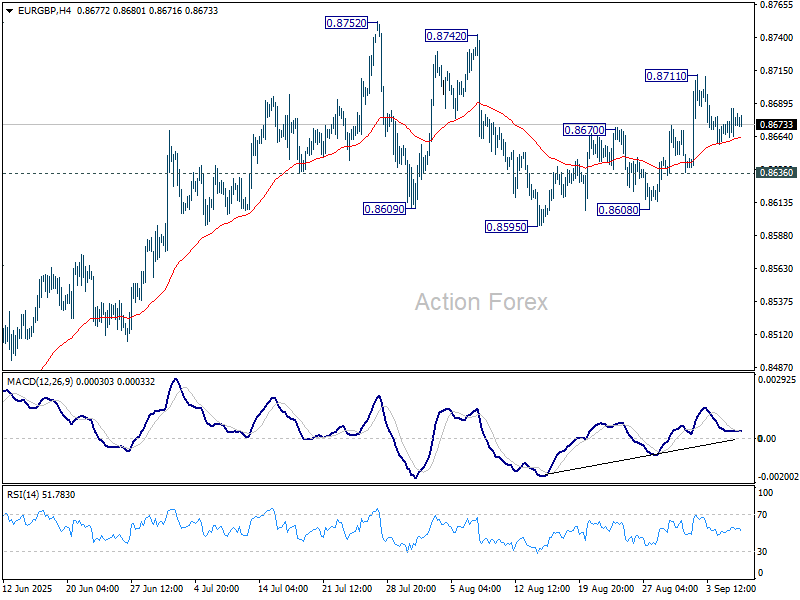
Daily Pivots: (S1) 0.8664; (P) 0.8675; (R1) 0.8686; More...
Intraday bias in EUR/GBP stays neutral and further rise is in favor with 0.8636 minor support intact. On the upside above 0.8711 will bring retest of 0.8752 high. However, break of 0.8636 will extend the pattern from 0.88752 with another falling leg, and target 0.8959 support.
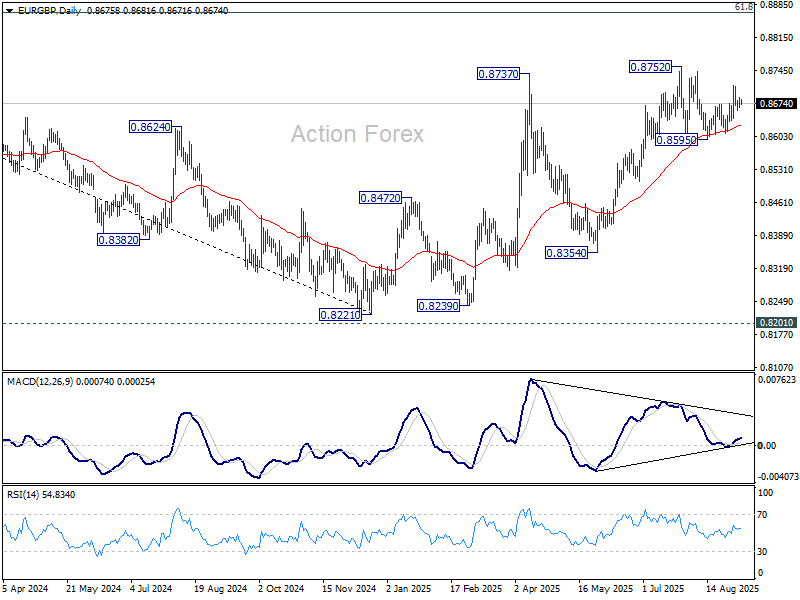
In the bigger picture, the structure from 0.8221 medium term bottom are not impulsive enough to suggest that it's reversing the down trend from 0.9267 (2022 high). But even if it's a correction, further rise could still be seen to 61.8% retracement of 0.9267 to 0.8221 at 0.8867. Nevertheless, sustained trading below 55 W EMA (now at 0.8519) will argue that the pattern has completed and bring retest of 0.8221 low.
EUR/AUD Daily Outlook
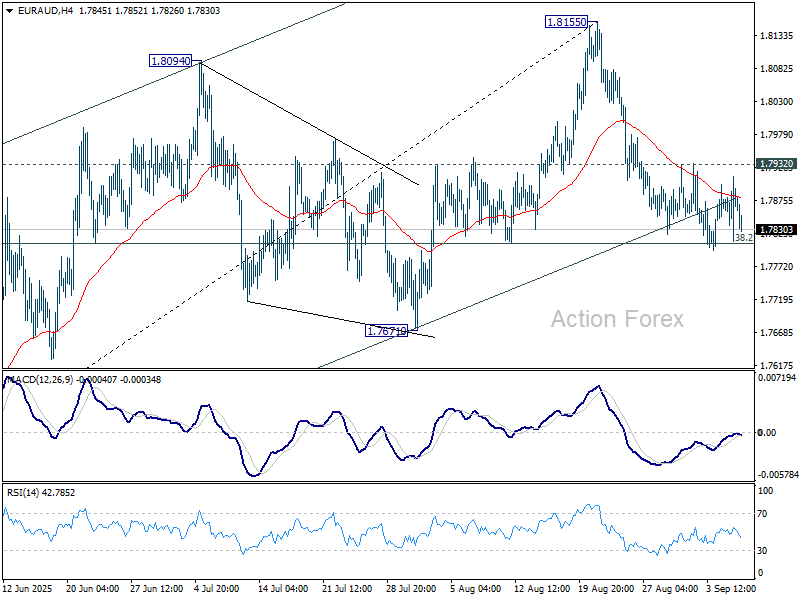
Daily Pivots: (S1) 1.7819; (P) 1.7866; (R1) 1.7919; More...
Intraday bias in EUR/AUD stays neutral and further decline is expected with 1.7932 resistance intact. On the downside, sustained trading below 38.2% retracement of 1.7245 to 1.8155 at 1.7807 should confirm that whole rise from 1.7245 has completed at 1.8155. Corrective pattern from 1.8554 should then be in its third leg. Further decline should be seen to 61.8% retracement at 1.7593. On the upside, break of 1.7932 resistance will retain near term bullishness and bring retest of 1.8155 resistance instead.
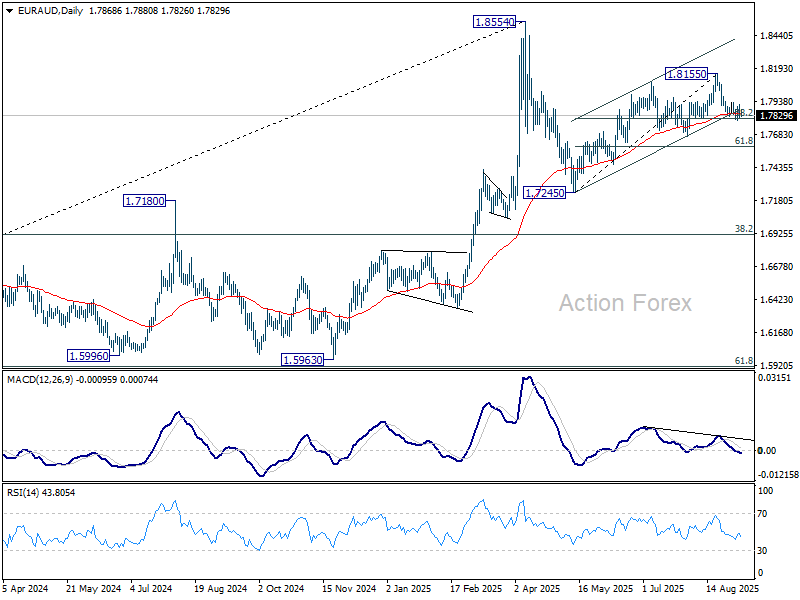
In the bigger picture, price actions from 1.8554 medium term top are seen as a corrective pattern. Such pattern could extend further with another falling leg. But even in that case, downside should be contained by 38.2% retracement of 1.4281 (2022 low) to 1.8554 at 1.6922 to bring rebound. Uptrend from 1.4281 is expected to resume at a later stage.
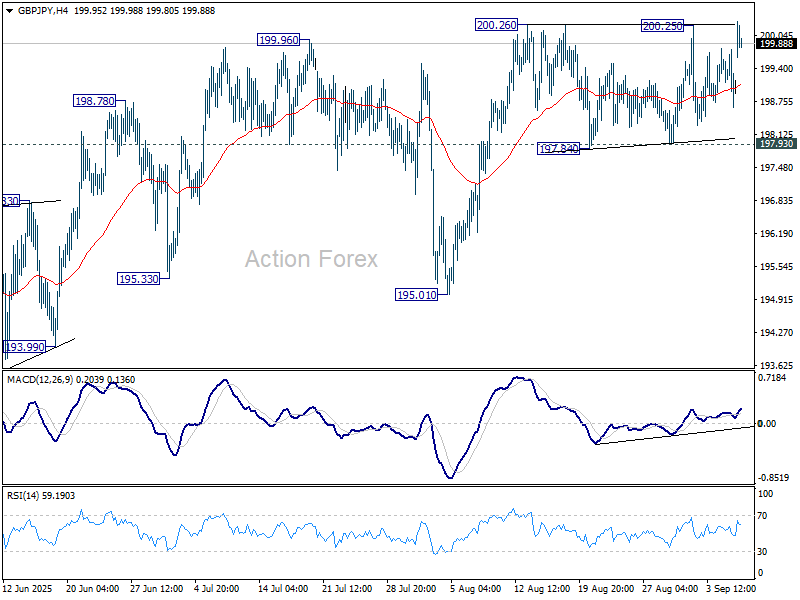
GBP/JPY Daily Outlook
Daily Pivots: (S1) 198.60; (P) 199.20; (R1) 199.73; More...
Intraday bias in GBP/JPY remains neutral at this point. Further rise is expected as long as 197.93 support holds. Firm break of 200.26 resistance will resume the rally from 184.35 to 100% projection of 180.00 to 199.79 from 184.35 at 204.14. On the downside, however, break of 197.93 support will turn bias to the downside for 195.01 support next.
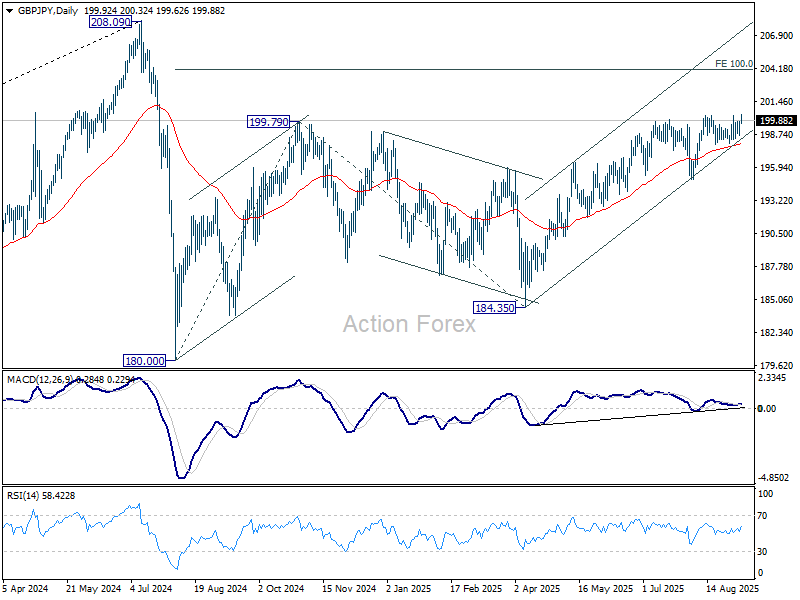
In the bigger picture, price actions from 208.09 (2024 high) are seen as a correction to rally from 123.94 (2020 low). The pattern might still extend with another falling leg. But in that case, strong support should be seen from 38.2% retracement of 123.94 to 208.09 at 175.94 to contain downside. Meanwhile, decisive break of 208.09 will confirm long term up trend resumption.
More Rate Cuts, More OPEC Barrels, More Political Uncertainty
22,000. That’s how many jobs the US economy added last month. A meagre 22K new nonfarm jobs – far weaker than analysts expected. Prior months’ revisions even showed the US economy lost jobs in June. The unemployment rate climbed to 4.3% as anticipated, while the participation rate ticked slightly higher – but not enough to improve the outlook. On the contrary, the US labour market is expected to deteriorate further amid mass deportations, restrained immigration and tariff-related uncertainty. Manufacturing shed another 12K jobs in July, suggesting the bleeding may continue before production and employment eventually shift back to the US – though many of those factory-floor jobs will likely be replaced by robots.
For now, the weakening jobs picture fuels expectations that the Federal Reserve (Fed) will not only cut rates in September but may have to cut more aggressively to shore up the labour market and compensate for what many see as a delayed response. To me – and many others – the Fed’s wait-and-see stance on inflation amid tariff disruptions made sense, as it was hard to paint a rosy picture for the US economy in such conditions. But if inflation doesn’t pick up – which is highly surprising – then yes, they’ll have to lower rates to avoid political and public backlash.
The US 2-year yield briefly slipped below 3.50% and is consolidating just above that level. The probability of rate cut in September surged to 100%, while Fed funds futures now price about a 10% chance of a 50bp move. Many now think the Fed could cut at all three remaining meetings this year and might even pause balance sheet tightening, depending on how quickly the labour market deteriorates and whether inflation ticks up – or doesn’t.
This week, we’ll shed some light on inflation dynamics. Last month, US CPI showed little consumer price pressure, while producer prices jumped – suggesting tariff costs were mostly absorbed by companies. We’ll see if some of those input costs are now passed on to consumers. On Wednesday, PPI is expected to show easing pressure in August. But on Thursday, CPI could warn that tariffs are starting to show up in headline inflation. A softer-than-expected print could temper Fed dovishness – but rate cuts are coming and risk assets will continue to enjoy the scent of cheaper money.
The S&P 500 hit a fresh record high after the payrolls data. The index closed Friday slightly lower, though more S&P 500 constituents ended the day in positive territory. The limited appetite could be blamed on Nvidia, which fell 2.7% after news that OpenAI will start mass producing AI chips with Broadcom. Capital rotated into Broadcom, which surged as much as 15% before paring gains to close up more than 9%.
In Asia, dovish Fed expectations boosted sentiment. The Nikkei jumped at the open, and European and US futures point to a positive start to the week. Chinese investors, however, were cautious on weakening exports and a smaller-than-expected August trade surplus.
Inside Japan: Prime Minister Shigeru Ishiba resigned over the weekend under mounting LDP pressure to step down. The news pushed the USDJPY lower at the open, on expectations that his successor will pursue looser fiscal policy and that political instability could delay a Bank of Japan (BoJ) hike. But the dark side is rising fiscal concerns: 20- and 30-year JGB yields reversed their recent decline and climbed higher on prospects of looser fiscal discipline.
Rising long-term yields are a quietly building risk for global risk appetite. In the US, the 30-year Treasury yield dropped below 4.80% after the weak jobs data, though risks remain.
Speaking of risks, French PM François Bayrou faces a make-or-break no-confidence vote today. His government is likely to collapse under opposition pressure, which could weigh on French stocks and bonds and cap euro gains into 1.18. Still, the dollar’s trajectory will ultimately decide whether the EURUSD deserves to reach 1.20. Net speculative positioning in the euro is strongly positive, meaning any adverse news could trigger a sharp correction.
In energy, US crude opened the week with a rebound after testing $62 per barrel support on Friday, just ahead of the OPEC meeting. OPEC announced supply increases of 137K barrels/day from October – which was below the previous moves, below expectations and flexible. That prompted some oil bears to take profit after last week’s 3.5% slide. Prices could correct further into the $65–66 range, which includes a key Fibonacci level as well as the 50- and 200-day moving averages. A breakout above would likely require fresh geopolitical tension.
US Job Growth Stalled in August
In focus today
In the euro area, focus turns to the no-confidence vote on French prime minister Bayrou. Bayrou and his government are expected to fall with both the far right and the left-wing parties vowing to vote against his minority administration. President Macron can then choose a new premier or call for a snap election. Macron has expressed a preference to avoid snap elections, with hints of forming a centrist government potentially led by a Socialist prime minister. However, the outlook for a new government remains highly uncertain. We expect political uncertainty in France to persist and view significant near-term improvements in public finances as unlikely.
We also receive the Sentix investor confidence indicator for September.
For the remainder of the week, the key focus is the US CPI release on Thursday, alongside the ECB meeting. Ahead of this, markets will watch the BLS preliminary annual benchmark NFP revision on Tuesday, followed by inflation data from China and Norway as well as US PPI on Wednesday. The week wraps up with the US Michigan survey on Friday.
Economic and market news
What happened overnight
In China, export growth slowed to 4.4% y/y in August (prior: 7.2%), the weakest pace since February and below expectations. While exports have outperformed in recent months, supported by stronger exports to Asia offsetting weaker shipments to the US, the latest data highlights emerging pressures. Import growth, though slightly improved in recent months, remains subdued, reflecting weak domestic demand. Imports rose 1.3% y/y (prior:4.1%), also missing forecasts. Read more in Research China - Domestic economy struggles while exports power ahead, 8 September.
What happened since Friday
In the US, the August jobs report came in very weak, with employment rising by 22k (cons: 75k). Revisions of previous months reveals 21k fewer jobs created. Manufacturing jobs declined further, with 38k fewer than prior to Trump's presidency. Unemployment increased to 4.3% from 4.2%, partly driven by a growing labour force. The data confirms the signs of a cooling labour market, though broader economic indicators remain stable. Read more in Research US - Tariff impact set to intensify towards winter, 5 September. The weak report strengthens the case for a rate cut in September, with inflation data and payroll revisions this week unlikely to change the outlook. Markets reacted by sending yields lower and weakening the dollar.
In the euro area, wage growth, measured as compensation per employee by the ECB, declined to 3.9% y/y in the second quarter of 2025 from 4.0% y/y in Q1. The data follows the higher-than-expected negotiated wage data and is markedly above the ECB's latest staff projection of 3.4% wage growth in Q2. Persistently elevated wage growth means services price pressures are likely to decline less slowly, which on the margin is hawkish.
In China, tensions with the EU escalated further as China on Friday announced anti-dumping tariffs on EU pork imports ranging from 15.6-62.4%. Although labelled as preliminary, the tariffs are likely to remain if the EU maintains higher tariffs on Chinese EVs. Although the overall economic impact on the EU is limited, the move will hurt EU pork exporters, as China accounts for half of their export market.
In Japan, after less than a year in the seat, PM Ishiba decided to step down yesterday ahead of a vote among party parliamentarians which would have likely forced him out. Ishiba's term has seen headwinds from the start, after a bold move to call a snap election after his election as Liberal Democratic Party (LDP) president backfired. Among candidates for the LDP-leadership are the fiercest competition from last year's elections. Sanae Takaichi, last year's runner-up and an Abenomics-loyalist, has previously been critical of BoJ hiking rates and will likely stand for a looser fiscal policy stance, but many other candidates will likely appear ahead of the election likely taking place in early October. The LDP is currently running an unusual minority government, and thus the new president will not necessarily become the new PM and might call for another snap election. Markets reacted by trading USD/JPY back above 148 levels and investors have increasingly retraced their bets on an October hike from the BoJ amid the political uncertainty.
In the commodity space, OPEC+ announced on Sunday a further oil production increase of 137,000 barrels per day from October. The move is driven by Saudi Arabia's push to regain market share. Although the increase is smaller than recent monthly hikes, it signals a shift towards prioritising market share over prices, amid expectations of weakening global demand in the months ahead.
Equities: Equities were mostly lower on Friday, but not as much as one might think after such a weak US job report. It was a tug of war between growth fears on one side, but lower bond yields on the other, leaving most main indexes only modestly lower but after rallying shortly upon the release. Stoxx 600 closed down -0.1%, S&P 500 -0.3% but Nasdaq was unchanged and interest rate sensitive small cap Russell 2000 even closed 0.5% higher. Sector performance painted a similar picture; yield sensitive real estate and high multiple stocks outperformed while growth sensitive value cyclicals like banks and industrials sold off. Similarly, falling yields and weakening growth tend to favour US equities over Europe. This was the case last week as well, marking another week of underperformance for Europe (-0.5pp). US and European futures are modestly higher this morning.
FI and FX: Friday's session was naturally dominated by the US NFP market reaction with the USD FX selling off and US FI rallying. EUR/USD initially traded as high as 1.1760 before erasing part of the gains now trading at around 1.1710 this morning. Overnight oil prices have traded higher, Brent crude hitting 66 USD/bbl, despite OPEC+ announcements on higher supplies. EUR/NOK trades around 11.75 while EUR/SEK is testing the 11.00 threshold which technically will be important for the near-term direction.
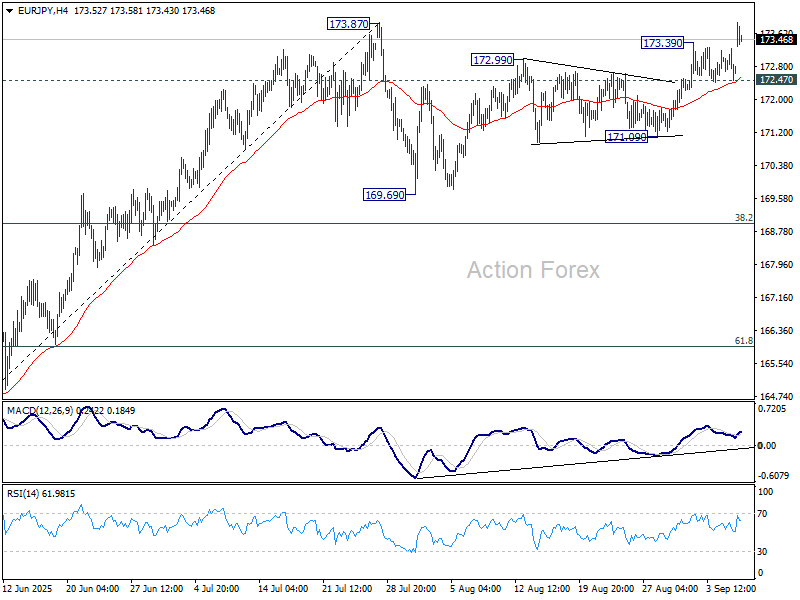
EUR/JPY Daily Outlook
Daily Pivots: (S1) 172.39; (P) 172.83; (R1) 173.17; More...
EUR/JPY's rally resumed after brief consolidations and intraday bias is back on the upside. Firm break of 173.87 will resume larger rise to retest 175.41 key resistance. On the downside, though, break of 172.47 support will extend the corrective pattern from 173.87 with another falling leg, before rally resumption.
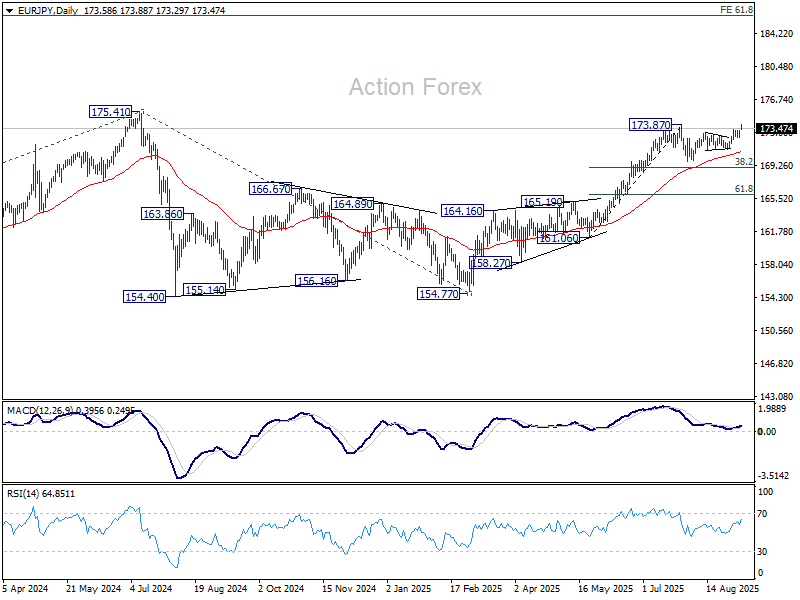
In the bigger picture, current rally from 154.77 is still tentatively seen as resuming the larger up trend. Firm break of 175.41 (2024 high) will confirm and target 61.8% projection of 124.37 to 175.41 from 154.77 at 186.31. However, sustained break of 38.2% retracement of 161.06 to 173.87 at 168.97 will delay this bullish case, and probably extend the correction from 175.41 with another fall.
Yen Under Siege, Dollar Mixed Awaits CPI, Euro Steady Before ECB
A political shock in Tokyo is dominating global markets today, with Prime Minister Shigeru Ishiba announcing to step down over the weekend. The surprise resignation boosted risk appetite, propelling Nikkei. Yen, meanwhile, looks increasingly vulnerable. Last week’s dip in U.S. Treasury yields provided only temporary relief, and the currency has quickly reversed lower today. If optimism surrounding Japan’s leadership transition holds and the Nikkei breaks into record territory, Yen’s selloff could extend further in the days ahead.
For Dollar, the picture is mixed after last week’s sharp post-NFP selloff. Markets are now shifting attention to upcoming U.S. CPI and PPI reports, which will be critical in gauging the impact of August’s tariff escalation. After another weak jobs print, the inflation data will be crucial in determining whether the Fed has the flexibility to accelerate easing to support employment.
Euro trading has turned cautious as investors look toward Thursday’s ECB meeting, where policymakers are widely expected to leave the deposit rate unchanged at 2.00%. With inflation near target and unemployment still low, the ECB is seen maintaining its wait-and-see stance after delivering 200bps of cuts over the past year.
Across broader FX markets, the commodity bloc is outperforming, with Kiwi leading gains, followed by Aussie and Loonie. At the other end of the spectrum, Yen is the weakest, trailed by Sterling and Euro. Dollar and Swiss Franc are sitting in the middle of the pack.
In Asia, at the time of writing, Nikkei is up 1.42%. Hong Kong HSI is up 0.53%. China Shanghai SSE is up 0.21%. Singapore Strait Times is down -0.01%. Japan 10-year JGB yield is down -0.006 at 1.570.
Japanese stocks soar towards record as Ishiba exit sparks optimism, NZD/JPY breaks higher
Japanese equities surged at the start of the week, with the Nikkei jumping more than 800 points in early trade and holding firm through the morning session. The index now sits within striking distance of a fresh record high. Risk-on appetite spilled over into currency markets, sending Yen sharply lower and leaving it vulnerable to further pressure if sentiment holds.
The trigger was the surprise resignation of Prime Minister Shigeru Ishiba over the weekend. Ishiba said the timing was deliberate, coming days after he secured the formal reduction of U.S. auto tariffs from 27.5% to 15%. “Now that negotiations on U.S. tariff measures have reached a conclusion, I believe this is the appropriate moment to resign,” he told reporters. His departure marks a sudden end to a premiership that began less than a year ago but was hampered by his coalition losing control of the lower house.
Nevertheless, Ishiba's exit opens the door to fresh leadership amid hopes that new faces could re-energize both the party and the electorate. Koizumi Shinjiro, agricultural minister and son of former prime minister Junichiro Koizumi, is widely viewed as a frontrunner, with his youth and broad appeal resonating with markets. Takaichi Sanae, closely aligned with the late Abe Shinzo, is also expected to be a serious contender. The leadership race is expected to fuel speculation of policy continuity combined with a push for fresh fiscal initiatives.
Investors are betting that the incoming administration will prioritize expansionary fiscal measures to secure opposition cooperation, given the LDP-led coalition still commands only a minority. Such expectations have buoyed equities further and reinforced the risk-on backdrop weighing on Yen.
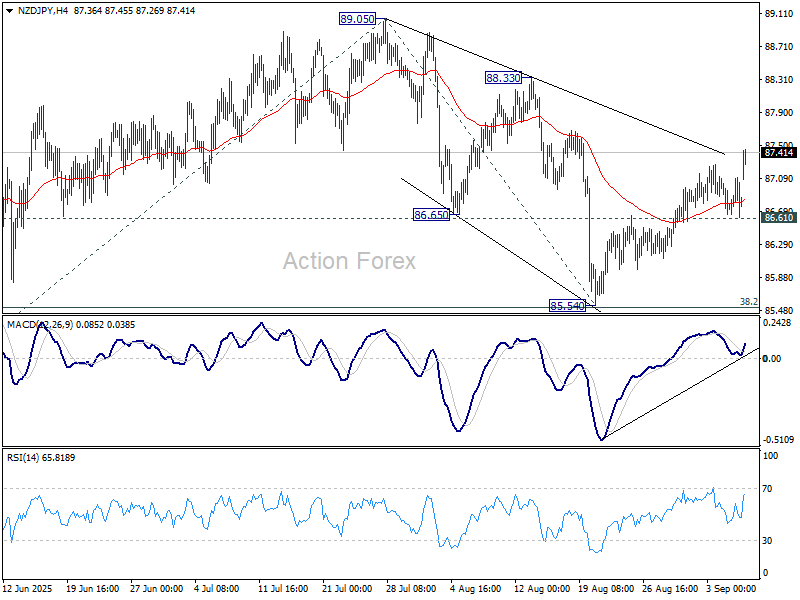
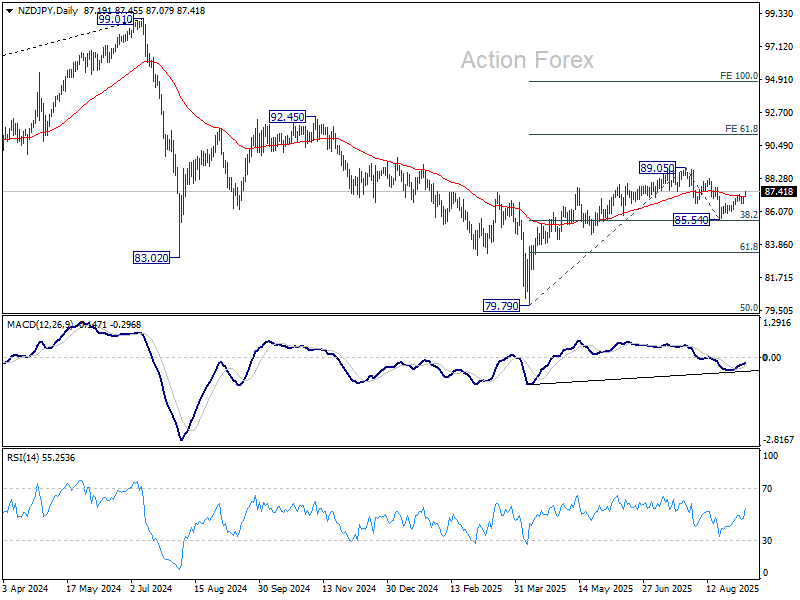
Technically, NZD/JPY's rally from 85.54 resumed today. The break of 55 D EMA (now at 87.10) suggests that correction from 89.05 has completed after defending 38.2% retracement of 38.2% retracement of 79.79 to 89.05 at 85.51. Further rise is expected as long as 86.61 support holds. Break of 88.33 resistance will indicate that whole up trend from 79.79 is ready to resume through 89.05 short term top.
China exports growth slows in August, US flows collapse -33% yoy
China’s trade report for August showed growing pressure from U.S. tariffs. Exports rose 4.4% yoy, below expectations of 5.0% yoy and the slowest pace in six months. Shipments to the U.S. plunged -33.1% yoy, while flows to Southeast Asia jumped 22.5% yoy, suggesting exporters may be rerouting goods through regional partners to cushion losses.
Imports also disappointed, rising just 1.3% yoy versus forecasts of 4.1% yoy. Imports from the U.S. dropped -16% yoy, reflecting both weaker domestic demand and the bite of tariffs. Still, the overall trade surplus widened from USD 98.2B to USD 102.3 B, beating expectations of USD 99.4B.
While the surplus provides headline support, the underlying dynamics are fragile. U.S. President Donald Trump has already threatened a 40% penalty tariff on goods deemed to be transshipped from China, raising questions about how long exporters can sustain the ASEAN workaround. Besides, economists warn that once U.S. tariffs rise above 35%, they become prohibitively high for many Chinese manufacturers.
Washington and Beijing extended their tariff truce by 90 days on August 11, locking in 30% U.S. duties on Chinese goods and 10% Chinese tariffs on U.S. exports. But with no path yet beyond the pause, uncertainty lingers over whether China can maintain export growth as tariff pressure intensifies.
SNB Schlegel: Hurdle to reintroducing negative rates remains high
SNB President Martin Schlegel said the bar for reintroducing negative rates remains “high,” acknowledging the policy’s “undesirable side effects” for savers and pension funds. His comments reinforced market expectations that the SNB will hold its policy rate steady well into 2026, with inflation staying positive for a third month in August.
Switzerland faces new headwinds from U.S. tariffs of 39%, which threaten its export-heavy economy and raise risks of further disinflation. Schlegel cautioned that while some firms will be hit hard, the overall economic impact is not yet clear. “Many companies are investing less, which is having a negative impact on the economy,” he told Migros-Magazin.
ECB to Lean Back; Fed Awaits US CPI
The ECB is widely expected to keep its deposit rate unchanged at 2.00% this week, marking its second consecutive hold. After cutting by 200bps between June 2024 and June 2025, markets are increasingly convinced the easing cycle is over. With inflation at target and unemployment still at record lows, policymakers see little urgency to move further.
This backdrop has been described as a soft landing: inflation near 2% and a labor market that remains resilient. In such an environment, the ECB can afford to step back, assess the impact of past cuts, and wait for clearer signs before shifting again. The balance of risks no longer tilts toward urgent easing, and consensus is building that rates could stay at current levels well into 2026.
Survey data backs up this outlook. A Reuters poll showed nearly 60% of economists expect the ECB to hold through 2025, while a narrow majority predict the deposit rate will still be at or above 2% by end-2026. For now, expectations of a long pause are keeping the euro broadly supported.
In contrast, the Fed faces mounting pressure to resume easing after two consecutive weak non-farm payrolls. Markets still lean toward a 25bps cut in September, but the risk of a 50bps move is rising as the Trump administration intensifies political pressure on the FOMC. Even if the Fed opts for caution this month, markets see a strong chance of back-to-back easing with another cut in October.
The week’s major focus in the U.S. will be on August CPI and PPI releases, which should reflect the early impact of tariff escalation. Consensus sees headline CPI rising from 2.7% to 2.9% yoy, while core CPI is expected to hold at 3.1% yoy. Any upside surprise would deepen the Fed’s dilemma: inflation edging higher while growth signals weaken.
For Fed hawks, a downside surprise in core CPI would provide the opening to pivot toward deeper or faster cuts. But expectations remain fluid, and market reaction is set to remain volatile. Dollar moves will likely mirror each CPI headline as traders recalibrate the odds of 25bps versus 50bps in September.
Beyond the Fed and ECB, investors will watch UK GDP for clues on fiscal drag, Eurozone investor confidence for signals on growth resilience, and sentiment data out of Australia, where the RBA has recently leaned less dovish. Together, these releases could set the tone for risk sentiment and FX positioning into mid-September.
Here are some highlights for the week:
- Monday: Japan GDP final; China trade balance; Germany industrial production, trade balance; Eurozone Sentix investor confidence.
- Tuesday: New Zealand manufacturing sales; Australia Westpac consumer sentiment, NAB business confidence; France industrial production.
- Wednesday: China CPI, PPI; US PPI.
- Thursday: Japan BIS manufacturing, PPI; ECB rate decision; US CPI, jobless claims.
- Friday: New Zealand BNZ manufacturing; Germany CPI final; UK GDP, trade balance; US UoM consumer sentiment and inflation expectations.
EUR/JPY Daily Outlook
Daily Pivots: (S1) 172.39; (P) 172.83; (R1) 173.17; More...
EUR/JPY's rally resumed after brief consolidations and intraday bias is back on the upside. Firm break of 173.87 will resume larger rise to retest 175.41 key resistance. On the downside, though, break of 172.47 support will extend the corrective pattern from 173.87 with another falling leg, before rally resumption.
In the bigger picture, current rally from 154.77 is still tentatively seen as resuming the larger up trend. Firm break of 175.41 (2024 high) will confirm and target 61.8% projection of 124.37 to 175.41 from 154.77 at 186.31. However, sustained break of 38.2% retracement of 161.06 to 173.87 at 168.97 will delay this bullish case, and probably extend the correction from 175.41 with another fall.
China exports growth slows in August, US flows collapse -33% yoy
China’s trade report for August showed growing pressure from U.S. tariffs. Exports rose 4.4% yoy, below expectations of 5.0% yoy and the slowest pace in six months. Shipments to the U.S. plunged -33.1% yoy, while flows to Southeast Asia jumped 22.5% yoy, suggesting exporters may be rerouting goods through regional partners to cushion losses.
Imports also disappointed, rising just 1.3% yoy versus forecasts of 4.1% yoy. Imports from the U.S. dropped -16% yoy, reflecting both weaker domestic demand and the bite of tariffs. Still, the overall trade surplus widened from USD 98.2B to USD 102.3 B, beating expectations of USD 99.4B.
While the surplus provides headline support, the underlying dynamics are fragile. U.S. President Donald Trump has already threatened a 40% penalty tariff on goods deemed to be transshipped from China, raising questions about how long exporters can sustain the ASEAN workaround. Besides, economists warn that once U.S. tariffs rise above 35%, they become prohibitively high for many Chinese manufacturers.
Washington and Beijing extended their tariff truce by 90 days on August 11, locking in 30% U.S. duties on Chinese goods and 10% Chinese tariffs on U.S. exports. But with no path yet beyond the pause, uncertainty lingers over whether China can maintain export growth as tariff pressure intensifies.
Japanese stocks soar towards record as Ishiba exit sparks optimism, NZD/JPY breaks higher
Japanese equities surged at the start of the week, with the Nikkei jumping more than 800 points in early trade and holding firm through the morning session. The index now sits within striking distance of a fresh record high. Risk-on appetite spilled over into currency markets, sending Yen sharply lower and leaving it vulnerable to further pressure if sentiment holds.
The trigger was the surprise resignation of Prime Minister Shigeru Ishiba over the weekend. Ishiba said the timing was deliberate, coming days after he secured the formal reduction of U.S. auto tariffs from 27.5% to 15%. “Now that negotiations on U.S. tariff measures have reached a conclusion, I believe this is the appropriate moment to resign,” he told reporters. His departure marks a sudden end to a premiership that began less than a year ago but was hampered by his coalition losing control of the lower house.
Nevertheless, Ishiba's exit opens the door to fresh leadership amid hopes that new faces could re-energize both the party and the electorate. Koizumi Shinjiro, agricultural minister and son of former prime minister Junichiro Koizumi, is widely viewed as a frontrunner, with his youth and broad appeal resonating with markets. Takaichi Sanae, closely aligned with the late Abe Shinzo, is also expected to be a serious contender. The leadership race is expected to fuel speculation of policy continuity combined with a push for fresh fiscal initiatives.
Investors are betting that the incoming administration will prioritize expansionary fiscal measures to secure opposition cooperation, given the LDP-led coalition still commands only a minority. Such expectations have buoyed equities further and reinforced the risk-on backdrop weighing on Yen.
Technically, NZD/JPY's rally from 85.54 resumed today. The break of 55 D EMA (now at 87.10) suggests that correction from 89.05 has completed after defending 38.2% retracement of 38.2% retracement of 79.79 to 89.05 at 85.51.
Further rise is expected as long as 86.61 support holds. Break of 88.33 resistance will indicate that whole up trend from 79.79 is ready to resume through 89.05 short term top.
SNB Schlegel: Hurdle to reintroducing negative rates remains high
SNB President Martin Schlegel said the bar for reintroducing negative rates remains “high,” acknowledging the policy’s "undesirable side effects" for savers and pension funds. His comments reinforced market expectations that the SNB will hold its policy rate steady well into 2026, with inflation staying positive for a third month in August.
Switzerland faces new headwinds from U.S. tariffs of 39%, which threaten its export-heavy economy and raise risks of further disinflation. Schlegel cautioned that while some firms will be hit hard, the overall economic impact is not yet clear. “Many companies are investing less, which is having a negative impact on the economy," he told Migros-Magazin.