Sample Category Title
US Non-Farm Payrolls Finally Release and They Miss! 22K vs 75K Consensus, Canadian Jobs Data Regress
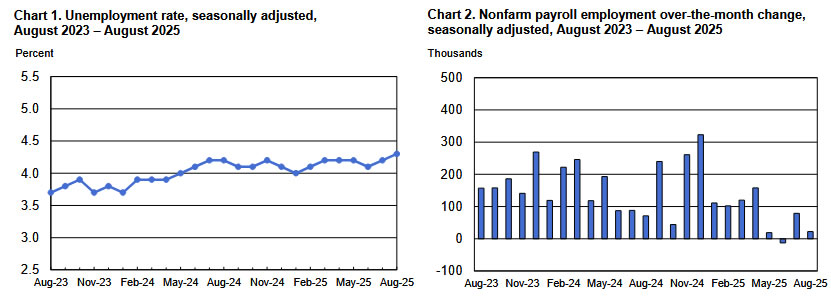
The monthly release for US August jobs is at 22K vs 75K Expectations – Job growth is almost flat in the past 4 months!
The prior month came at 74K vs 110K expectations, but the biggest surprise was to the downside revisions which turned a 291K increase in two months to an-only 33K increase.
With the unemployment rate rising to 4.3%, there really is a decent slowdown happening in the US.
EDIT: As things are unfolding, the Market is pricing a 100% chance of a cut on September 17 and starting to price chances of a 50 bps (currently around 14%).
July Jobs revised at 79K (vs 74K) and June months actually at -12K vs 14K on the second revisions.
Canadian jobs also regressed quite largely at -65K vs 10K expectations, sending the Loonie down vs other majors.
The US Dollar is falling off, about to break support, equities are rallying but mixed : a more than 25 bps is starting to price but still has low probabilities of happening.
The data still shows an increase, albeit a very small one.
Check out the reactions to the US Dollar, a few FX Charts and Equities Futures.
Market reactions
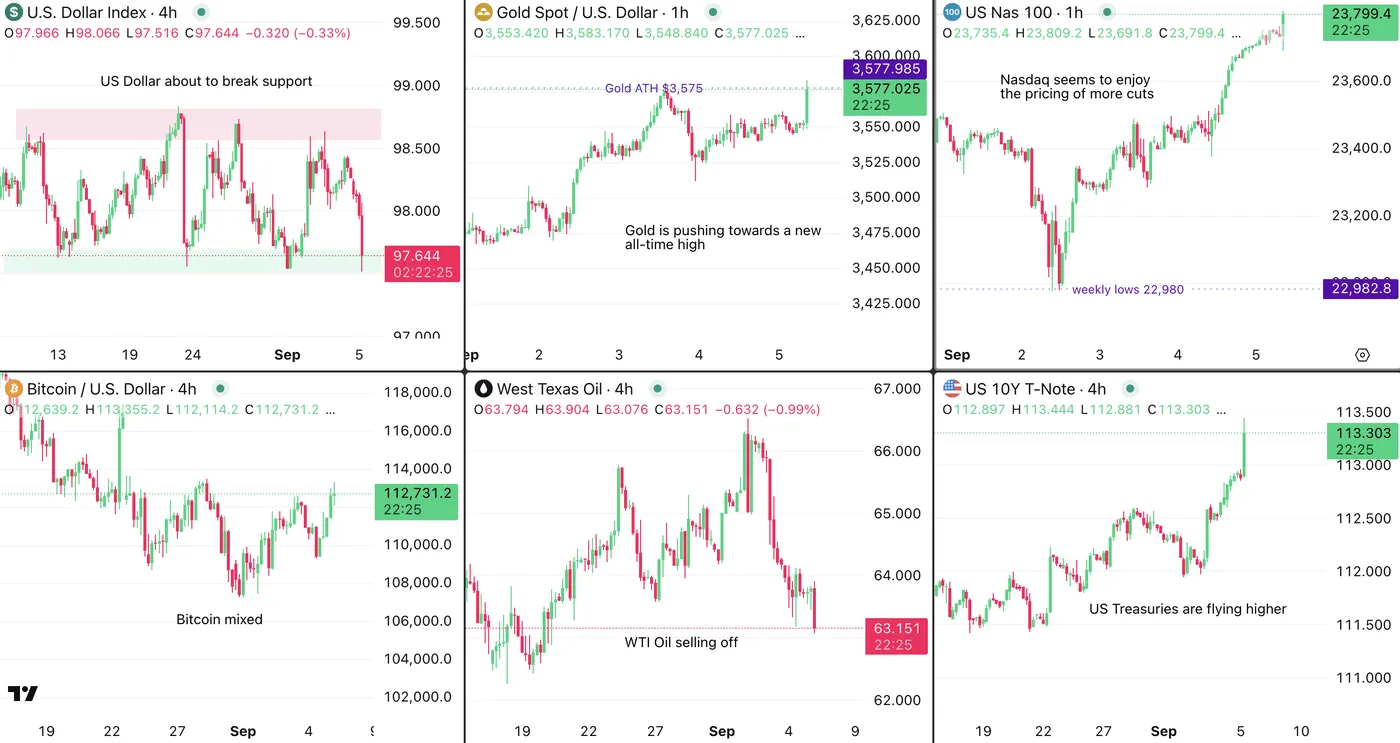
Market overview, September 5, 2025 – Source: TradingView
It will be essential to log in after the Market open to see reactions when most volumes enter the market.
For now, it's USD and CAD down, risk-assets up but mixed, US Treasuries and Gold flying higher.
Current FX Picture after NFP
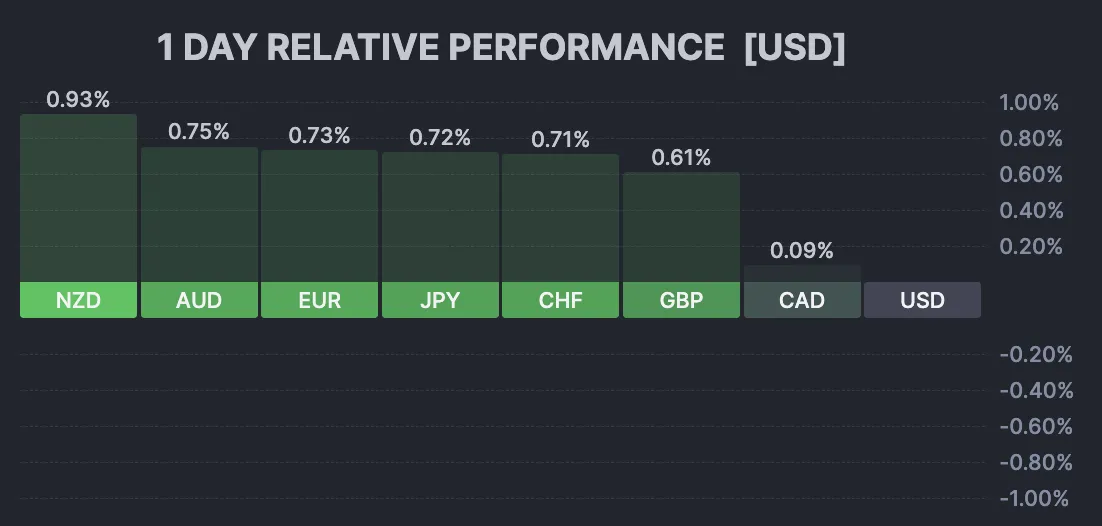
FX currency performance, September 5, 2025 – Source: Finviz
Look at the current pricing for FOMC Cuts for the rest of the year:
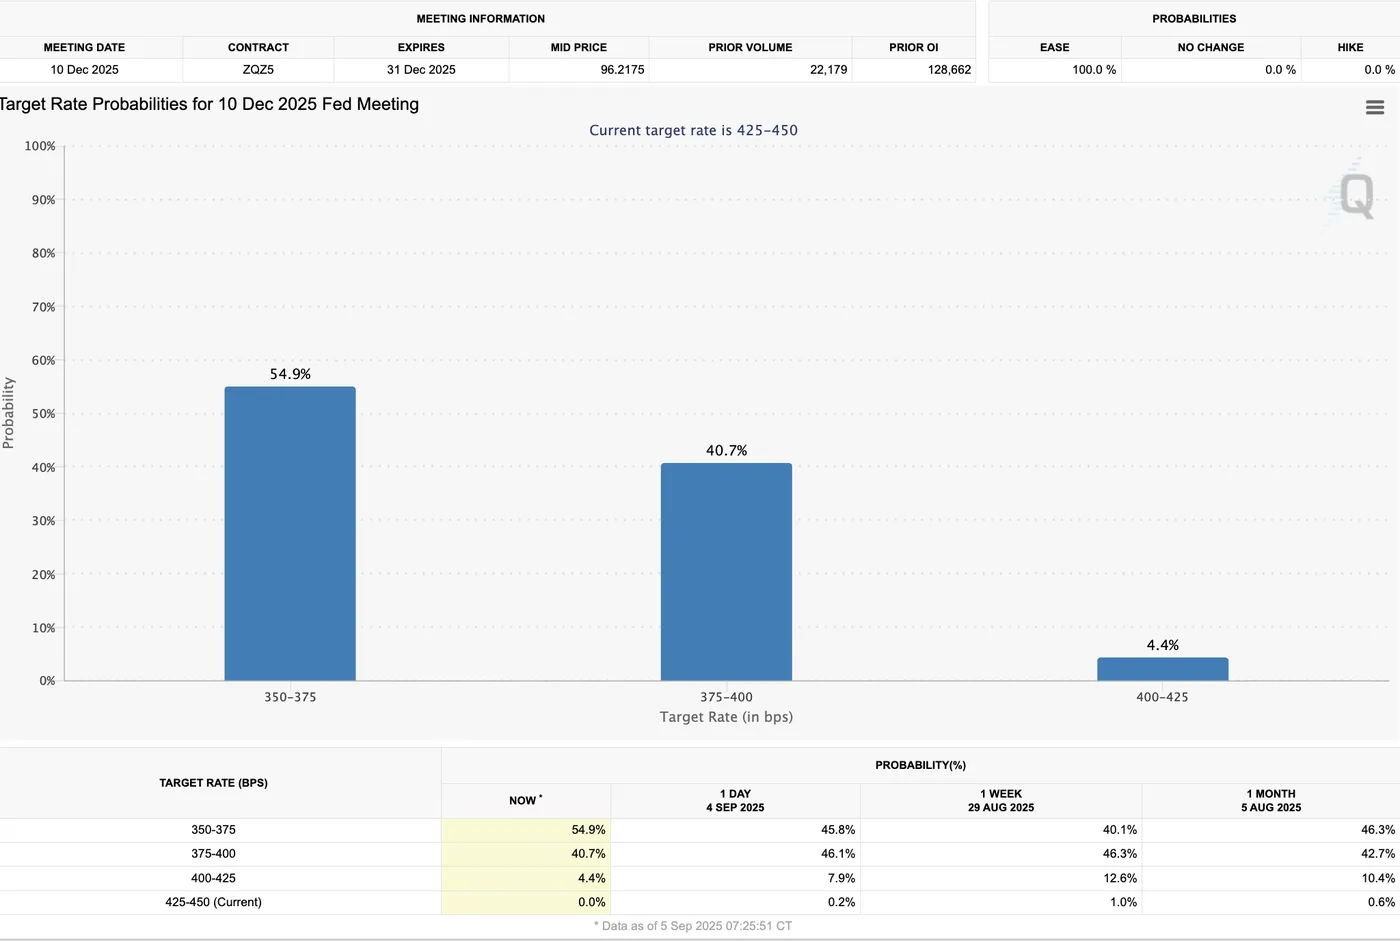
Cut Pricing for the rest of the year – Source: FEDWatch Tool
Markets just added about 17 bps of extra cut pricing to the rest of the year, which takes the 2.1 cuts to just about 3 cuts.
Let's see how this progresses and what influence it will have on Markets.
Safe Trades!
US: Labor Market Shows Further Signs of Weakness in August
Non-farm employment increased by 22k in August, short of Bloomberg's consensus forecast of 75k, but nearly right on top of our forecast.
- Job gains for the prior two months were revised lower by a total of 21k.
- Over the past three months, non-farm payrolls averaged 29k jobs, well below the twelve-month average of 122k.
Private payrolls rose 38k – down from 77k reported in July – with most of the gains concentrated in health care & social assistance (+46.8k), leisure & hospitality (+28k) and retail trade (+10.5k). Meanwhile, goods producing industries (-25k), professional & business services (-17k) and government (-16k) all shed jobs on the month. The manufacturing sector has now released 42K workers since May, in a four-month string of steady monthly job losses.
In the household survey, the labor force (+436k) shot higher – following declines in each of the prior three months – eclipsing a smaller gain in civilian employment (+288k) and pushing the unemployment rate up to a new cyclical high of 4.3%. The labor force participation rate ticked up to 62.3% (from 62.2%).
Average hourly earnings (AHE) rose 0.3% month-on-month (m/m) – matching July's gain. On a twelve-month basis, AHE were up 3.7% (from 3.9% in June).
Key Implications
There's no escaping that the labor market is softening, and quickly. Once again, there was a low response rate in the August survey, at less than 60%. This suggests we could see further downward revisions in next month's release when the response rate typically returns to 90% or more. Further signs of weakness were also evident in the household survey, where measures of unemployment and underemployment each reached new cyclical highs of 4.3% and 8.1%, respectively.
Fed officials have become increasingly concerned about the downside risks to the labor market, and this morning's report will not assuage those fears. We maintained an out-of-consensus view since April that the Federal Reserve would need to deliver 75 basis points in rate-relief this year, and our conviction remains high that it will occur. Markets are increasingly moving to that view. As for that first step, Fed futures are fully priced for a September rate cut.
Canada’s Economy Sheds Jobs for the Second Straight Month in August, Unemployment Rate Hits New Cycle High
Canada's economy lost 66k jobs (-0.3% m/m) in August, adding to 41k jobs lost in July. The job losses concentrated in part-time positions (-60k), while full-time employment was little changed.
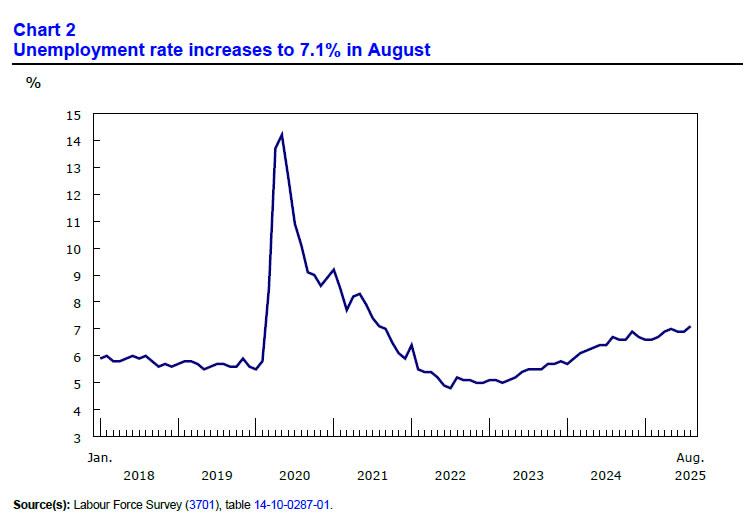
The unemployment rate rose to a new cycle high of 7.1%. The increase would have been worse were it not for 31k fewer workers in the labour force.
Job losses were seen across several industries. The biggest losses were in professional, scientific and technical services (-26k; -1.3%), transportation and warehousing (-23k; -2.1%), and manufacturing (-19k; -1.0%). However, construction employment bounced back (+17k; +1.1%) from July's decline (-22k; -1.3%).
Wage growth slowed to 3.2% in August, slightly lower than 3.3% in July.
Key Implications
July and August's job losses have now more than reversed June's outsized gain, and the Canadian economy has lost 39k jobs since January. The unemployment rate has risen half a percentage point over the same time period. It could be worse though, a slowdown in labour force growth is keeping the unemployment rate from rising too high, despite weak labour demand.
August's report is consistent with the Bank of Canada's characterization of "an excess supply of labour" in July's Monetary Policy Report. However, it hasn't yet prompted them to lower rates beyond the pre-emptive cuts made early in the year. Markets are now putting odds on the next cut coming in September. We have long expected two more cuts this year, with the inflation report on September 16th likely to help cement the timing of the next cut.
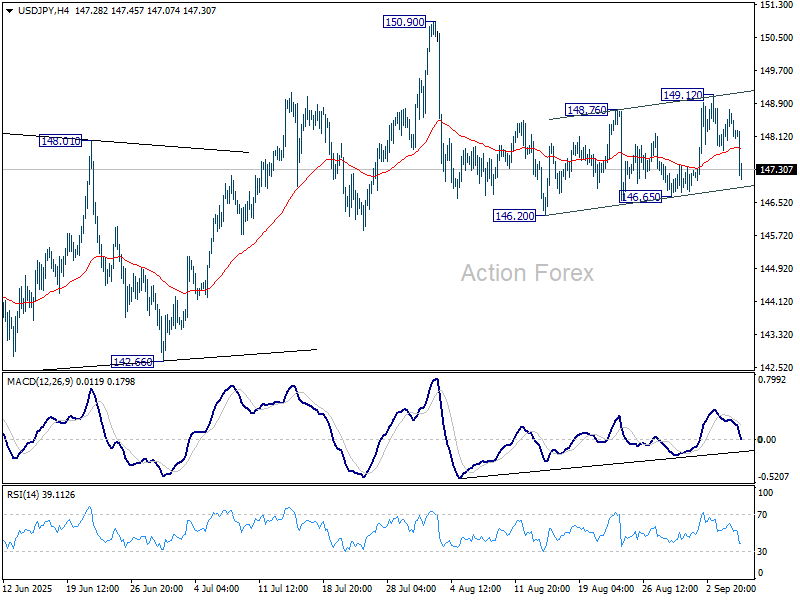
USD/JPY Mid-Day Outlook
Daily Pivots: (S1) 147.91; (P) 148.35; (R1) 148.90; More...
Focus is back on 146.65 support as fall from 149.12 accelerates lower. Firm break there will suggest that decline from 150.90 is resuming through 146.20. MO re importantly, sustained trading below 55 D EMA will argue that rise from 139.87 has completed as a three-wave corrective move. Deeper fall should be seen to 142.66 support next. On the upside, though, above 149.12 will bring another bounce back towards 150.90.
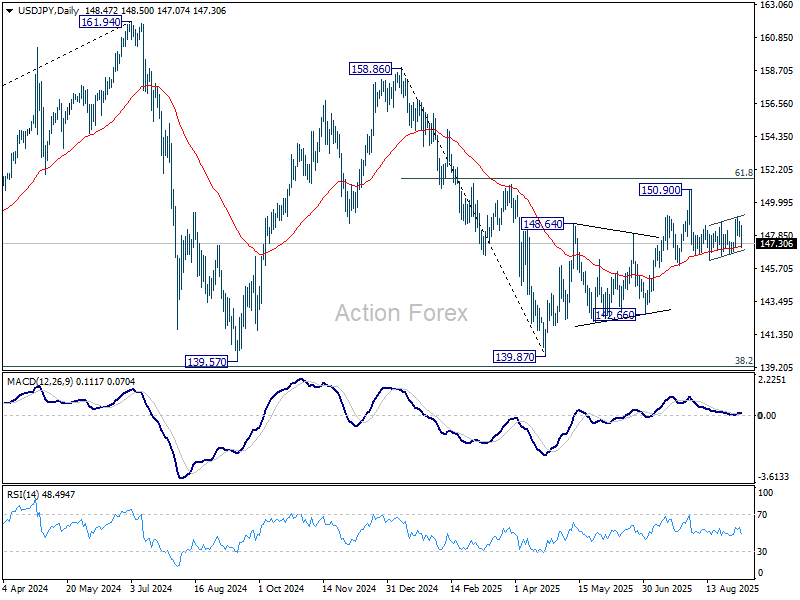
In the bigger picture, price actions from 161.94 (2024 high) are seen as a corrective pattern to rise from 102.58 (2021 low). Decisive break of 61.8% retracement of 158.86 to 139.87 at 151.22 will argue that it has already completed with three waves at 139.87. Larger up trend might then be ready to resume through 161.94 high. In case the corrective pattern extends with another fall, strong support is expected from 38.2% retracement of 102.58 to 161.94 at 139.26 to bring rebound.
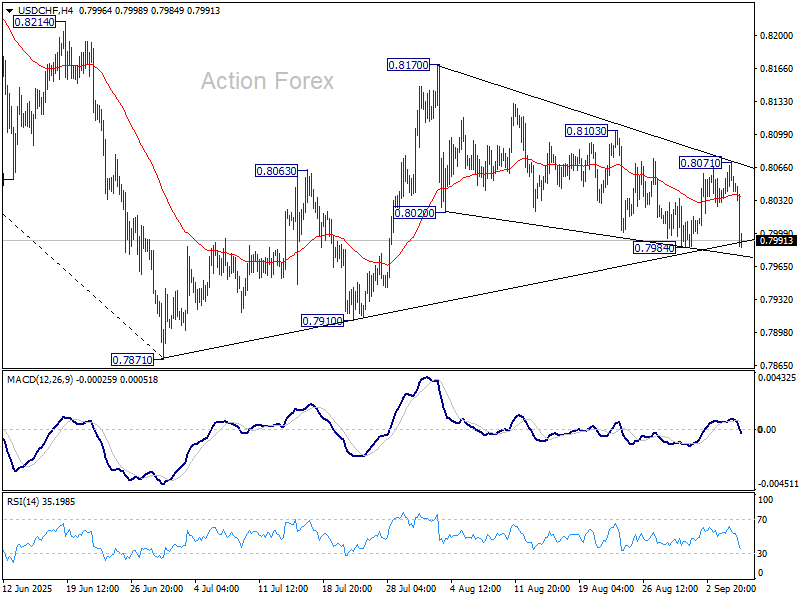
USD/CHF Mid-Day Outlook
Daily Pivots: (S1) 0.8031; (P) 0.8052; (R1) 0.8076; More….
Immediate focus is now on 0.7984 support with current decline. Break there will resume the fall from 0.8170 to retest 0.7910 support first, and then retest of 0.7871 low. Risk will now stay on the downside as long as 0.8071 resistance holds, in case of recovery.
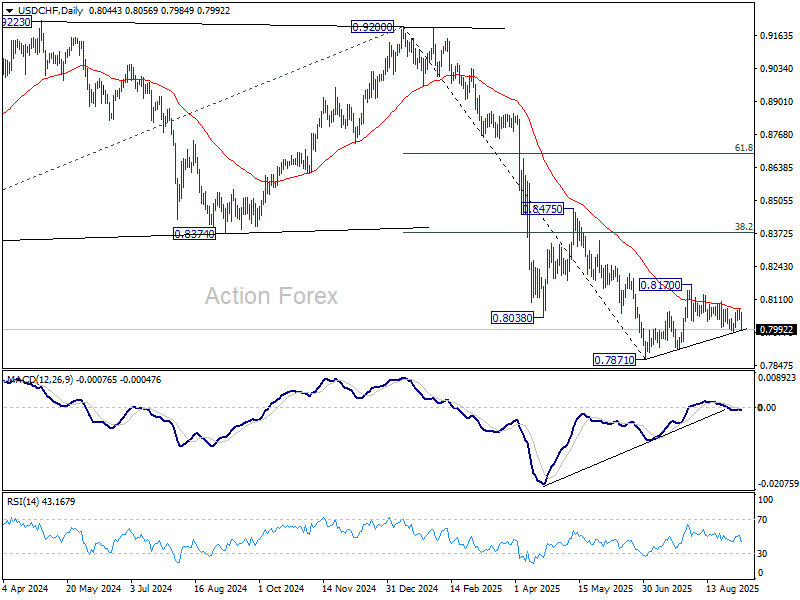
In the bigger picture, long term down trend from 1.0342 (2017 high) is still in progress. Next target is 100% projection of 1.0146 (2022 high) to 0.8332 from 0.9200 at 0.7382. In any case, outlook will stay bearish as long as 0.8475 resistance holds.
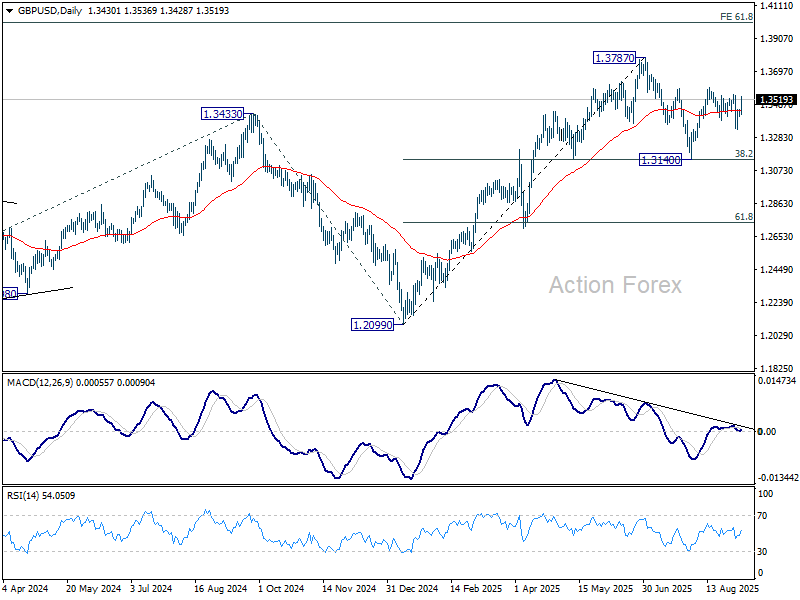
GBP/USD Mid-Day Outlook
Daily Pivots: (S1) 1.3415; (P) 1.3437; (R1) 1.3457; More...
Immediate focus is back on 1.3549 as GBP/USD's rebound accelerates higher. Firm break there will resume the rise from 1.3140 through 1.3594 resistance for retesting 1.3787 high. For now, risk will be on the upside as long as 1.3332 support holds, in case of retreat.
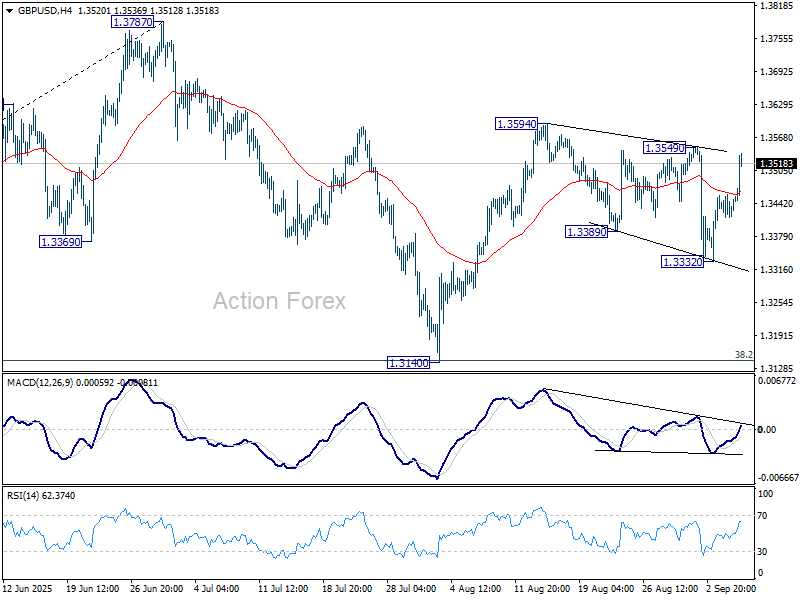
In the bigger picture, up trend from 1.3051 (2022 low) is in progress. Next medium term target is 61.8% projection of 1.0351 to 1.3433 from 1.2099 at 1.4004. Outlook will now stay bullish as long as 55 W EMA (now at 1.3104) holds, even in case of deep pullback.
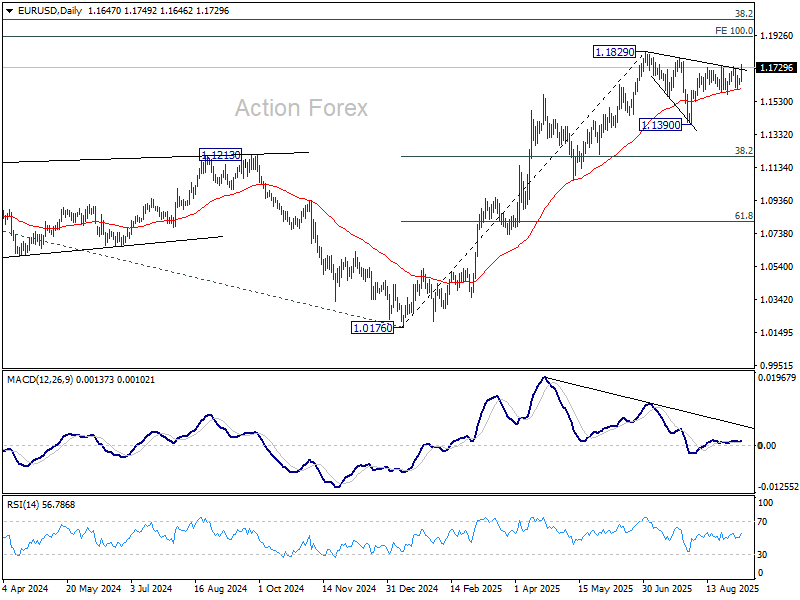
EUR/USD Mid-Day Outlook
Daily Pivots: (S1) 1.1630; (P) 1.1650; (R1) 1.1669; More...
Intraday bias in EUR/USD is back on the upside with breach of 1.1741 resistance. Further rise should be seen to retest 1.1829 high. Firm break there will resume larger up trend and target 1.1916 projection level. Further rally is now expected as long as 1.1607 support holds, in case of retreat.
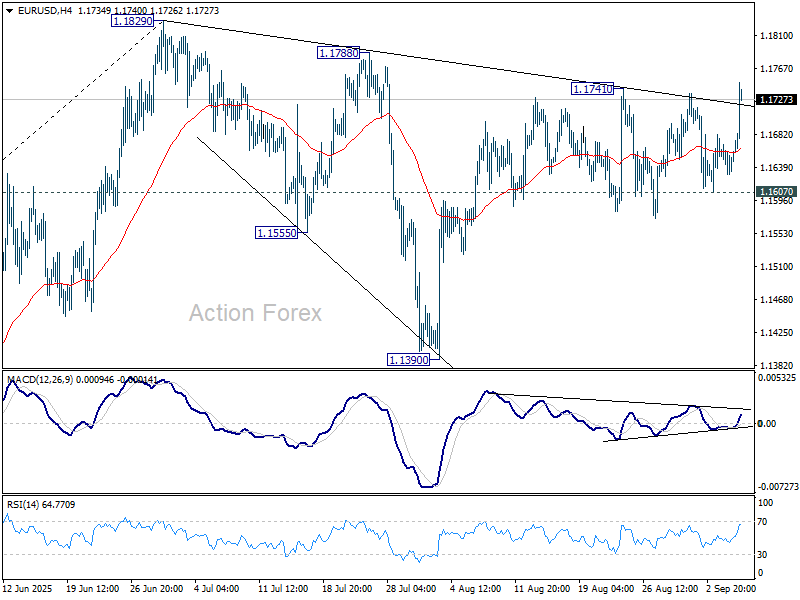
In the bigger picture, rise from 0.9534 (2022 low) long term bottom could be correcting the multi-decade downtrend or the start of a long term up trend. In either case, further rise should be seen to 100% projection of 0.9534 to 1.1274 from 1.0176 at 1.1916. This will remain the favored case as long as 1.1604 support holds.
Dollar Slumps After NFP Shock, Fed Cut Bets Escalate
Dollar tumbled sharply in early New York trading Friday after much weaker-than-expected non-farm payrolls report. 10-year Treasury yield plunging through the 4.1% level while Gold also surged to fresh record high.
Traders moved swiftly to reprice Fed expectations, with a 25bps cut this month fully baked in and fresh speculation that policymakers may opt for a larger 50bps move. Looking ahead, odds of another 25bps cut in October spiked above 75%, underscoring market conviction that the central bank will need to move aggressively to shield the labor market.
That places next week’s CPI report in sharp focus. Should inflation show further signs of easing, it would open the door for the Fed to accelerate its easing cycle.
In weekly performance terms, Canadian Dollar is faring worst after its own dismal jobs data, while Yen remains under pressure but may recover some ground. Dollar is sliding toward the bottom of the performance table, likely to surpass Yen before the week closes. Euro leads gains, followed by the Aussie and Sterling, with Swiss Franc and Kiwi holding mid-pack.
In Europe, at the time of writing, FTSE is up 0.35%. DAX is up 0.09%. CAC is up 0.15%. UK 10-year yield is down -0.066 at 4.659. Germany 10-year yield is down -0.054 at 2.668. Earlier in Asia, Nikkei rose 1.03%. Hong Kong HSI rose 1.43%. China Shanghai SSE rose 1.24%. Singapore Strait Times rose 0.24%. Japan 10-year JGB yield fell -0.029 to 1.576.
US payrolls add just 22k, unemployment edges to 4.3%
US non-farm payrolls showed a sharp slowdown in hiring in August, with employment rising by only 22k, far below the 78k expected. Revisions painted a mixed picture, with July adjusted slightly higher to 79k but June lowered into contraction at -13k.
Unemployment rate ticked up from 4.2% to 4.3% as expected, while the participation rate edged higher by 0.1% to 62.3%. The employment-population ratio was steady at 59.6%, suggesting little improvement in labor utilization despite modest gains in the workforce.
Wage growth remained steady, with average hourly earnings rising 0.3% mom and up 3.7% over the past year. While pay increases are holding, the weak job creation numbers highlight the Fed’s dilemma: inflation may be edging down, but labor market cooling is becoming more pronounced.
Canada employment falls -65.5k, jobless rate jumps to 7.1%.
Canada’s labor market weakened further in August, with employment falling by -65.5k, far below expectations of 4.9k gain. This marked the second consecutive monthly contraction, driven almost entirely by a sharp -60k drop in part-time jobs, while full-time employment was little changed.
Unemployment rate climbed to 7.1% from 6.9%, above expectations, marking the highest level since May 2016 outside the pandemic years. Both the employment rate and participation rate slipped, falling to 60.5% and 65.1%.
Wage growth offered little relief, with average hourly earnings rising 3.2% yoy, slightly slower than July’s 3.3% yoy.
Bonuses lift Japan’s real wages to growth, but consumption recovery weak
Japan’s wage data showed a notable improvement in July, with real wages rising 0.5% yoy, the first increase in seven months. Nominal cash earnings jumped 4.1% yoy, far above expectations of 3.0% yoy, marking the 43rd consecutive month of annual gains.
Wage growth was boosted by a 7.9% yoy surge in special earnings, primarily reflecting summer bonuses, alongside a 2.5% yoy rise in base salaries and a 3.3% yoy increase in overtime pay, the strongest since late 2022.
However, inflation continues to erode some of those gains. Consumer prices used to calculate real wages rose 3.6% in July, still well above the BoJ’s 2% target. Food prices, especially rice, remained a major driver.
Also released, household spending increased 1.4% yoy, falling short of forecasts, though seasonally adjusted monthly spending posted a stronger 1.7% mom gain. A Ministry official said the uptick in spending was largely due to higher electricity bills and auto-related costs, while purchases of everyday food items remain subdued. “The recovery in consumer spending is not robust,” the official cautioned.
EUR/USD Mid-Day Outlook
Daily Pivots: (S1) 1.1630; (P) 1.1650; (R1) 1.1669; More...
Intraday bias in EUR/USD is back on the upside with breach of 1.1741 resistance. Further rise should be seen to retest 1.1829 high. Firm break there will resume larger up trend and target 1.1916 projection level. Further rally is now expected as long as 1.1607 support holds, in case of retreat.
In the bigger picture, rise from 0.9534 (2022 low) long term bottom could be correcting the multi-decade downtrend or the start of a long term up trend. In either case, further rise should be seen to 100% projection of 0.9534 to 1.1274 from 1.0176 at 1.1916. This will remain the favored case as long as 1.1604 support holds.
Canada employment falls -65.5k, jobless rate jumps to 7.1%.
Canada’s labor market weakened further in August, with employment falling by -65.5k, far below expectations of 4.9k gain. This marked the second consecutive monthly contraction, driven almost entirely by a sharp -60k drop in part-time jobs, while full-time employment was little changed.
Unemployment rate climbed to 7.1% from 6.9%, above expectations, marking the highest level since May 2016 outside the pandemic years. Both the employment rate and participation rate slipped, falling to 60.5% and 65.1%.
Wage growth offered little relief, with average hourly earnings rising 3.2% yoy, slightly slower than July’s 3.3% yoy.
US payrolls add just 22k, unemployment edges to 4.3%
US non-farm payrolls showed a sharp slowdown in hiring in August, with employment rising by only 22k, far below the 78k expected. Revisions painted a mixed picture, with July adjusted slightly higher to 79k but June lowered into contraction at -13k.
Unemployment rate ticked up from 4.2% to 4.3% as expected, while the participation rate edged higher by 0.1% to 62.3%. The employment-population ratio was steady at 59.6%, suggesting little improvement in labor utilization despite modest gains in the workforce.
Wage growth remained steady, with average hourly earnings rising 0.3% mom and up 3.7% over the past year. While pay increases are holding, the weak job creation numbers highlight the Fed’s dilemma: inflation may be edging down, but labor market cooling is becoming more pronounced.