
Sample Category Title
Fed’s Williams sees gradual return to neutral rates, tariffs still a drag
New York Fed President John Williams said Thursday that monetary policy is now “modestly restrictive” and appropriate for current conditions, but signaled that rates may eventually be guided back toward neutral if progress continues on inflation and employment. Speaking at the Economic Club of New York, Williams said he sees scope for gradual adjustments if his baseline forecast holds.
Williams projected GDP growth between 1.25% and 1.50% this year, with the unemployment rate edging up from 4.2% currently to 4.5% next year. He noted the job market has cooled, and it's "clearly the case" that hiring risks are tilted to the downside.
On inflation, Williams said tariffs are clearly pushing prices higher, adding an estimated 1.0% to 1.5% to inflation this year. He forecast PCE inflation to average between 3% and 3.25% in 2025 before falling to 2.5% next year and back to the Fed’s 2% goal in 2027. Speaking to reporters, Williams added that upside risks from tariffs have eased “on the margin,” noting that inflation dynamics remain contained despite ongoing trade disruptions.
Separately, Chicago Fed President Austan Goolsbee struck a more cautious tone, saying he has not yet decided whether a cut is appropriate at the September 16–17 FOMC meeting. he described the gathering as a “live meeting,” adding that Friday’s jobs report and upcoming inflation data will be pivotal to his decision.
Cliff Notes: A Promising Trend for Australia
Key insights from the week that was.
In Australia, Q2 GDP confirmed the economy is starting to turn a corner, rising 0.6% to be up 1.8% over the past year. The fact that household spending was the main driver of growth, up 0.9% and 2.0%yr, was perhaps the most encouraging revelation of the detail. Although this was partly due to abnormal seasonality and sales events, corroborated by a stronger lift in discretionary services spend, this result still marks a welcome and genuine shift. The steady recovery in real discretionary incomes is playing a crucial role, supported by continued gains in wages, moderating inflation, shrinking interest bills and tax relief.
Trends across the rest of the economy were little changed. Public investment continues to retreat from record highs as major infrastructure projects near completion. Though, this looks to be facilitating capacity rebalancing in the construction sector towards housing. Worryingly, businesses remain hesitant to invest in additional capacity, as evinced by the –0.4% decline in new business investment in Q2.
The external sector meanwhile provided a slight boost to economic activity in the quarter, net exports adding 0.1ppts to GDP. This support looks to have extended into Q3, July’s goods trade surplus of $7.3bn a seventeen-month high on the back of stronger exports to the US as well as softer imports. Globally, trade networks are adapting to US tariffs, but it will still be some time before the ‘new normal’ is fully understood. Our latest edition of ‘talking about trade’ takes stock of the latest developments in global trade and economic activity.
Before moving offshore, a final note on housing. The latest Cotality (formerly CoreLogic) data showcased another solid gain for house prices in August, up 0.8% (3.6%yr), highlighting the positive impetus rate cuts provide. Although dwelling approvals surprised to the downside with an –8.2% decline – due to continued volatility in the ‘units’ category – conditions are becoming more supportive as cost pressures ease and homebuyer sentiment strengthens. Affordability constraints remain the key risk to the uptrend, as discussed in our latest Housing Pulse.
Offshore, the data flow was light in the lead-up to tonight’s much-anticipated US August employment report. Of the releases to date, the US Federal Reserve’s latest Beige Book was most significant, providing another downbeat view of current conditions and the outlook.
"Most of the twelve Federal Reserve Districts reported little or no change in economic activity... and contacts reported flat to declining consumer spending because, for many households, wages were failing to keep up with rising prices". Contacts also "frequently cited economic uncertainty and tariffs as negative factors". On the labour market, "eleven Districts described little or no net change in overall employment levels". Only "two Districts reported an increase in layoffs... but contacts in multiple Districts reported reducing headcounts through attrition—encouraged, at times, by return-to-office policies and facilitated, at times, by greater automation, including new AI tools". Labour supply is also constrained, holding the unemployment rate down. In September, "half of the Districts... reported a reduction in the availability of immigrant labor".
On inflation, "ten Districts characterized price growth as moderate or modest"... [but] nearly all Districts noted tariff-related price increases, with contacts from many Districts reporting that tariffs were especially impactful on the prices of inputs". "Contacts in multiple Districts also reported rising prices for insurance, utilities, and technology services". The tension the FOMC face between their inflation and employment mandates was also highlighted by New York Fed President Williams overnight, albeit with clear hope that these uncertainties would resolve themselves through 2026, allowing the FOMC to return policy slowly to a broadly neutral setting.
William’s optimism for growth needs a firmer foundation to build in coming months based on the latest ISM detail. The manufacturing ISM PMI ticked up to 48.7 in August as the new orders component rose to 51.4pts – still a weak outcome versus the five-year pre-COVID average of 56.3. The employment indicator meanwhile remained contractionary. For services, while the headline index lifted to 52.0 in August, the employment index languished at a contractionary reading of 46.5. Both ISM surveys therefore point to a material risk of economy-wide headcount reduction in coming months.
The US economy looks to need greater support than the two cuts we see into year end to complete this easing cycle. But, in the absence of a marked deceleration in inflation, this is hard to justify. In our view, the six rate cuts the market now have priced to January 2027 would require the unwinding of bilateral tariffs (possible given this week the Federal Appeals Court upheld the view that Liberation Day’s bilateral tariffs are illegal) or a much sharper deterioration in economic activity and the labour market, which would force the FOMC’s to look past current above-target inflation.
Over in Europe, the flash estimate for August inflation printed at 2.1%, the sixth consecutive actual read within 0.2ppts of the ECB’s 2.0% target, while the unemployment rate remained at historic lows in July, printing at 6.2%. On the surface, the latter result is indicative of a tight labour market; however, there is cause to believe current conditions are instead best considered balanced. Prior to the pandemic, from 2013 the unemployment rate trended lower in part due to the effect on total participation of population ageing, an evolving global phenomenon expanded on this week by Chief Economist Luci Ellis and Economist Ryan Wells. A preference for lower hours and an increase in participation amongst women and seniors have also boosted the level of employment in Europe. As a result, there is little reason to fear inflation spurred by the labour market. The ECB is therefore likely to take the policy rate to the lower end of the neutral range and then go on hold for an extended period, allowing GDP growth to firm slowly to trend through 2026.
The Tussles
Two-sided risks to the domestic outlook as cyclical upswing takes hold for the consumer while public sector fades. The net effect on the labour market is a tussle between faster, but less jobs-rich, demand growth and a trend increase in labour force participation.
- For some time, we have been pointing to the need for private sector demand growth to pick up and offset an expected fade in growth in public demand. Recent data confirm that this is taking place, with consumer spending now gaining more momentum while the decline in public investment has become more apparent. This is not a consumer boom but rather a long-awaited recovery from an extraordinarily extended period of weakness.
- While we may still see a ‘shaky handover’ from public to private demand drivers, the risks around the domestic outlook are now more two-sided. As always with a tussle between two forces working in opposite directions, though, the net outcome can be noisy and the underlying trend will not always be straightforward to read.
- The labour market outlook reflects another tussle between opposing forces. While overall output growth is expected to increase further from here, activity will be less job-rich as growth in the labour intensive ‘care economy’ normalises and the expansion becomes centred on a less labour-intensive market sector. At the same time, labour supply is likely to trend up given the demographic forces pushing up participation. The outcome of this tussle will matter for the evolution of labour market slack.
This week’s June quarter national accounts release marked a notable step along the path of Australia’s evolving growth narrative. It showed the economy expanding a solid 0.6% in the June quarter 2025, lifting annual growth to 1.8%yr, returning to positive in per capita for the first time since 2023.
The headline result was slightly better than expected but the detail contained a more material upside surprise on consumer spending: a 0.9%qtr rise lifting growth to 2%yr. While some of this appears to be due to one-offs, underlying momentum looks firmer, consistent with rising growth in household disposable incomes and improving consumer sentiment. The consumer-led recovery that began in mid-2024 had seemed to lose its way a little in the first half of 2025 but now looks to be more firmly back on track.
Spending growth is still not strong per se. What we are seeing is a long-awaited recovery from an extraordinarily long period of weakness. The seven consecutive quarterly declines in per capita spending in 2023 and 2024 is the longest sequence of declines since quarterly estimates became available in 1960. The peak-to-trough fall is also larger than that seen during the early-1990s recession and not far off the decline seen during the GFC, albeit spread over two years rather than one. Even with a recovery and a solid June quarter result, per capita spending has only clawed back about 40% of the decline.
And, as mentioned, there were some temporary factors in the mix in the June quarter. The ABS highlighted the close timing of Easter and ANZAC Day public holidays in 2025, which appears to have encouraged longer breaks, giving a bigger than usual boost to discretionary services spend (where most of the upside surprise came from). There may also have been a bigger than usual response to End of Financial Year sales – our Westpac-DataX Card Tracker suggests this has been followed by a much quieter July-August with the pattern of shoppers more actively targeting sales windows something we have been seeing over most of the last two years. There may also be some other one-off factors at play – e.g. insurance-funded replacement spending and delayed activity relating to disruptions from Cyclone Alfred in March.
The full extent of these influences will only become apparent once the September quarter data rolls in. If they do prove to be large, we could well see some combination of a softer September quarter spend and downward revisions to the June quarter.
But even allowing for some likely one-off boosts, the June quarter update suggests the consumer recovery is on a firmer footing. For the first time in a while, risks to the consumer are ‘two-sided’ rather tilted to the downside.
Outside of the consumer, the update was less comforting. New business investment declined in the quarter with capex intentions suggesting the softness will continue. Meanwhile public demand is showing a clearer slowdown centred on a turn in public investment which has now fallen nearly 7% over the past three quarters. While the consumer is looking better, the wider mix still points to residual risks of ‘shaky handover’ as growth moves from public to private demand drivers.
The implications for labour demand are more nuanced. While the balance of these forces is expected to see GDP growth continue to pick up from here, the composition of growth will become less ‘job rich’ as it becomes more centred on the market-sector. The ‘care economy’ has expanded considerably over recent years, as we have noted on previous occasions. This is a labour-intensive part of the economy, which is why employment growth has been able to remain robust and the labour market tight, even though overall economic growth has been lacklustre over the past two years.
Older, more female workforce as participation rises
We should not forget the supply side of the labour market equation either. As described in a note released today with my colleague Ryan Wells, there is also a tussle between labour demand (wherever it ends up) and the ongoing uptrend in labour supply coming from rising participation rates. The latter has been an underappreciated feature even though it apparent in multiple countries for at least a quarter-century. This is because most people assume that as population ageing sees a higher proportion of people of retirement age this leads to a shrinking workforce relative to the adult population.
It turns out that population ageing happens because people are living longer, healthier lives and having smaller families. This means that fewer people are retiring early due to ill health and disability. It also means that many people end up working beyond conventional retirement ages in order to fund what would otherwise be a very long, expensive retirement. Meanwhile, smaller families mean people on average are spending less time out of the workforce. Labour participation of women, and of older workers of both sexes, therefore rises.
For many countries, including Australia and most other advanced economies other than the US, the net effect has been that overall participation has risen not fallen. There are probably limits to this effect, which high ‘within-age-group’ participation countries like Japan and New Zealand are testing. But for Australia at least, it seems very likely that overall participation rates will remain on an upward trend for a while yet. This has probably been under-appreciated because it is counter-intuitive, and because it is not a phenomenon in the US, as the note with Ryan discusses.
The net of some softening growth in labour demand but still-rising labour supply could mean that labour market slack increases more than some forecasters are expecting. How this plays out for domestic inflation pressures remains to be seen, but it is one of the reasons we think that inflation could be lower in early 2026 than the RBA currently forecasts.
NFP Preview: US Jobs Report & Implications for the DXY, Gold (XAU/USD) & Dow Jones (DJIA)
- The US Jobs Report (NFP) is expected to show job growth of 75,000, with unemployment rising to 4.3%.
- US job growth is slowing, with recent revisions showing underlying weakness.
- The Fed faces a dilemma between faltering job creation and persistent wage growth.
- A weak report could solidify the case for a Fed rate cut, boosting stocks and gold.
US Labor Market Backdrop
The August 2025 Non‑Farm Payrolls report looks set to become a turning point for both the U.S. job market and the Fed’s policy path. Most analysts think about +75,000 jobs will be added, only a little more than July’s +73,000 and clearly slower than the fast pace earlier this year.
At the same time the labor‑force participation rate fell to a 31‑month low, and factories lost workers for three months in a row – about 36,000 jobs gone. Yet the unemployment rate still sits around a historic low of 4.2 percent, suggesting the market still has some strength.
NFP Preview: What to Expect
The consensus for the August NFP report is centered around the addition of 75,000 jobs, a figure that is only marginally higher than the 73,000 jobs added in July, which was itself a substantial miss from the 110,000 forecast.
The unemployment rate is projected to tick up by a tenth of a percentage point to 4.3%, and average hourly earnings are expected to cool slightly to a 3.7% year-on-year increase from 3.9% in the prior period.
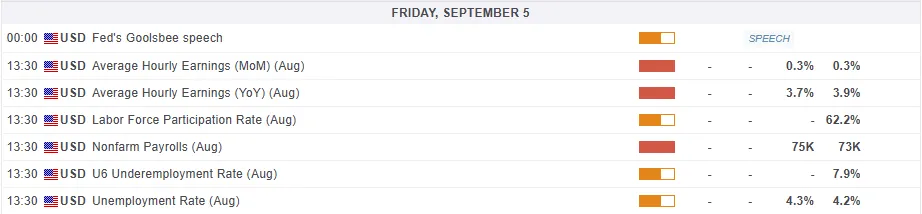
For all market-moving economic releases and events, see the MarketPulse Economic Calendar. Time used is British Standard Time (BST) (click to enlarge)
The US job market is clearly slowing down and is weaker than the main numbers suggest. The biggest warning sign is that the job figures for May and June were revised to be much lower, it turns out 258,000 fewer jobs were created than was first reported. This proves the job market was in worse shape than we originally thought and that the trend is getting worse.
Even though the official unemployment rate seems low, other signs also point to weakness. A smaller percentage of people are actively working or looking for jobs, which makes the unemployment rate look better than it really is. On top of that, key areas like manufacturing have been cutting jobs.
All of this together shows the job market is on shaky ground, and it now seems more likely that the unemployment rate will be on the rise in the months ahead.
The Federal Reserve Conundrum
The NFP report presents a challenge for the Federal Reserve and comes at a time when Fed independence has been questioned. Pressure has been mounting from the US administration for aggressive rate cuts.
The current environment, marked by a cooling jobs market and persistent wage growth, creates an uneven backdrop for policymakers. Jobs are starting to cool, yet wages keep rising. That mix may mean the Fed could see a wage‑price spiral, a situation where higher pay fuels more inflation. If that happens, cutting rates could become much harder still.
The Fed has until now cited the uncertainties around tariffs and its impact on inflation as an ongoing concern. However, following the revised labor numbers of late are now unable to ignore the situation with Fed Chair Powell's de facto admission at Jackson Hole that labor market concerns now outweigh inflation, a clear sign of the challenge and thinking of a divided Fed.
Market expectations are already heavily skewed toward a rate cut. A 25 basis point (bps) cut at the September Federal Open Market Committee (FOMC) meeting is nearly fully priced in, with over 57 bps of cuts anticipated by December 2025.
The upcoming report could serve to sway some Fed policymakers as we heard from Rafael Bostic who said “I am not ruling out a September rate cut depending on the coming jobs report and other data.” This highlights the magnitude of the data release.
Potential implications for the US Dollar Index (DXY), Dow Jones and Gold
The market's reaction to the NFP report will not be uniform, but rather dependent on the deviation from consensus forecasts. These are the potential reactions we could see depending on how the data comes out and is received.
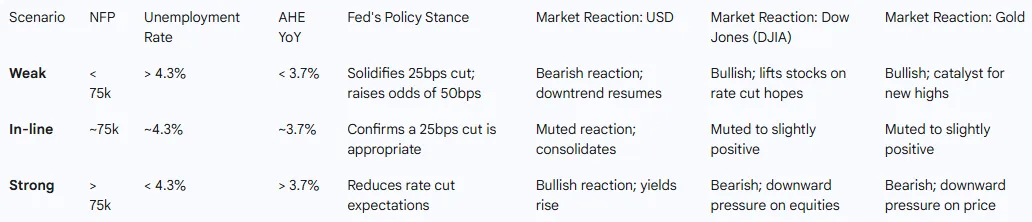
Source: Table Created by Zain Vawda, Data from LSEG
Many of the assets above are at interesting areas what we would call inflection points with the next moves likely dependent on tomorrow's data.
US Dollar Index (DXY)
The broader bias for the US Dollar Index (DXY) remains bearish into the fourth quarter, predicated on the expectation of further Fed easing. A weak NFP report, particularly one with capped wage growth, would likely be the trigger that pushes the dollar below its key 97.45 support level, allowing its downtrend to resume.
US Dollar Index (DXY) Daily Chart, September 4, 2025
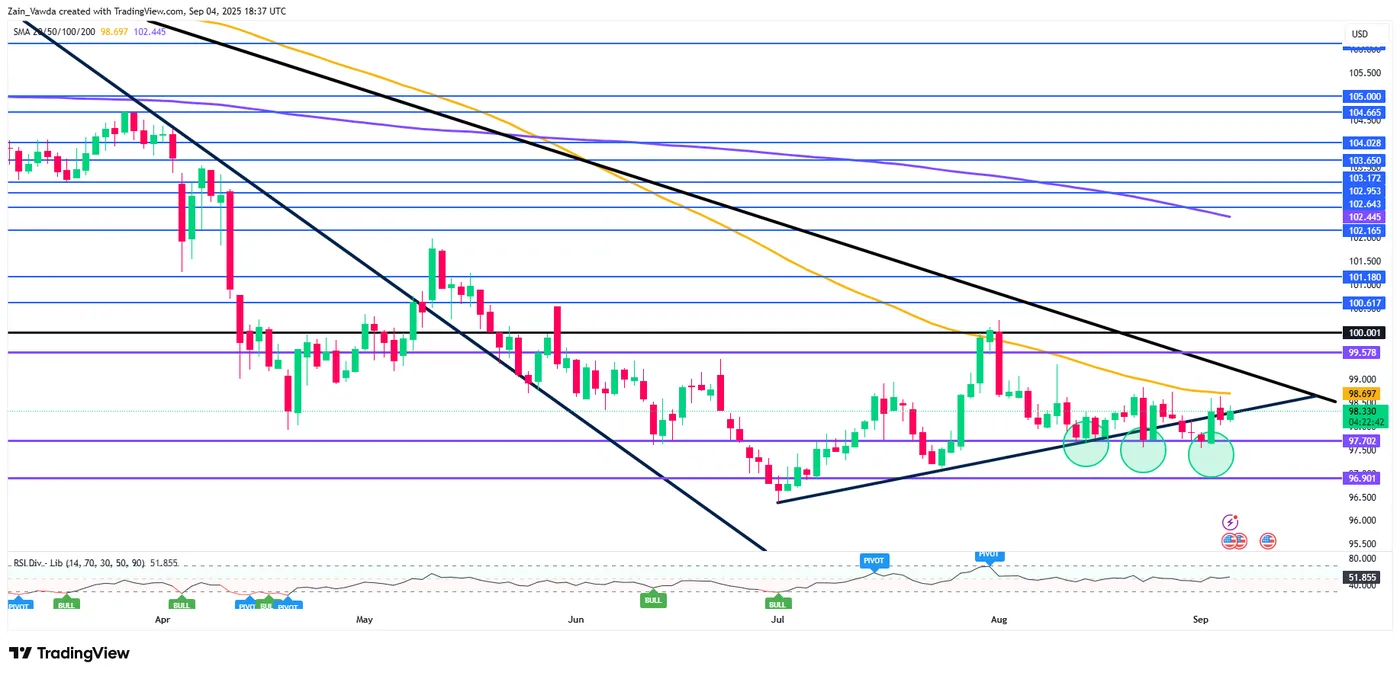
Source: TradingView (click to enlarge)
Dow Jones Index (DJIA)
The Dow has moved a lot lately, driven by hopes of Fed cuts. After the July NFP disappointment, the index fell hard, then bounced back when the data “re‑ignited hopes” for more cuts. This pattern suggests an inverse link: weaker jobs data can actually lift stocks in the current setting.
Dow Jones Index Daily Chart, September 4, 2025
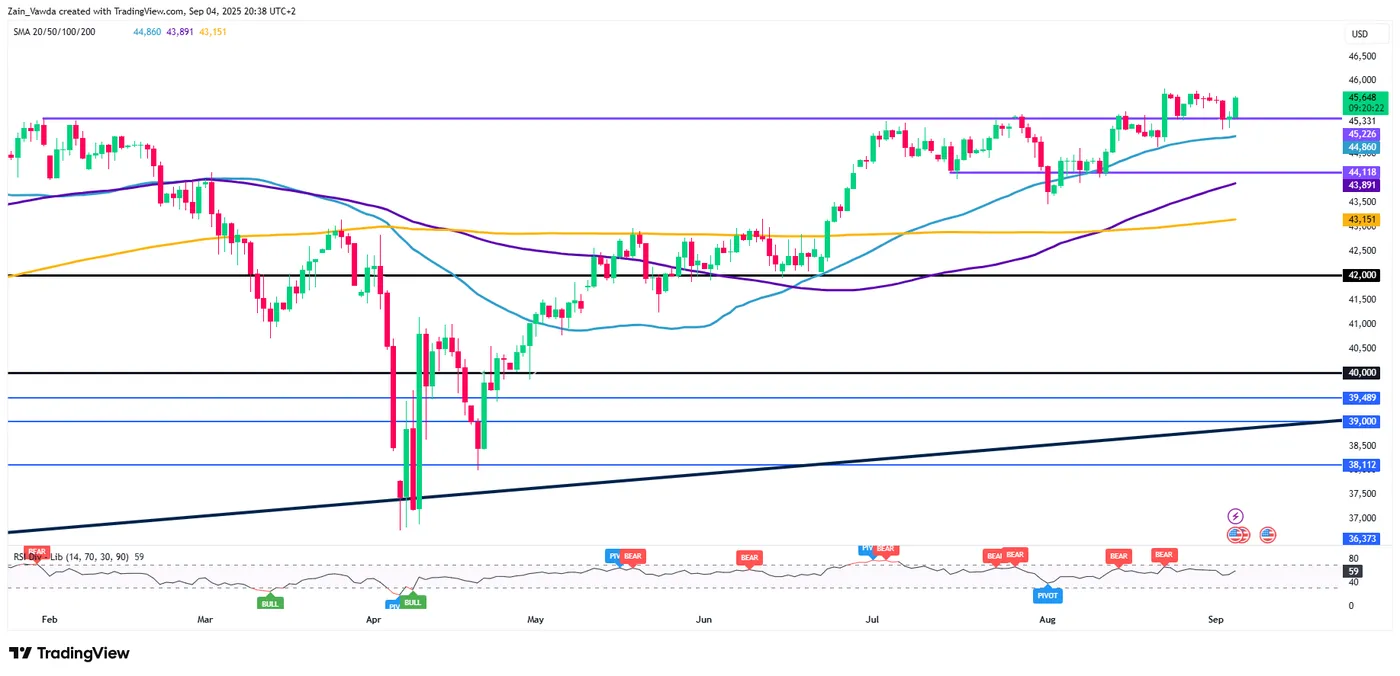
Source: TradingView (click to enlarge)
Gold (XAU/USD)
Gold stays near historic highs, a move mainly fueled by thoughts of an upcoming Fed cut. A soft NFP report would likely act as a strong push for more gold buying, reinforcing the case for monetary easing and making a non‑yielding metal more attractive.
Silver Nears All-time Highs, Where to Look Next? XAG Higher Timeframe Outlook
Silver has outshined its peers in terms of performance, bolstered by the increasingly-menaced FED independence and Gold also rallying to new all-time highs.
The fundamentals are not changing: Markets are still anxious about the future outlook for the US Dollar with the Trump Administration's US Exceptionalism policy.
As time progressed, and despite some harsh tariffs that will start to bite into US Importers' profits, it seems that Markets were putting less emphasis on such policies with the Dollar Index stopping its early-2025 fall-off.
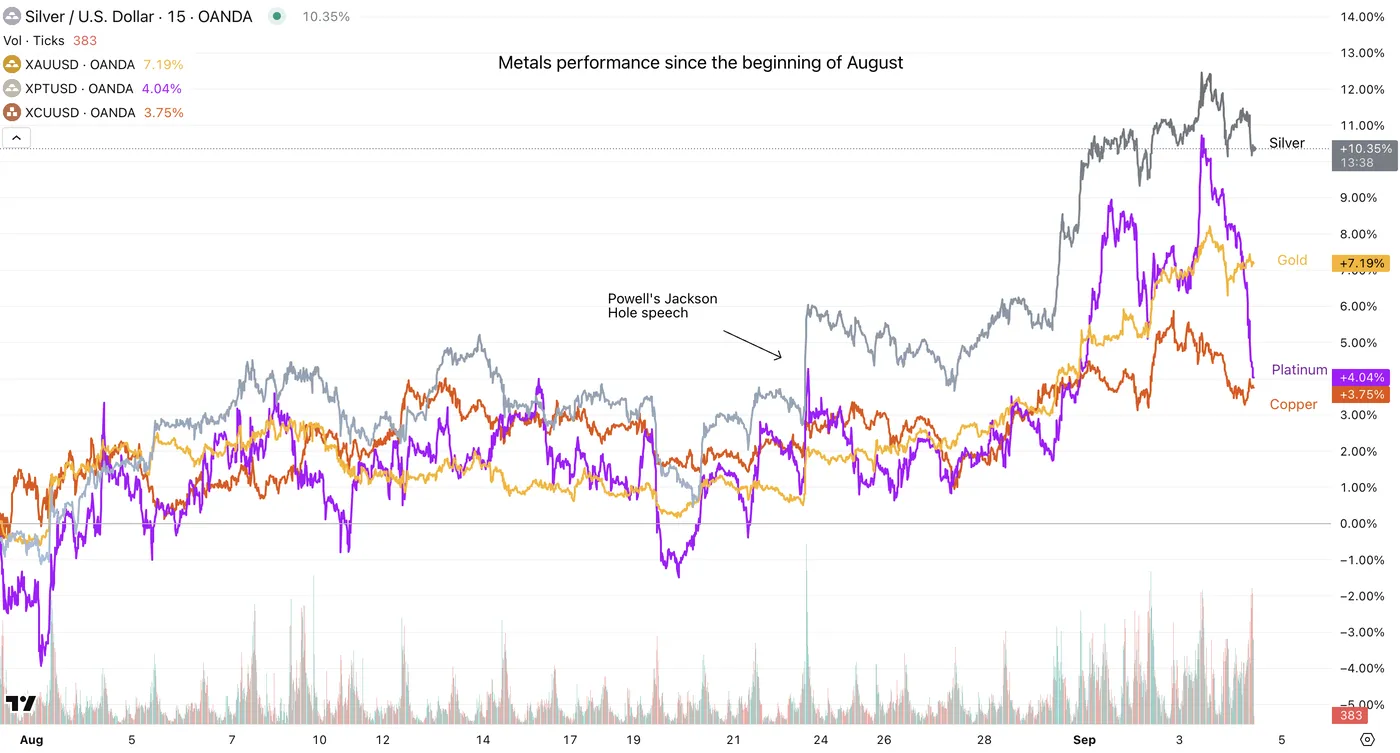
Metals comparative performance since August 2025 – Source: TradingView
The US Dollar's status as reserve currency is still far from being replaced.
Nonetheless, firms and central banks have been looking for ways to diversify from risks to the Greenback and related assets like US Treasuries (still largely the most liquid non-cash asset).
Geopolitic events such as the most recent Chinese Military Parade (the largest ever), celebrating the 80 years since the end of WW2 and hosting Vladimir Putin and Kim-Jong Un are also such testaments of the tone changing a little – The next 10 years are going to be interesting.
Anyway, let's log in to a few Silver charts, to see what are the bigger picture trends and get levels ahead of the Non-Farm Payrolls release.
Silver higher-timeframe technical analysis
Silver (XAG) Monthly chart
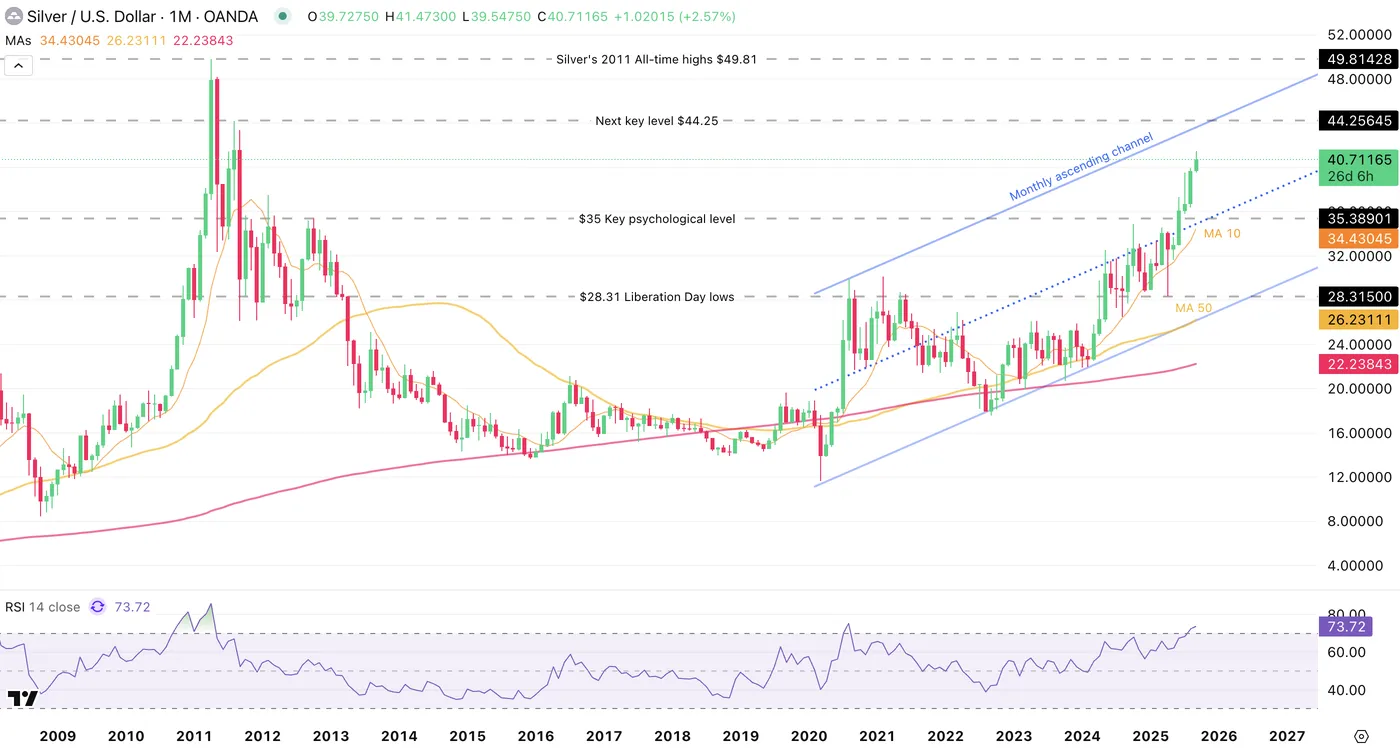
Silver Monthly Chart, September 4, 2025 – Source: TradingView
Silver is progressively spiking towards the August 2011 highs after breaking the $40 psychological barrier.
A Monthly ascending channel comes at a confluence with August 2011 highs ($44 to $44.50) and may act as a longer-timeframe profit-taking area.
On the other hand, depending on the global outlook and any further geopolitical/dollar-led tensions, a further breakout above the upper bound is possible towards a retest of the previous ATH (still far from now, but holds a decent probability).
The Daily picture during 2011 spikes
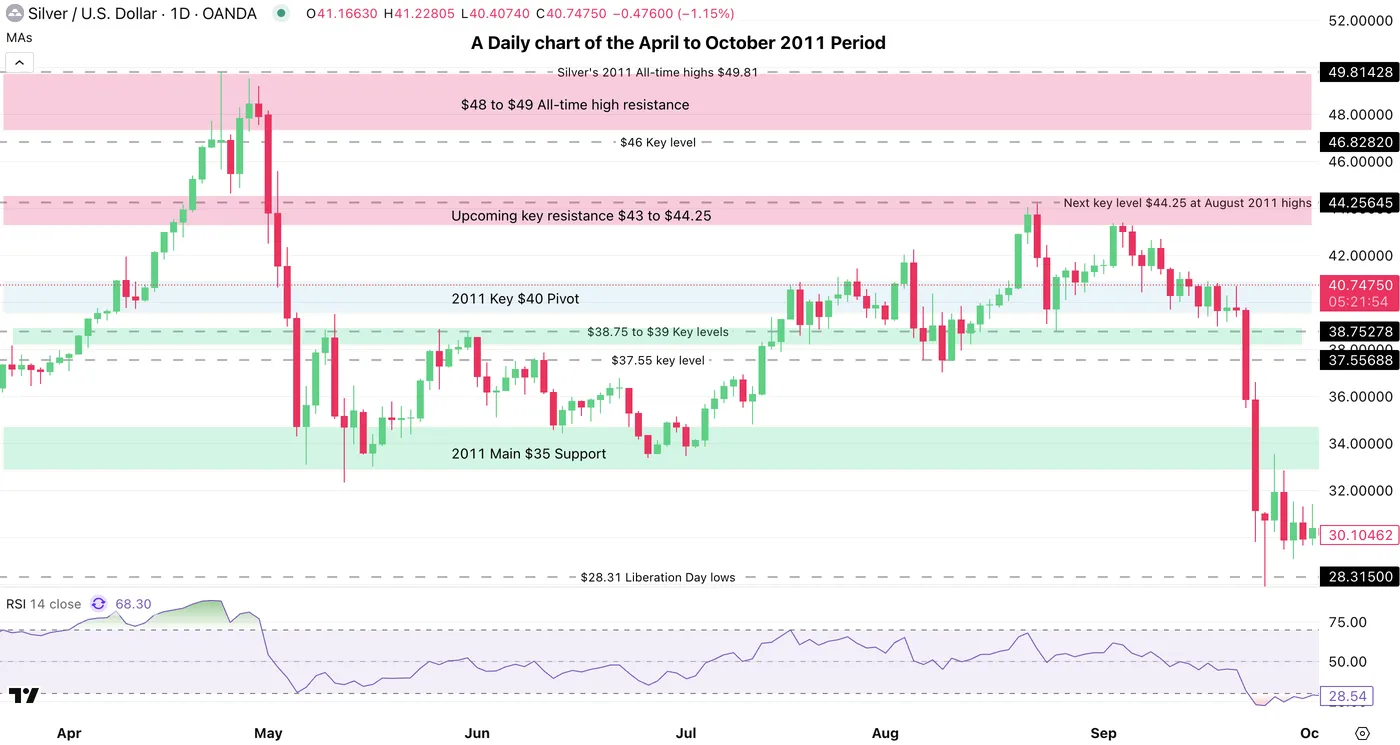
A Daily chart of the April to October 2011 Period – Source: TradingView
You can observe on this 2011 look-back how some key areas that will soon be tested either to the upside or downside and should influence upcoming flows for XAG trading.
One of the only scenario that would restrain the ongoing rally would be a very strong Non-Farm Payrolls which would lead to huge US Dollar rallies and a consequent profit-taking in metals.
For the rest, as expected should maintain the current-trend/consolidation period around the $40 pivot.
Any miss should boost Silver's momentum (the extent of the miss will influence the extent of the rally)
The current Daily picture with the 2011 support/resistance levels
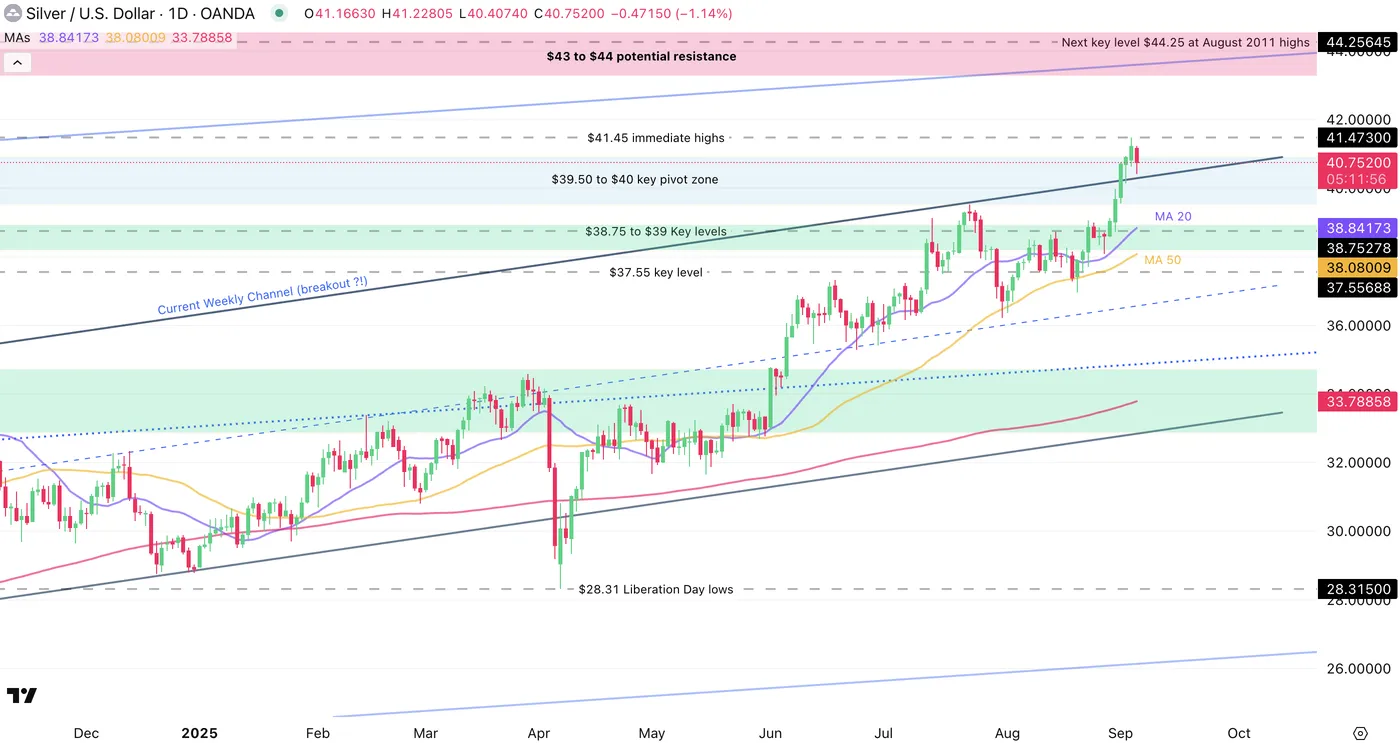
Silver Daily chart (current trading), September 4, 2025 – Source: TradingView
Silver has recently broken out of its weekly channel, indicating how strong the current trend is. The end-August to beginning September moves have been surprising.
Tomorrow's release and the September FOMC will shape up future demand for metals and will have huge influence on upcoming flows.
Levels to watch for Silver (XAG) trading:
Resistance Levels:
- $41.45 recent highs
- $42 psychological level
- $43 to $44 potential resistance
- August 2011 $44.25 top
Support Levels:
- $39.50 to $40 key pivot zone
- Support 38 to $38.5
- 2012 Highs Support around 37.50
Safe Trades!
GOLD: Bulls Consolidate Under New Record High Ahead of Key US Data
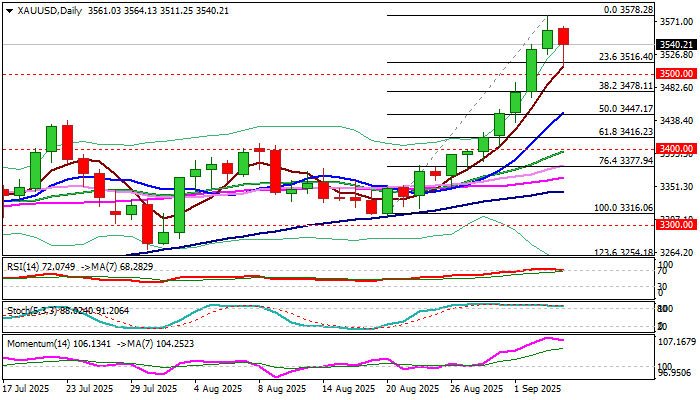
Gold edged lower in early Thursday on partial profit-taking from the steep rally in past seven days, which broke above $3500 and hit new record high at $3578, advancing over 7% from the Aug 20 higher low at $3310 and gaining around 2% on rally above $3500.
Gold was inflated by growing expectations for Fed rate cut this month, while political turmoil on the US over President Trump’s pressure on the central bank and the court questioning legality of US import tariffs, adding to uncertainty and boosting safe haven demand.
Markets await release of US NFP report, which is likely to seal the decision for rate cut, if August figures disappoint again, after reports in past few months showed sharp decline in hiring that points to weakening in the labor sector, one of four pillars of the economy.
The yellow metal has again entered uncharted territory after breach of previous peak ($3500) and came ticks ahead of next targets at $3589 (Fibo projection) and $3600 (round figure), where strongly overbought daily studies prompted traders to collect some profits.
Limited dips so far stayed above strong support at $3500, suggesting that bullish sentiment remains strong and traders look for better levels to re-enter strong bullish market for fresh acceleration higher.
Thursday’s daily candle was so far red (the first in eight days) but with long tail which signals still strong bids and contributes to scenario of positioning ahead of bullish continuation.
Next good supports below $3500 lay at $3452/38 (former tops) where extended dips should find firm ground and keep larger bulls in play.
Res: 3564; 3578; 3589; 3600
Sup: 3510; 3500; 3452; 3438
FTSE 100 Wave Analysis
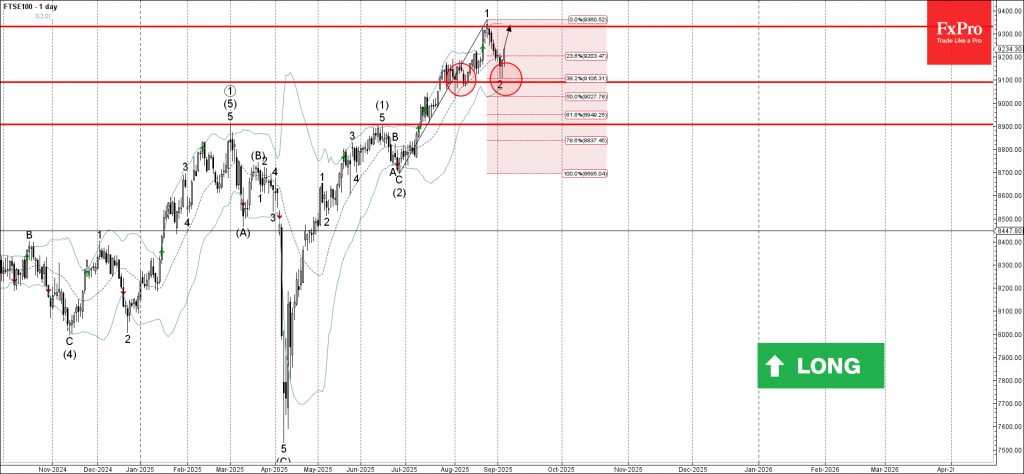
FTSE 100: ⬆️ Buy
- FTSE 100 reversed from support area
- Likely to rise to resistance level 9330.00
FTSE 100 Index recently reversed from the support area between the pivotal support level 9100.00 (which has been reversing the price from July), lower daily Bollinger Band and the 38.2% Fibonacci correction of the upward impulse from August.
The upward reversal from this support area created the daily Japanese candlesticks reversal pattern Hammer, which stopped the previous wave 2.
Given the overriding daily uptrend, FTSE 100 Index can be expected to rise to the next resistance level 9330.00 (which stopped the previous impulse wave 1).
Dow Jones Index Wave Analysis
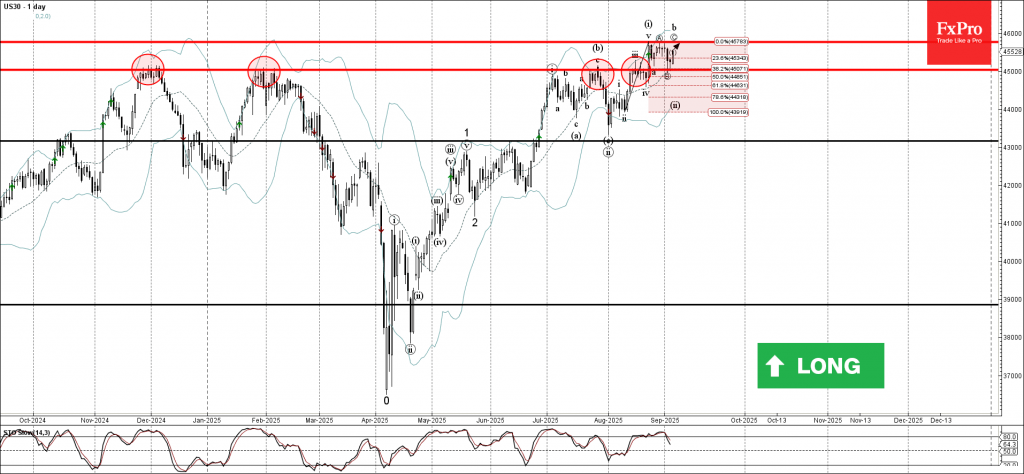
Dow Jones Index: ⬆️ Buy
- Dow Jones Index reversed from key support level 45000.00
- Likely to rise to resistance level 45765.00
Dow Jones Index recently reversed from the support area between the key support level 45000.00 (former strong resistance, which has been reversing the price from the end of 2024), 20-day moving average and the 38.2% Fibonacci correction of the upward impulse from August.
The upward reversal from this support area stopped the previous short-term correction ii.
Given the strong daily uptrend, Dow Jones Index can be expected to rise to the next resistance level 45765.00 (which reversed the Index in August).
BoE’s Bailey Unsure About Pace of Rate Cuts, Pound Eases
The British pound has edged lower on Thursday. In the North American session, GBP/USD is trading at 1.3177, down 0.19% on the day.
The pound has been busy and moved higher on Wednesday, with gains of 0.42%. This followed massive losses of 1.1% a day earlier, after UK gilts surged to a 27-year high.
Bank of England Governor Bailey testified before the Treasury Committee hearings on Wednesday. Bailey said that he expected interest rates would continue to move "downwards gradually over time" but that there was "considerably more doubt" as to when the BoE would lower rates.
Members of the BoE's Monetary Policy Committee are split over monetary policy. MPC member Alan Taylor, who joined Bailey at today's hearing, said he favors four or five rate cuts a year, a much more dovish stance than Bailey. Taylor also said that the UK economy was heading for a 'soft landing' but was fragile.
The BoE is stuck between a rock and a hard place, as the economy is weak and could use a rate cut, but inflation has accelerated and hit 3.8%, close to double the BoE's target of 2%. Last month, the BoE had to go through two rounds of voting before deciding to cut rates after a close 5-4 vote. The BoE meets next on September 18.
The US releases a key non-farm payroll report on Friday, ahead of the Fed meeting on September 17. The market estimate stands at 75 thousand, almost unchanged from the July gain of 73 thousand, which was well below expectations. Another weak reading would likely lead to voices calling for the Fed to deliver a jumbo half-point cut at the upcoming meeting.
GBP/USD Technical
- GBPUSD has pushed below support at 1.3441 and tested 1.3422 earlier. The next support level is 1.3404
- There is resistance at 1.3459 and 1.3478
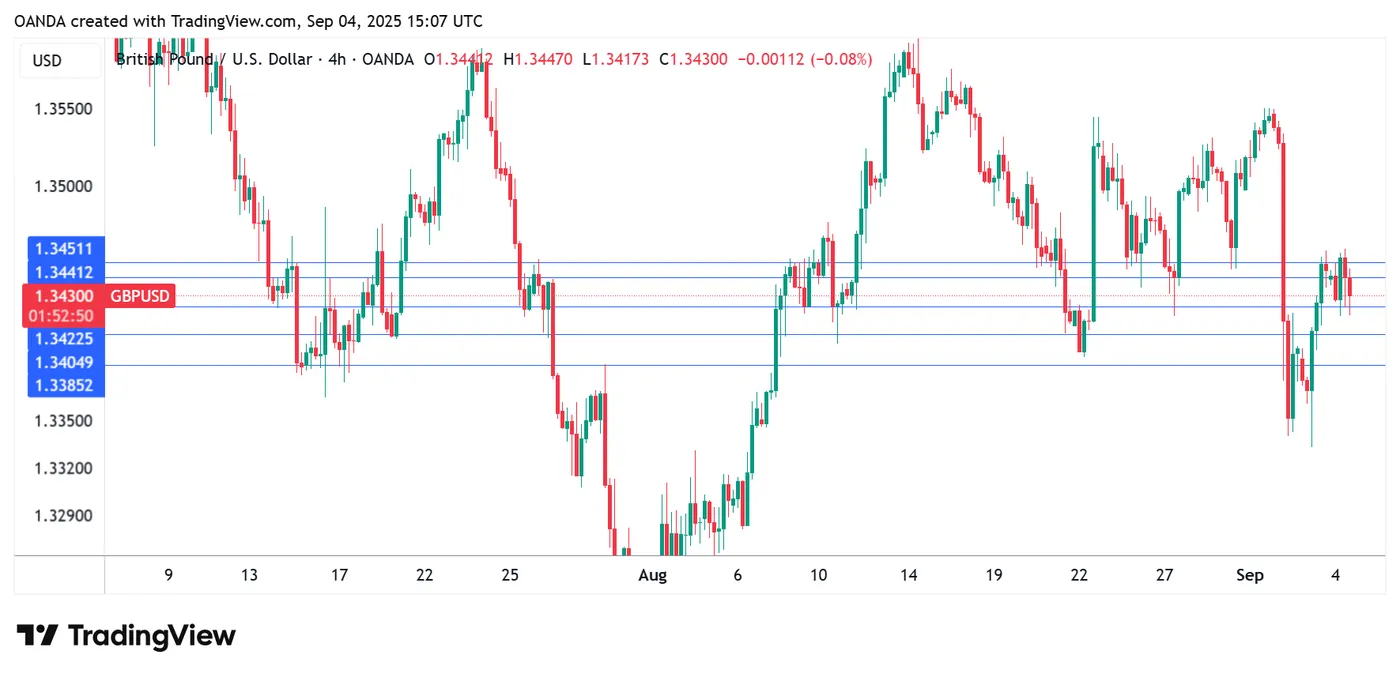
GBPUSD 4-Hour Chart, September 4, 2025