Sample Category Title
EUR/AUD Weekly Outlook
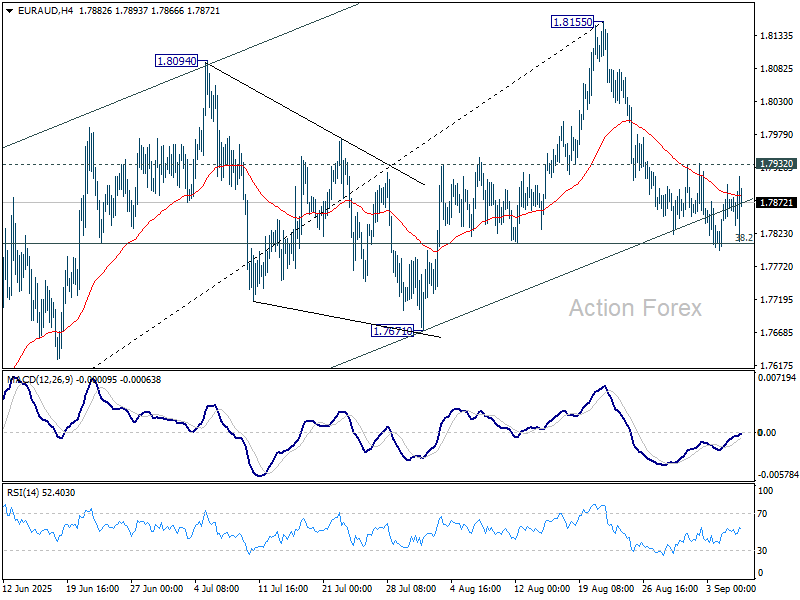
EUR/AUD breached 38.2% retracement of 1.7245 to 1.8155 at 1.7807 briefly last week but quickly recovered. Initial bias remains neutral this week first, and further fall is mildly in favor with 1.7932 minor resistance intact. On the downside, sustained trading below 1.7807 should confirm that whole rise from 1.7245 has completed. Corrective pattern from 1.8554 should then be in its third leg. Further decline should be seen to 61.8% retracement at 1.7593. On the upside, break of 1.7932 resistance will retain near term bullishness and bring retest of 1.8155 resistance instead.
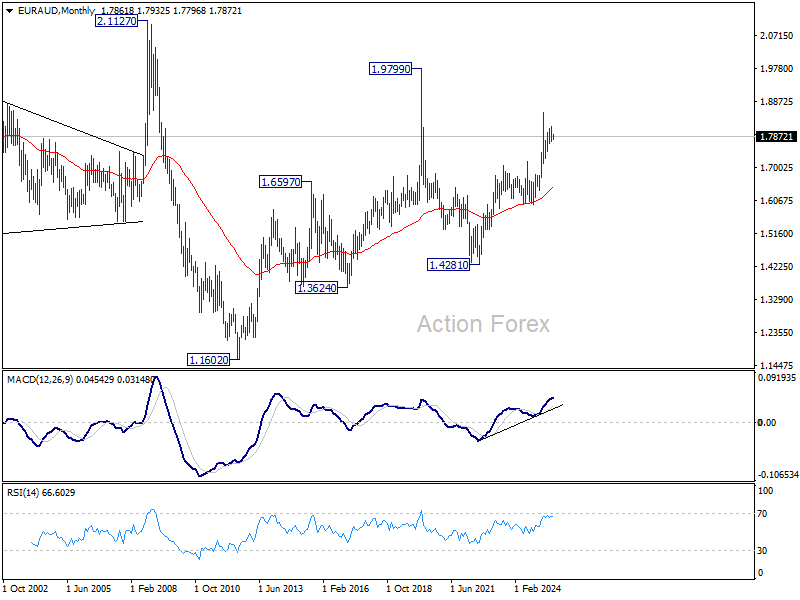
In the bigger picture, price actions from 1.8554 medium term top are seen as a corrective pattern. Such pattern could extend further with another falling leg. But even in that case, downside should be contained by 38.2% retracement of 1.4281 (2022 low) to 1.8554 at 1.6922 to bring rebound. Uptrend from 1.4281 is expected to resume at a later stage.

In the longer term picture, rise from 1.4281 is seen as the second leg of the pattern from 1.9799 (2020 high), which is part of the pattern from 2.1127 (2008 high). As long as 55 M EMA (now at 1.6464) holds, this second leg could still extend higher.

EUR/CHF Weekly Outlook
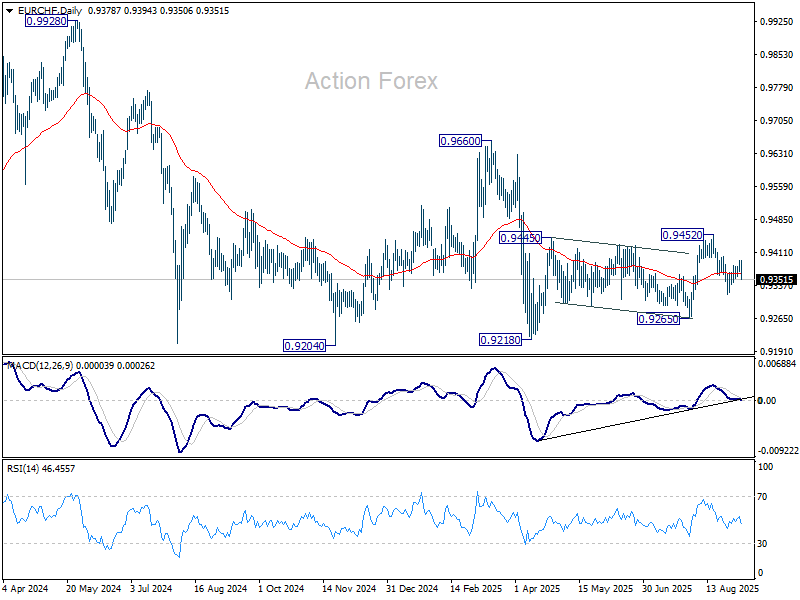
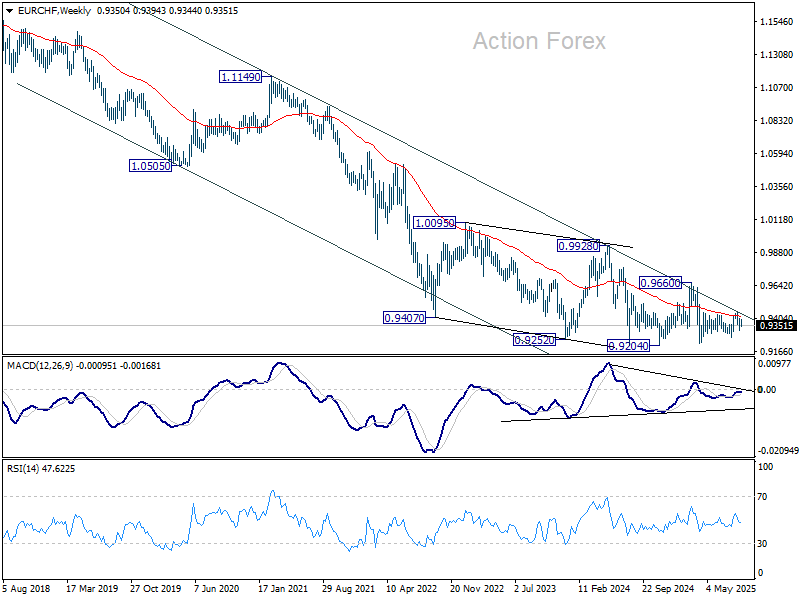
EUR/CHF recovered to 0.9394 last week but reversed from there. Late breach of 0.9352 minor support suggests the recovery has completed. Initial bias is back on the downside for retesting 0.9317 support. Also, outlook is unchanged that the corrective pattern from 0.9218 might have completed with three waves up to 0.9452 already. Break of 0.9317 will solidify this bearish case and target 0.9265 support, and then 0.9204 low. For now, risk will stay on the downside as long as 0.9394 resistance holds, in case of recovery.

In the bigger picture, the down trend from 0.9204 (2018 high) might still be in progress considering that EUR/CHF is staying well inside the long term falling channel. However, with bullish convergence condition in W MACD, downside potential should be limited in case of another fall. Instead, firm break of 0.9660 resistance will be an important sign of medium term bullish trend reversal.
In the long term picture, overall long term down trend is still in progress in EUR/CHF. Outlook will continue to stay bearish as long as 55 M EMA (now at 0.9857) holds.

The Weekly Bottom Line: Low Hiring, Low Firing… Lower Fed Funds Rate
Canadian Highlights
- July’s trade data poured some cold water on the idea that diversifying exports away from the U.S. would be anything short of a gargantuan task.
- With the trade shock reverberating, the Canadian labour market is struggling, with unemployment rising and 39,000 jobs lost since January.
- Ongoing trade disruptions and labour market slack are likely to keep inflation subdued, leaving room for two more Bank of Canada rate cuts this year.
U.S. Highlights
- Financial markets were volatile this week. Bonds and equities sold off at the start of the week only to reverse course later as soft labor market data started to trickle in.
- ISM manufacturing and non-manufacturing indexes moved higher on month, driven by gains in new orders, however, employment subcomponents remained in contractionary territory.
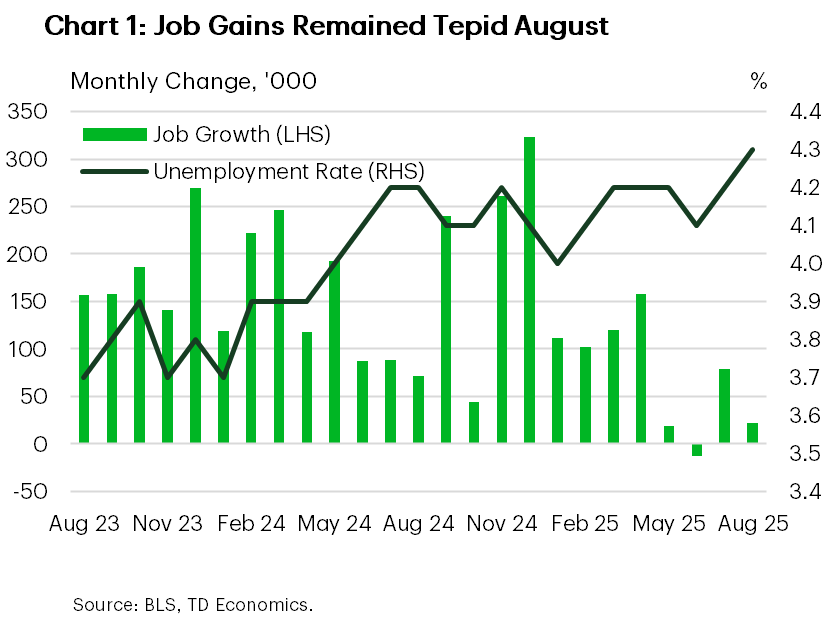
- The job market continued to lose momentum in August, with payrolls gains disappointing and downward revisions to prior months. The unemployment rate also rose to a new cycle high.
Canada – Tracing the Trade Shock
The labour day shortened week has been a wild ride, as concerns about fiscal pressures pushed U.S. bond yields higher to start the week, taking the rest of the world’s debt markets along with them. However, things have since sharply cooled off, as economic data have stoked growth worries. The Canadian 10-year yield is down to 3.28% - lower than where it finished last week. For Canada, this first week of September was an update on the ongoing effects of the generational disruptions with U.S. trade.
July’s trade update poured some cold water on the idea that diversifying trade away from the United States would be anything short of a gargantuan task. A jump in shipments to the U.S. offset a steep decline in exports to the rest of the world. The monthly move is good news, but the scale of the ongoing disruption is pronounced (Chart 1). Total goods export volumes are down 4% year-on-year, to levels last seen in mid-2022. Importantly, after the shock in the second quarter, July’s print looks more like a blip, rather than the start of a new trend.
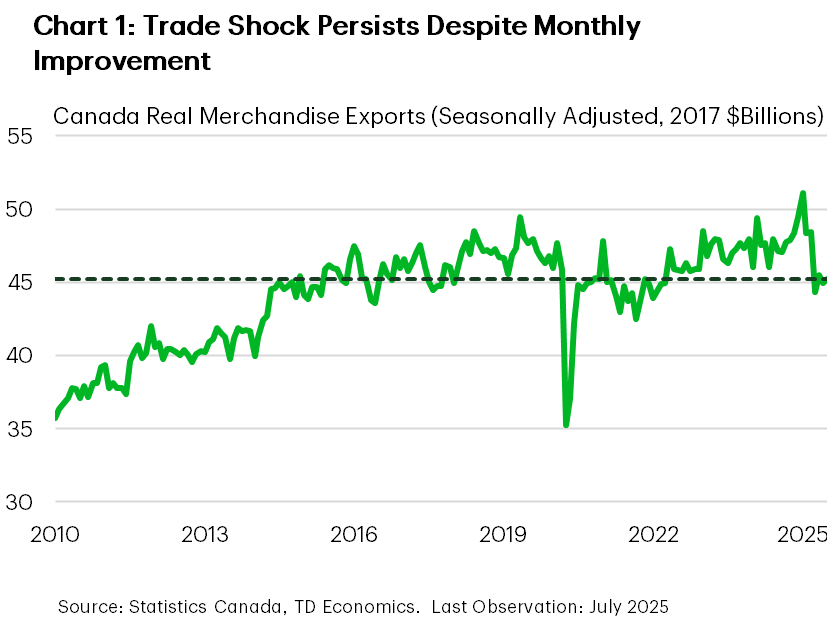
Looking forward, Canadian exporters continue to enjoy a relative tariff advantage in the U.S. market compared to most countries. Of the goods crossing the border, many continue to enter duty free. However, progress on trade discussions with the U.S. administration has been slow. Together with the relative tariff advantage, this suggest that relief may yet be a ways away.
Friday’s Labour Force Survey report reaffirmed the scale of the disruption underway. The unemployment rate rose to 7.1%, while the labour market lost roughly 100k jobs in July and August. Overall, the country’s job market has flat lined in 2025 (Chart 2), shedding 39k jobs since January. With growth expected to linger below trend through 2025 we expect the unemployment rate to continue to rise in the coming months.
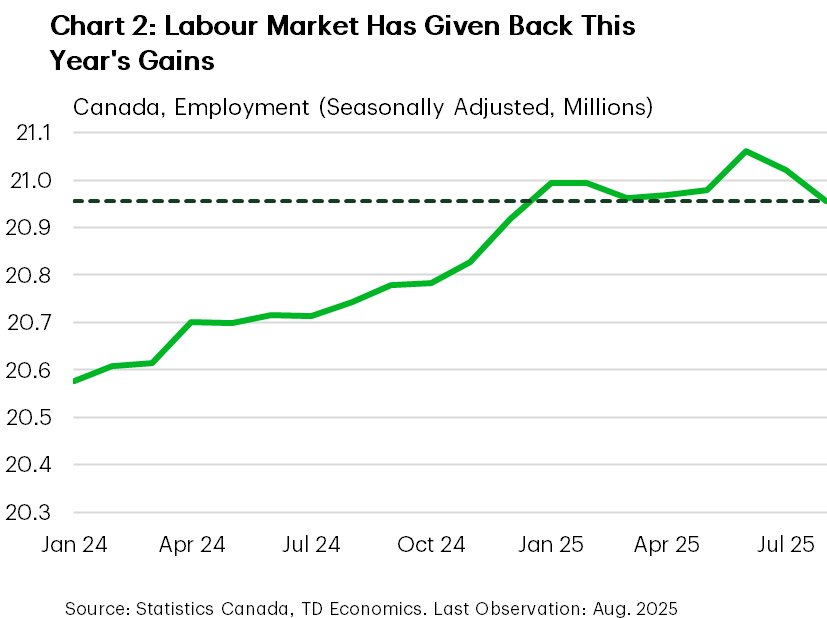
However, it’s not all doom and gloom. While there are significant challenges, the slowdown in population growth means there is limited scope for the unemployment rate to rise. With fewer people on the sidelines of the labour market, excess capacity won’t be able to rise as high as would have otherwise been expected. The federal government is also expected to prioritize infrastructure projects “of national interest”, some of which should help facilitate more global trade, in its budget expected next month. Moreover, the housing market appears on a path to a modest recovery, with home sales rising from April through July.
The Bank of Canada is focused on managing inflation, and the balance between the inflationary impacts of tariffs and the building slack in the economy is critical. From our lens, the labour market will continue to face headwinds as the trade shock reverberates. A moderate recovery in domestic demand is unlikely to absorb the accumulated slack, putting downward pressure on inflation. This reinforces our view that the BoC will be able to deliver two more cuts this year.
U.S. – Low Hiring, Low Firing… Lower Fed Funds Rate
This was a short but volatile week in financial markets. Earlier in the week, equities and bonds sold off amid growing concerns about the long-term sustainability of government debt in the U.S. and other developed nations. These concerns stemmed from increased borrowing needs and reduced demand for government bonds, particularly from central banks. Long-dated bonds were particularly under pressure, with the gap between 30-year and 10-year Treasuries rising to 0.7 percentage points—the highest since 2021.
In the U.S., fears were amplified by questions around the Federal Reserve’s independence and inflation risks linked to tariffs. Adding to the fiscal alarm was a court ruling that IEEPA tariffs were imposed illegally. The case now heads to the Supreme Court, and if the decision stands, it could jeopardize this revenue stream and leave the government liable for billions in refunds.
However, sentiment reversed on Wednesday, with bond yields falling and equities rising. It was a classic case of “bad news is good news,” as softer-than-expected economic data – namely the lower job openings in the JOLTS report – boosted expectations of more aggressive rate cuts from the Fed. Given last month’s downward payroll revisions and modest job gains, investors were already on alert for signs of ongoing labor market weakness ahead of Friday’s payroll report. They didn’t have to look too hard.
August’s payroll report confirmed that the labor market is softening quite quickly (Chart 1). Job growth was well below expectations in August, with just 22k new jobs added, and has averaged only 29k over the past three months. Goods-producing industries, especially those exposed to tariffs, continued to shed jobs for a fourth straight month. Government employment also declined. The services sector added 63k jobs, but gains were not broad-based. Education & health added 46k jobs and 28k were in leisure & hospitality. While employers are not rushing to hire, they aren’t cutting jobs en masse either. Still, the jobless rate edged up to 4.3% from 4.2% the prior month, reaching a new post-pandemic cyclical high.
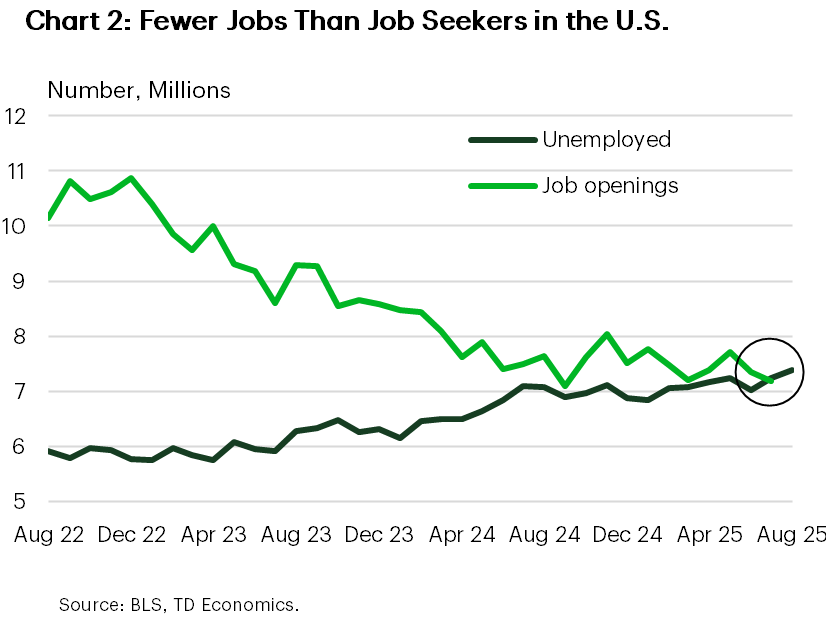
Playing second fiddle to the payrolls number, the July JOLTS data also surprised with weaker-than-expected job openings, which declined to 7.18 million from 7.36 million. Openings also fell below the number of unemployed for the first time since 2021—though the margin has been narrow since mid-2024 (Chart 2). Quits and layoffs were little changed, suggesting the economy remains in a “low hiring, low firing” state.
Fed officials have recently become more concerned about the downside risks to the labor market, and the August payrolls report shows these concerns are valid. As such, we maintain our view that the Federal Reserve would need to deliver 75 basis points in rate-relief this year, with the first one coming in less than two weeks.
Weekly Economic & Financial Commentary: The Global Economic Impact of a U.S.-China Bipolar World
Summary
United States: Hiring Slows to a Crawl
- The U.S. economy added jobs at a remarkably slow clip in August, telling us many are already feeling the negative effects of a moderating jobs market and providing further support that the FOMC will elect to reduce rates at its upcoming meeting on Sept. 17. While underlying activity continued through August, tariff-induced cost pressure is materializing, challenging purchasing managers across manufacturing and services industries.
- Next week: NFIB Small Business Optimism (Mon.), CPI (Thu.)
International: Foreign Economies Show Some Resilience, with Inflation Trends Generally Benign
- This week's global growth data were encouraging on balance, as China's August PMIs improved, Australia's GDP showed increased momentum and Brazil's Q2 GDP surprised to the upside. An unexpected fall in Canada's August employment was the key exception to the favorable growth trends. Meanwhile, inflation figures were reasonably benign overall from the Eurozone, Switzerland and Sweden, with the latter likely, in our view, to prompt Sweden's central bank to lower its policy rate by 25 bps later this month.
- Next week: Mexico CPI (Tue.), European Central Bank Rate Decision (Thu.), U.K. Monthly GDP (Fri.)
Credit Market Insights: Consumer Caution
- The Beige Book, which is published eight times a year, provides a qualitative review of economic conditions and activity from the 12 Federal Reserve districts. In the most recent report covering mid-July to August, a majority of the districts reported little to no change in economic activity from the prior period. While the economy remains resilient, all districts report that consumers are feeling the squeeze.
Topic of the Week: The Global Economic Impact of a U.S.-China Bipolar World
- With the U.S. and China on opposite sides of the economic and geopolitical spectrum, countries around the world will have to pick a side: Align with the U.S. or align with China. This fragmentation, which is driving a second era of deglobalization, could cause downward pressure on global growth.
Canadian Household Wealth Likely Grew While U.S. Inflation Expected to Rise
National balance sheet accounts data for Q2 on Thursday should show Canadian household net worth edged higher with a rebound in equity markets boosting financial asset values in a quiet week for Canadian data releases.
The S&P/TSX Composite Index climbed 7.8% following a weak Q1. However, part of this growth will likely be offset by declining property values. CREA’s MLS Home Price Index slipped by 1.2%, reversing gains from the previous quarter. The debt service ratio also likely increased modestly in Q2 amid growth in both household mortgage and non-mortgage loans.
Building permits data on Friday for July will also be watched for signs of resilience persisting in homebuilding nationally. But, permits have trended lower since February, and relative strength in national housing starts has reflected significant regional divergences with substantial underperformance in Ontario.
Last inflation reading before Fed decision
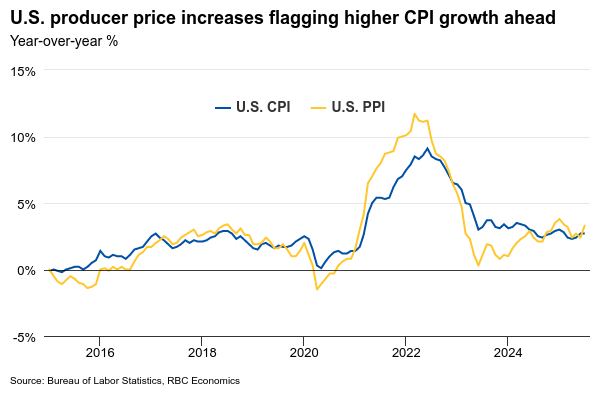
In the U.S., the focus will shift to the consumer price index report for August ahead of September’s FOMC meeting. It follows August employment numbers that largely confirmed labour markets are cooling. We forecast headline inflation to rise to 3% year-over-year, up from 2.7% in July, driven largely by higher gasoline prices (2% month-over-month), and food prices flagged by earlier increases in producer prices.
Core price growth excluding those components is also expected to remain elevated. We expect a 0.4% month-over-month increase that would be the largest since January, and second largest in almost two years. Trade-sensitive categories such as autos, household furnishings, and recreational goods will be watched closely for further evidence on whether the impact of tariffs is becoming more pronounced.
As we highlighted previously, the timing of tariffs passing through depends on factors such as inventory levels and the degree to which businesses absorb or pass on added costs. As inventory buffers continue to erode, we see the effects of tariffs increasingly reflected in producer prices with the potential to spill over into broader inflation metrics in the months ahead.

Summary 9/8 – 9/12
Monday, Sep 8, 2025
| GMT | Ccy | Events | Consensus | Previous |
|---|---|---|---|---|
| 23:50 | JPY | Bank Lending Y/Y Aug | 3.20% | 3.20% |
| 23:50 | JPY | GDP Q/Q Q2 F | 0.30% | 0.30% |
| 23:50 | JPY | GDP Deflator Y/Y Q2 F | 3.00% | 3.00% |
| 23:50 | JPY | Current Account (JPY) Jul | 2.60T | 2.40T |
| 03:00 | CNY | Trade Balance (USD) Aug | 99.4B | 98.2B |
| 05:00 | JPY | Eco Watchers Survey: Current Aug | 45.7 | 45.2 |
| 06:00 | EUR | Germany Industrial Production M/M Jul | 1.30% | -1.90% |
| 06:00 | EUR | Germany Trade Balance (EUR)Jul | 15.3B | 14.9B |
| 08:30 | EUR | Eurozone Sentix Investor Confidence Sep | -1.1 | -3.7 |
| 22:45 | NZD | Manufacturing Sales Q2 | 5.10% | |
| 23:50 | JPY | Money Supply M2+CD Y/Y Aug | 1.10% | 1.00% |
| GMT | Ccy | Events | |
|---|---|---|---|
| 23:50 | JPY | Bank Lending Y/Y Aug | |
| Forecast: 3.20% | Previous: 3.20% | ||
| 23:50 | JPY | GDP Q/Q Q2 F | |
| Forecast: 0.30% | Previous: 0.30% | ||
| 23:50 | JPY | GDP Deflator Y/Y Q2 F | |
| Forecast: 3.00% | Previous: 3.00% | ||
| 23:50 | JPY | Current Account (JPY) Jul | |
| Forecast: 2.60T | Previous: 2.40T | ||
| 03:00 | CNY | Trade Balance (USD) Aug | |
| Forecast: 99.4B | Previous: 98.2B | ||
| 05:00 | JPY | Eco Watchers Survey: Current Aug | |
| Forecast: 45.7 | Previous: 45.2 | ||
| 06:00 | EUR | Germany Industrial Production M/M Jul | |
| Forecast: 1.30% | Previous: -1.90% | ||
| 06:00 | EUR | Germany Trade Balance (EUR)Jul | |
| Forecast: 15.3B | Previous: 14.9B | ||
| 08:30 | EUR | Eurozone Sentix Investor Confidence Sep | |
| Forecast: -1.1 | Previous: -3.7 | ||
| 22:45 | NZD | Manufacturing Sales Q2 | |
| Forecast: | Previous: 5.10% | ||
| 23:50 | JPY | Money Supply M2+CD Y/Y Aug | |
| Forecast: 1.10% | Previous: 1.00% | ||
Tuesday, Sep 9, 2025
| GMT | Ccy | Events | Consensus | Previous |
|---|---|---|---|---|
| 00:30 | AUD | Westpac Consumer Confidence Sep | 5.70% | |
| 01:30 | AUD | NAB Business Conditions Aug | 5 | |
| 01:30 | AUD | NAB Business Confidence Aug | 7 | |
| 06:00 | JPY | Machine Tool Orders Y/Y Aug F | 3.60% | |
| 06:45 | EUR | France Industrial Output M/M Jul | -1.20% | 3.80% |
| 10:00 | USD | NFIB Business Optimism Index Aug | 101 | 100.3 |
| GMT | Ccy | Events | |
|---|---|---|---|
| 00:30 | AUD | Westpac Consumer Confidence Sep | |
| Forecast: | Previous: 5.70% | ||
| 01:30 | AUD | NAB Business Conditions Aug | |
| Forecast: | Previous: 5 | ||
| 01:30 | AUD | NAB Business Confidence Aug | |
| Forecast: | Previous: 7 | ||
| 06:00 | JPY | Machine Tool Orders Y/Y Aug F | |
| Forecast: | Previous: 3.60% | ||
| 06:45 | EUR | France Industrial Output M/M Jul | |
| Forecast: -1.20% | Previous: 3.80% | ||
| 10:00 | USD | NFIB Business Optimism Index Aug | |
| Forecast: 101 | Previous: 100.3 | ||
Wednesday, Sep 10, 2025
| GMT | Ccy | Events | Consensus | Previous |
|---|---|---|---|---|
| 01:30 | CNY | CPI Y/Y Aug | -0.20% | 0.00% |
| 01:30 | CNY | PPI Y/Y Aug | -2.90% | -3.60% |
| 12:30 | USD | PPI M/M Aug | 0.30% | 0.90% |
| 12:30 | USD | PPI Y/Y Aug | 3.30% | |
| 12:30 | USD | PPI Core M/M Aug | 0.30% | 0.90% |
| 12:30 | USD | PPI Core Y/Y Aug | 3.70% | |
| 14:00 | USD | Wholele Inventories Jul F | 0.20% | 0.20% |
| 14:30 | USD | Crude Oil Inventories (Sep 5) | 2.4M | |
| 23:01 | GBP | RICS Housing Price Balance Aug | -10% | -13% |
| 23:50 | JPY | PPI Y/Y Aug | 2.70% | 2.60% |
| 23:50 | JPY | BSI Large Manufacturing Index Q3 | -3.3 | -4.8 |
| GMT | Ccy | Events | |
|---|---|---|---|
| 01:30 | CNY | CPI Y/Y Aug | |
| Forecast: -0.20% | Previous: 0.00% | ||
| 01:30 | CNY | PPI Y/Y Aug | |
| Forecast: -2.90% | Previous: -3.60% | ||
| 12:30 | USD | PPI M/M Aug | |
| Forecast: 0.30% | Previous: 0.90% | ||
| 12:30 | USD | PPI Y/Y Aug | |
| Forecast: | Previous: 3.30% | ||
| 12:30 | USD | PPI Core M/M Aug | |
| Forecast: 0.30% | Previous: 0.90% | ||
| 12:30 | USD | PPI Core Y/Y Aug | |
| Forecast: | Previous: 3.70% | ||
| 14:00 | USD | Wholele Inventories Jul F | |
| Forecast: 0.20% | Previous: 0.20% | ||
| 14:30 | USD | Crude Oil Inventories (Sep 5) | |
| Forecast: | Previous: 2.4M | ||
| 23:01 | GBP | RICS Housing Price Balance Aug | |
| Forecast: -10% | Previous: -13% | ||
| 23:50 | JPY | PPI Y/Y Aug | |
| Forecast: 2.70% | Previous: 2.60% | ||
| 23:50 | JPY | BSI Large Manufacturing Index Q3 | |
| Forecast: -3.3 | Previous: -4.8 | ||
Thursday, Sep 11, 2025
| GMT | Ccy | Events | Consensus | Previous |
|---|---|---|---|---|
| 12:15 | EUR | ECB Rate On Deposit Facility | 2.00% | 2.00% |
| 12:15 | EUR | ECB Main Refinancing Rate | 2.15% | 2.15% |
| 12:30 | USD | Initial Jobless Claims (Sep 5) | 240K | 237K |
| 12:30 | USD | CPI M/M Aug | 0.30% | 0.20% |
| 12:30 | USD | CPI Y/Y Aug | 2.90% | 2.70% |
| 12:30 | USD | CPI Core M/M Aug | 0.30% | 0.30% |
| 12:30 | USD | CPI Core Y/Y Aug | 3.10% | 3.10% |
| 12:45 | EUR | ECB Press Conference | ||
| 14:30 | USD | Natural Gas Storage (Sep 5) | 66B | 55B |
| 22:30 | NZD | BusinessNZ PMI Aug | 52.8 |
| GMT | Ccy | Events | |
|---|---|---|---|
| 12:15 | EUR | ECB Rate On Deposit Facility | |
| Forecast: 2.00% | Previous: 2.00% | ||
| 12:15 | EUR | ECB Main Refinancing Rate | |
| Forecast: 2.15% | Previous: 2.15% | ||
| 12:30 | USD | Initial Jobless Claims (Sep 5) | |
| Forecast: 240K | Previous: 237K | ||
| 12:30 | USD | CPI M/M Aug | |
| Forecast: 0.30% | Previous: 0.20% | ||
| 12:30 | USD | CPI Y/Y Aug | |
| Forecast: 2.90% | Previous: 2.70% | ||
| 12:30 | USD | CPI Core M/M Aug | |
| Forecast: 0.30% | Previous: 0.30% | ||
| 12:30 | USD | CPI Core Y/Y Aug | |
| Forecast: 3.10% | Previous: 3.10% | ||
| 12:45 | EUR | ECB Press Conference | |
| Forecast: | Previous: | ||
| 14:30 | USD | Natural Gas Storage (Sep 5) | |
| Forecast: 66B | Previous: 55B | ||
| 22:30 | NZD | BusinessNZ PMI Aug | |
| Forecast: | Previous: 52.8 | ||
Friday, Sep 12, 2025
| GMT | Ccy | Events | Consensus | Previous |
|---|---|---|---|---|
| 04:30 | JPY | Industrial Production M/M Jul F | -1.60% | -1.60% |
| 06:00 | EUR | Germany CPI M/M Aug F | 0.10% | 0.10% |
| 06:00 | EUR | Germany CPI Y/Y Aug F | 2.10% | 2.10% |
| 06:00 | GBP | GDP M/M Jul | 0.00% | 0.40% |
| 06:00 | GBP | Manufacturing Production M/M Jul | 0.00% | 0.50% |
| 06:00 | GBP | Manufacturing Production Y/Y Jul | 0.00% | |
| 06:00 | GBP | Industrial Production M/M Jul | 0.00% | 0.70% |
| 06:00 | GBP | Industrial Production Y/Y Jul | 0.20% | |
| 06:00 | GBP | Goods Trade Balance (GBP) Jul | -21.5B | -22.2B |
| 12:30 | CAD | Building Permits M/M Jul | -9.00% | |
| 12:30 | CAD | Capacity Utilization Q2 | 78.90% | 80.10% |
| 14:00 | USD | UoM Consumer Sentiment Sep P | 59.4 | 58.2 |
| 14:00 | USD | UoM 1-Yr Inflation Expectations Sep P | 4.80% |
| GMT | Ccy | Events | |
|---|---|---|---|
| 04:30 | JPY | Industrial Production M/M Jul F | |
| Forecast: -1.60% | Previous: -1.60% | ||
| 06:00 | EUR | Germany CPI M/M Aug F | |
| Forecast: 0.10% | Previous: 0.10% | ||
| 06:00 | EUR | Germany CPI Y/Y Aug F | |
| Forecast: 2.10% | Previous: 2.10% | ||
| 06:00 | GBP | GDP M/M Jul | |
| Forecast: 0.00% | Previous: 0.40% | ||
| 06:00 | GBP | Manufacturing Production M/M Jul | |
| Forecast: 0.00% | Previous: 0.50% | ||
| 06:00 | GBP | Manufacturing Production Y/Y Jul | |
| Forecast: | Previous: 0.00% | ||
| 06:00 | GBP | Industrial Production M/M Jul | |
| Forecast: 0.00% | Previous: 0.70% | ||
| 06:00 | GBP | Industrial Production Y/Y Jul | |
| Forecast: | Previous: 0.20% | ||
| 06:00 | GBP | Goods Trade Balance (GBP) Jul | |
| Forecast: -21.5B | Previous: -22.2B | ||
| 12:30 | CAD | Building Permits M/M Jul | |
| Forecast: | Previous: -9.00% | ||
| 12:30 | CAD | Capacity Utilization Q2 | |
| Forecast: 78.90% | Previous: 80.10% | ||
| 14:00 | USD | UoM Consumer Sentiment Sep P | |
| Forecast: 59.4 | Previous: 58.2 | ||
| 14:00 | USD | UoM 1-Yr Inflation Expectations Sep P | |
| Forecast: | Previous: 4.80% | ||
US August CPI Preview: Firmer Trend to Stick Around
Summary
The July CPI indicated that tariffs are not the only challenge to the Fed finishing its fight against inflation. Sticky services inflation alongside the rebound in goods prices has stymied the disinflationary trend of the past two years and pushed inflation further from the FOMC's target. We expect the firmer trend to continue in August and look for the core CPI to rise another 0.3%, keeping the year-over-year rate at 3.1%. A pickup in food and energy prices should support the headline CPI as well, which we forecast to rise 0.3% over the month and 2.9% relative to a year ago.
Further ahead, we suspect higher tariff rates are here to stay as the administration has authority to increase customs duties beyond the International Emergency Economic Powers Act currently under legal scrutiny. The spillovers from stronger goods inflation to services inflation should remain limited, however. Physical inputs are only a small portion of service firms' overall costs, the jobs market continues to soften and inflation expectations remain generally anchored. We expect the core CPI and PCE to run around a 3% annualized pace over the next six months or so before resuming its downward trend in the spring of next year.

Inflation Keeping the Fed in an Uncomfortable Place
The July CPI offered further evidence of the difficult road ahead for the Federal Reserve. Core inflation quickened with broad-based strength across goods and services, illustrating that tariffs are not the only forces keeping inflation sticky. We expect the firmer trend to continue in August and look for the core CPI to rise another 0.3%, keeping the year-over-year rate at 3.1% (Figure 1). A pickup in food and energy prices should support the headline CPI as well, which we forecast to rise 0.3% over the month and 2.9% relative to a year ago.

The burst of inventory front-running in the first quarter has allowed businesses to gradually adjust selling prices as they await to see where tariff rates ultimately land and avoid alienating consumers in the meantime. Yet, as stockpiles have dwindled, merchandise imports have started to rebound with U.S. firms seeing steep increases in customs' bills. Year-to-date, tariff revenues are up $94 billion, or about 150% from this point last year (Figure 2). The rising cost burden has been highlighted in earnings calls, our conversations with clients and within the Federal Reserve's latest Beige Book, and leads us to expect further strength in goods inflation in the months ahead.

We look for core goods prices to rise 0.25% in August, marginally stronger than last month's increase. New vehicle inflation, which has been tame, is poised to strengthen as a rebound in auto sales has helped to reduce inventory and the use of incentives has slowed. Price growth for other import-heavy items, such as apparel, recreational goods and communication hardware, should remain solid as well with another 0.3% increase. The further pickup in core goods prices is expected to push the year-over-year rate up to 1.5% in August, which would be its highest since May 2023.
Slower services inflation helped to counteract the upward pressure from stronger goods inflation over the first half of the year. We suspect the offset is now fading and look for core services prices to rise 0.30% in August. Travel-related service prices started to rebound in July, and we estimate another solid gain in August (+1.0%), led by lodging away from home. While spending on discretionary services remains generally weak, consumers' appetite for travel shows signs of rebounding with hotel occupancy and TSA screenings up again on a year-ago basis, suggestive of some stabilization in consumer demand.
Elsewhere, medical care services inflation appears due for a moderation after posting its largest increase in nearly three years in July. Forward-looking measures of rent growth suggest primary shelter inflation should run a touch under its 0.31% year-to-date average through the remainder of 2025, which will allow the year-over-year rate to gradually recede to 3.6% by December (Figure 3). Meantime, ongoing softening in the labor market is likely to limit upward pressure on wage growth, which we expect to help keep a lid on personal services inflation as well.

Looking further ahead, we suspect higher tariff rates are here to stay even if the use of the International Emergency Economic Powers Act (IEEPA) to institute "reciprocal" rates is not held up in court. There are other avenues the administration can pursue to levy tariffs on the legal grounds of national security (Section 232), unfair trade practices (Section 301) and serious trade deficits (Section 122). A shift from country-focused to product-focused duties will further complicate the supply chain adjustment process, but keep price pressures turned up.

We still expect spillovers into services to be limited, however (Figure 4). While services PMIs show a significant net share of services firms report higher input costs, physical inputs are a small portion of overall costs. More important for services inflation is the ongoing softening in labor conditions, which is helping to slow compensation growth. That said, real incomes continue to rise, preventing a collapse in demand and making additional disinflation in the service sector slow-going (Figure 5). We thus continue to expect the core CPI and PCE to run around a 3% annualized pace over the next six months or so before resuming its downward trend in the spring of next year.

Week Ahead – US CPI and ECB Meeting to Test Market Nerves
- US CPI and PPI data to take centre stage ahead of Fed decision.
- ECB to likely hold rates, might signal long pause.
- OPEC decision and Chinese data to shape sentiment at start of week.
- Bond markets on alert for Treasury auctions and French budget vote.
US inflation data eyed before September FOMC
A 25-basis-point rate cut at the Fed’s September gathering is a near certainty. What there is less certainty about is the pace of cuts thereafter, while some market pundits are betting on a surprise 50-bps cut on September 17. In his keynote address at Jackson Hole, Fed Chair Jerome Powell indicated that the downside risks to employment could be becoming greater than the upside risks to inflation, warranting a shift in the policy stance.
However, whilst the balance of risks is undoubtedly tilting, it’s not clear how fast the labour market is slowing and what the full scale of impact of the higher tariffs will be on prices. So, the picture formed over the next few months from the incoming employment and inflation reports will be crucial for how quickly the Fed removes policy restriction.
For the September meeting, both Wednesday’s producer price index (PPI) and Thursday’s consumer price (CPI) index will be important in influencing the new dot plot, even if policymakers don’t add too much weight on them for the decision itself.
PPI, which measures the price of goods leaving factories, is considered to be somewhat more forward looking than CPI. Hence, as seen for the July numbers, if there’s another bigger-than-expected increase in August PPI, investors could pare back some of their more dovish expectations for Fed rate cuts.
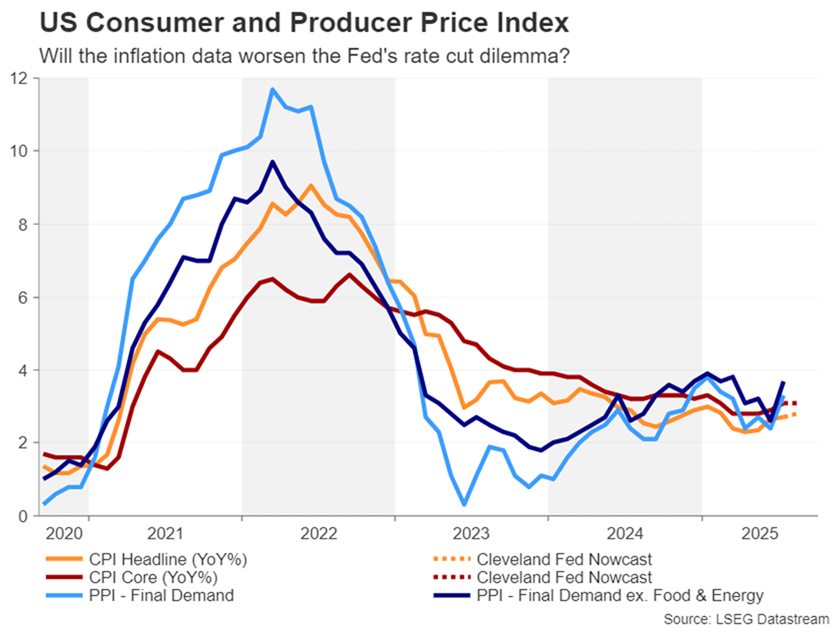
For now, however, the tariff effect on goods prices appears to be modest, and potentially a bigger headache for the Fed is the recent pickup in services inflation. According to the Cleveland Fed’s Nowcast model, headline CPI is estimated to have edged up 0.1 percentage points to 2.8% y/y in August, while core CPI likely stayed unchanged at 3.1% y/y.
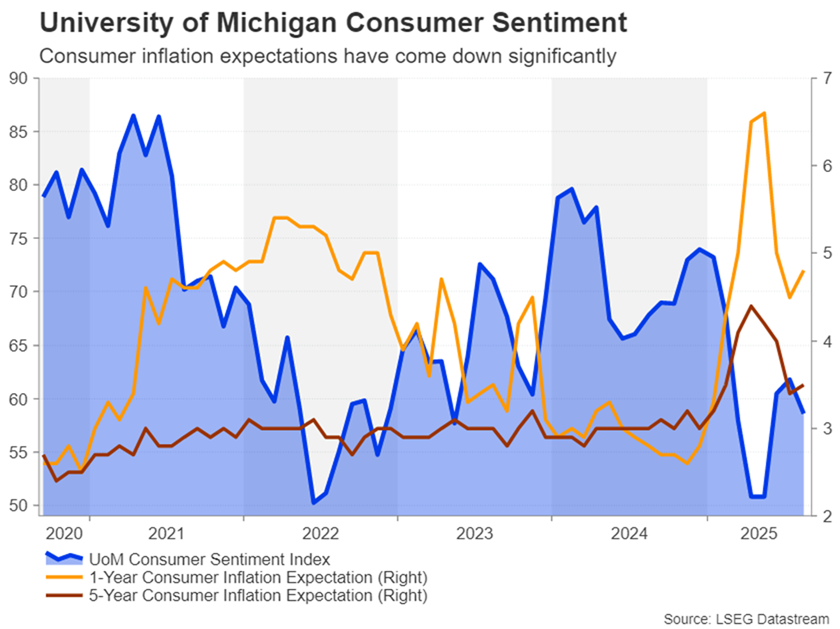
Also on investors’ radar is the preliminary consumer sentiment survey by the University of Michigan on Friday. Consumer inflation expectations turned higher in the August survey, after falling sharply in the prior months. If they continue to rise in September, this would not be a very encouraging sign.
Should the overall evidence on inflation not be very supportive of rate cuts, this could again lead to a steepening of the US yield curve, whereby short-term yields decline on the expectation of lower rates soon but longer-term yields rise on worries that inflation will spiral out of control in the future.
Further pressuring long-term bonds recently are the concerns about unsustainable budget deficits, not just in the United States, but in several advanced economies such as Japan, France and the United Kingdom. The US 30-year yield briefly spiked to a one-and-a-half-month high in the past week amid a global bond rout. There could be further volatility over the coming week as the US Treasury is scheduled to auction three-, 10- and 30-year notes.
ECB set to stay on pause
The European Central Bank is widely anticipated to maintain its deposit rate at 2.0% on Thursday when it concludes its two-day monetary policy meeting. With inflation at or close to its 2.0% target since the spring, the ECB can afford to adopt a wait-and-see stance, especially now that the immediate threat of the trade war has dissipated following the EU-US trade deal.
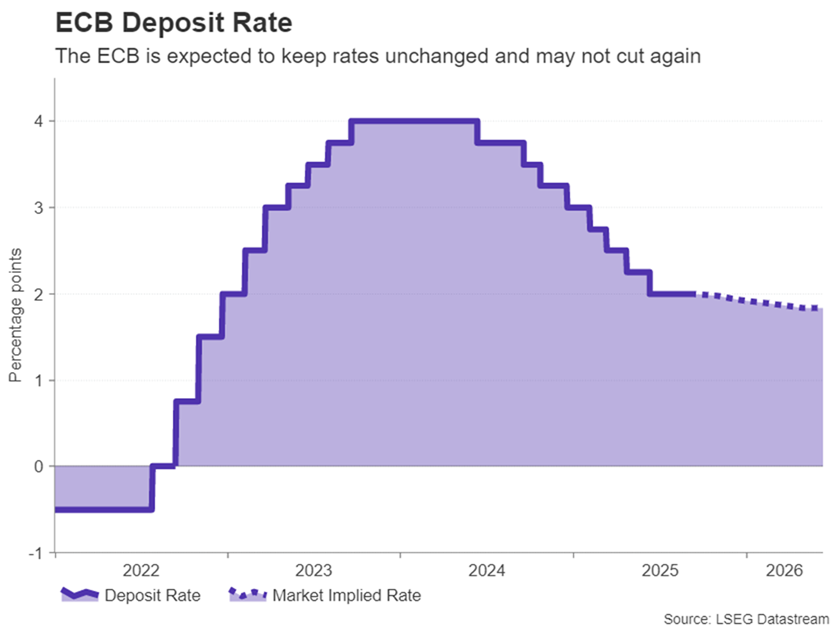
Policymakers appear to be split on whether or not interest rates will need to be cut again. A couple of policymakers – Schnabel and Dolenc – have warned that the next move could be up, while others, such as Olli Rehn, think that inflation could surprise to the downside.
President Christine Lagarde will probably try to strike a neutral tone in her press conference and may refrain from commenting on future policy. However, any hints that the ECB could stay on hold for the rest of the year would probably be viewed as slightly hawkish by the markets, as it would validate the current expectations that a final rate cut may not come before the middle of next year.
Lagarde will also be likely quizzed about the recent spike in Eurozone bond yields amid the jitters about mounting national debt levels. Whilst these concerns have been lingering in the background for some time, they’ve been fuelled lately by the increased political risks in France and Japan, and the UK government’s reluctance to carry out meaningful spending reforms.
Is France headed for a new political crisis?
For now, there doesn’t seem to be much danger of contagion beyond France as far as the Eurozone is concerned, and the direct hit on the euro has been minimal. However, it may not stay that way if the French government loses a confidence vote in parliament on Monday. Lawmakers will decide if they want to approve Prime Minister Francois Bayrou’s budget for 2026, which includes spending cuts of almost $44 billion.
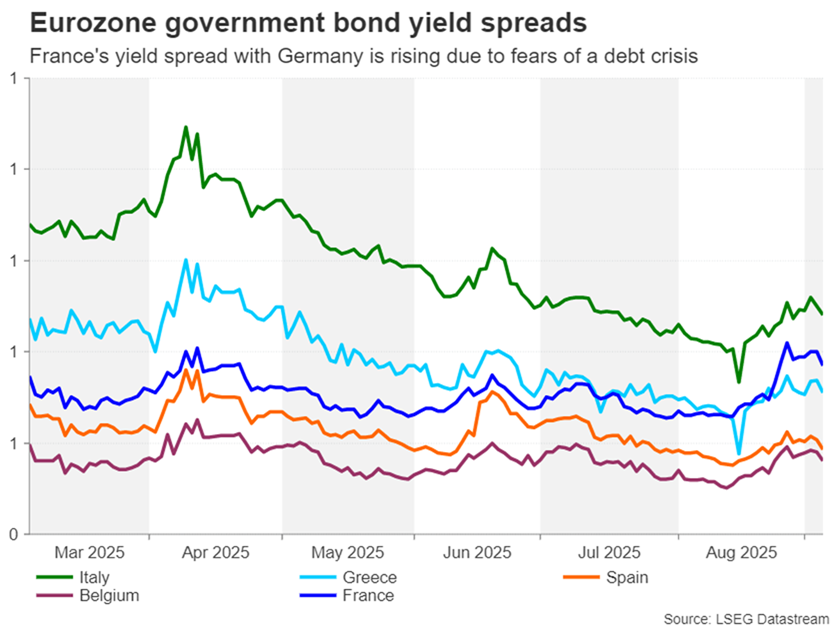
Rejecting it could lead to a snap election, raising the risk that the next government won’t be as tough tackling the deficit, which stood at 5.8% of GDP in 2024. Over the past year, France’s 10-year yield spread with German bunds has widened to above those of Spain and Greece and is approaching Italy’s. A fresh political crisis runs the risk of pushing the spread even higher and sparking a selloff in the euro.
Pound vulnerable to worsening debt problem
As for the UK’s debt woes, the government has set November 26 as the date of the Autumn Budget, which is later than usual. This suggests Chancellor Rachel Reeves needs more time to prepare the budget as she scrambles to find alternative revenue sources and areas for spending reductions. The markets aren’t holding their breath, however, as even if Reeves manages to fill the fiscal hole that could potentially be as high as £50 billion, the gap would almost certainly be covered by higher taxation than lower spending, dampening growth in the economy.
The pound has been extremely choppy since late August and plunged last Tuesday when the yields on both the 10- and 30-year gilts soared, with the latter reaching the highest since 1998. Investors questioning the ability of governments to repay their debt could be much more damaging for sterling than the other currencies in the danger zone right now – the euro and yen – due to the UK’s twin deficit problem.
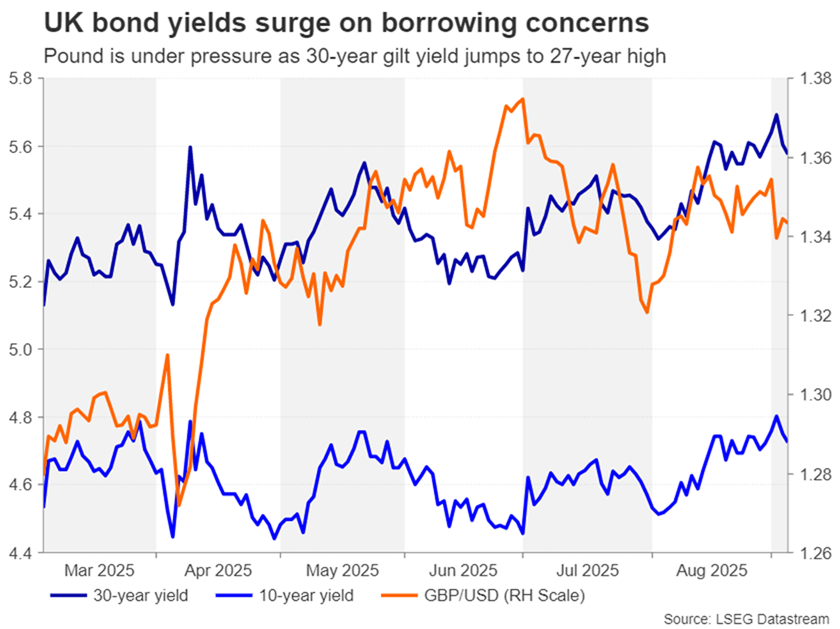
But with the bond market scare starting to ease, there could be more relief for the pound and gilts next week if Friday’s monthly GDP readings for July don’t disappoint.
OPEC+ may prefer lower prices
Oil futures have not been immune to the recent volatility, although prices are being driven for different reasons. Just as the receding hopes of a direct dialogue between Ukraine and Russia on ending the war and the prospect of more US sanctions on Russian oil exports have given prices a leg up, OPEC+ has delivered a fresh blow to the bulls.
OPEC+ sources have told Reuters that the cartel is not done raising output and will consider additional increases when member countries meet on Sunday to discuss quota levels.
OPEC producers have already unleashed 2.5 million barrels per day of new supply into the market this year but had hinted that September’s increase of 547,000 bpd was going to be the last. Should they proceed with another output hike for October rather than pause, this may signify that their goal isn’t just to balance the market but to also price out the competition from non-OPEC+ countries.
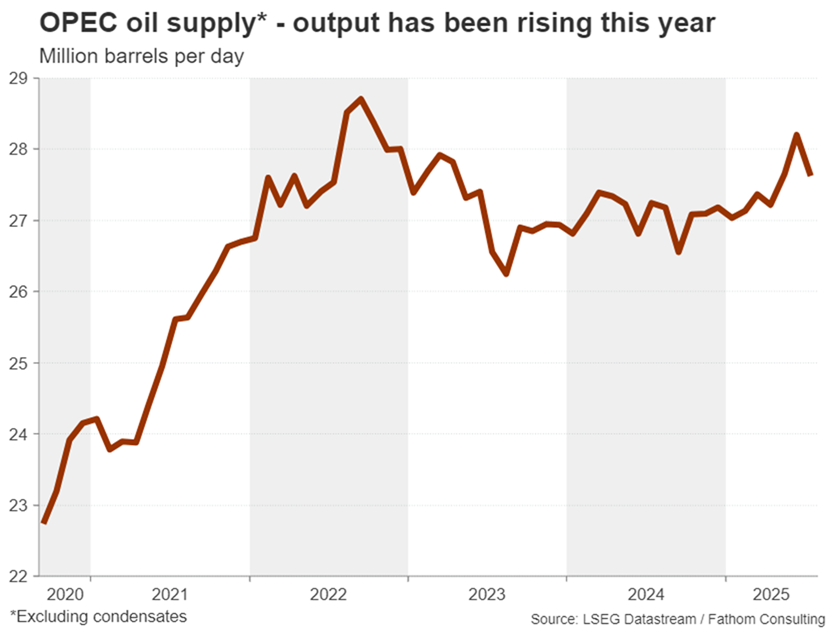
Oil prices could come under pressure if OPEC+ announces higher quotas or strongly signals it for one of the upcoming meetings.
Busy start to the week
Investors will also be watching Chinese trade figures first thing on Monday. So far, there’s been no notable impact from the trade war with the US on China’s exports, at least not according to the official data. However, now that the dust has started to settle, investors may not necessarily react much even if there’s a slowdown in August export growth, although a very weak print could spur some negative reaction.
More Chinese data will follow on Wednesday with the CPI and PPI readings for August.
Meanwhile, Japan will publish revised GDP estimates for the second quarter on Monday, and corporate goods prices for August might attract some attention on Thursday.
Weekly Focus – Next Week to Give Us Signals of US Inflation Momentum
This week we published our updated macroeconomic projections, and what is perhaps the most interesting observation in this forecast round, is the fact that economic outlook is broadly unchanged from the June round, despite all the political noise. In fact, as growth in the euro area surprised to the upside during the first half of this year, we have upgraded our GDP projection for this year. In the US, the economy has also held up well. In China, while the most recent data releases have been to the weak side, we have still revised up our growth forecast on the back of solid macroeconomic performance in the first half of 2025. Read more on Nordic Outlook - Caution, not crisis, 3 September 2025.
Euro area data this week largely confirmed that the economy remains on track. Unemployment rate fell to 6.2% in July from 6.3% in June, and inflation remains close to the ECB's target. The flash estimate for headline inflation was at 2.1% in August, rising only marginally from 2.0% in July. Core inflation kept stable at 2.3%. These data prints will make the ECB's job rather easy next week. Considering the better-than-expected macro performance this year, reduced trade policy uncertainty and the overall shift towards a more hawkish stance among the Governing Council, we think the ECB will maintain rates unchanged next week, and markets agree. We see no more cuts in the horizon. Read more in ECB Preview: Confident in the current monetary policy stance, 5 September 2025.
UK markets had a volatile week after the Prime Minister Keir Starmer did a backroom cabinet reshuffle with the move having the potential to sideline Chancellor Reeves. Reeves represents the more conservative fiscal line within the party. Until now, we have expected Labour to tighten fiscal policy significantly at the next budget to meet the fiscal objectives. But now, the prospects do not look promising and further FX and bond market selloffs are likely ahead of the next budget.
Also in politics, on Monday, focus turns to the no-confidence vote on the French prime minister Bayrou. Bayrou and his government are expected to fall with both the far right and the left-wing parties vowing to vote against his minority administration. President Macron can then choose a new premier or call for a snap election. We expect continued uncertainty in French politics to persist and do not see any significant improvements in public finances realistic in the near-term.
On data front, next week's most important releases are all related to US inflation. The August PPI, due for release on Wednesday, will provide markets with the first sense of how tariff-related costs have continued to build. We wrote about the worrying details of the July release in RtM USD - The nature of inflation matters for the Fed, 19 August. Then on Thursday, the August CPI will illustrate how firms are passing through the cost increases to prices. Finally on Friday, the Fed will keep a close eye on the University of Michigan's preliminary September consumer sentiment survey. Also in the US, The BLS will publish its preliminary annual benchmark revision to NFP data on Tuesday. The revision affects data from April 2024 until March 2025. We expect another negative revision of -400k.
In China, focus is on exports data released early on Monday. Exports have been surprisingly robust in light of the headwinds from tariffs.
ECB Preview – Confident in Current Monetary Policy Stance
- We expect the ECB to leave the deposit rate unchanged at 2.00% on Thursday 11 September in line with consensus and market pricing.
- Lagarde to sound confident in the economic outlook and that the current monetary policy stance is appropriate, with staff projections likely to show little changes in the forecast for 2026-27.
- We expect Lagarde to be satisfied with current market pricing, aiming for a limited market reaction during the press conference.
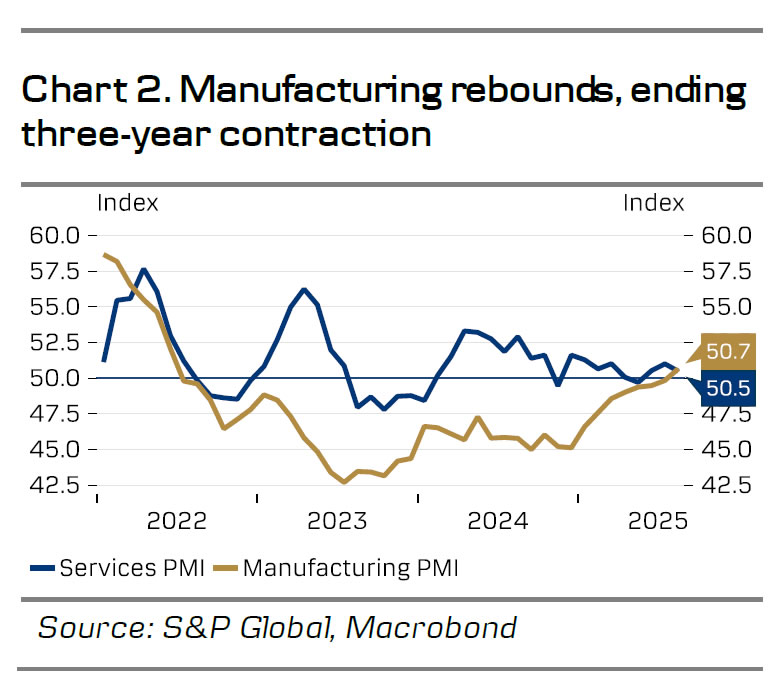
We expect the ECB to keep the deposit rate unchanged at 2.00% at the September meeting, aligning with both market pricing and consensus expectations. The euro area economy has demonstrated resilience since the last ECB meeting, with rising PMIs and the manufacturing sector surpassing the 50-mark for the first time in three years. Meanwhile, unemployment continues to decline, and inflation has met the 2% target the past three months. Although the EU-US trade deal poses challenges for exporters, it also reduces downside risks to the economic outlook as the deal was consistent with ECB staff assumptions. These recent developments should bolster the ECB's confidence in their current monetary policy stance, a sentiment also reflected in recent remarks from Lagarde, Villeroy, Nagel and Kazaks.
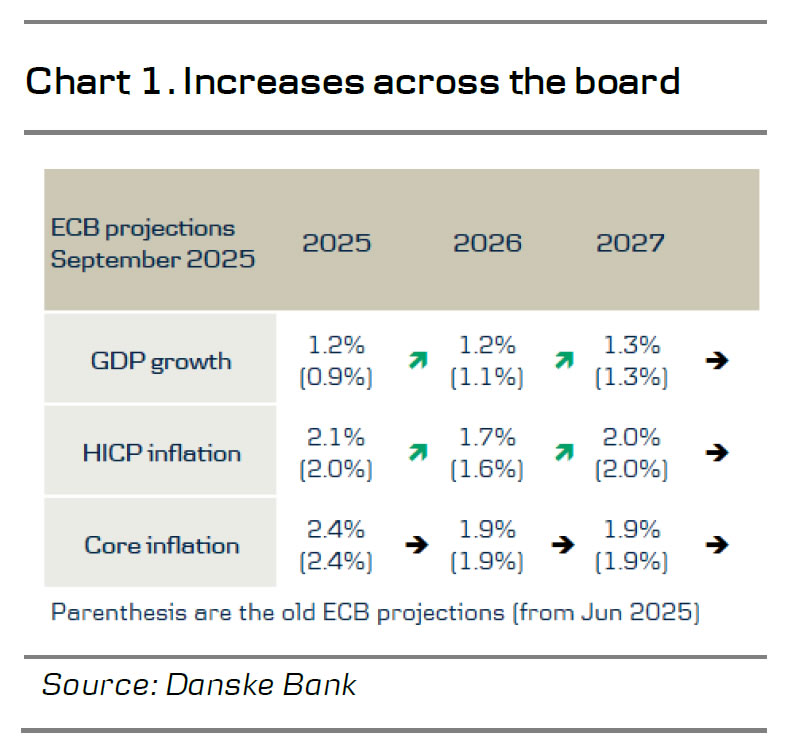
The meeting will also feature a new set of staff projections, which we project to show higher growth and inflation in 2025 due to upside surprises in historical data, while the projections for 2026 and 2027 should only incorporate minor adjustments, see chart 1 and a detailed analysis in Reading the Markets EUR - Taking stock on excess liquidity; tactical curve steepener, September 4. Given the elevated tariff uncertainty surrounding the staff projections in June the limited number of changes in the new projections should also increase ECB's confidence in the outlook and thus their current monetary policy stance.
Markets are currently pricing in approximately 8bp worth of rate cuts for 2025 and another 8bp in the first half of 2026. Yet, we do not believe Lagarde has significant incentive to push market pricing in either direction during the press conference. Near-term growth risks remain tilted to the downside due to weak consumer confidence, which is constraining spending growth. Both Rehn and Simkus have highlighted that downside growth risks, combined with inflation falling short of the target, leaves the possibility of a rate cut in December on the table, with Simkus even having it as baseline scenario. Given these risks, we expect Lagarde to aim for a limited market reaction during the press conference.
Discussions about coming rate hikes from the ECB has started to emerge following the outlook for fiscal easing in Germany and increased defense spending in Europe. Heavyweight in the GC Schnabel has similarly stated that global rate hikes may start earlier than expected. We believe hikes in 2026 are premature due to inflation likely being below target by then and the German economy having sufficiently room to increase production without fueling inflation. Yet, we do acknowledge upside risks to the ECB profile at the end of 2026 but expect the policy rate to remain at 2.0% in 2025 and 2026 in our baseline.