Sample Category Title
Dollar Falters and Yields Dive, Gold Hits New Highs, Stocks Hesitate
The past week in global markets has been anything but routine. What began as cautious positioning around economic data turned into a full-scale rethink of Fed policy and global growth prospects. Currency traders, bond investors, and equity markets were all forced to adjust as the numbers told a weaker story than anyone hoped for.
At the center of it all stood the U.S. jobs report. Instead of offering reassurance that the economy was holding up, the data marked another blow to confidence. For the Federal Reserve, the message was unmistakable: easing is no longer optional but necessary. Futures markets responded instantly, pushing expectations for multiple rate cuts further into the year.
Currency markets captured the story vividly. The dollar’s slide reshuffled the performance table, sending Swiss Franc and Euro to the top while leaving Loonie and Yen at the bottom. Domestic themes added another layer — from Canada’s disappointing jobs to Britain’s fiscal woes — but the common thread was that Dollar weakness magnified all other moves.
In equities, the tug of war between policy relief and growth concerns grew more intense. Optimism over easier Fed conditions helped push benchmarks to new records intraday, but those gains quickly faded. Investors seem less willing to buy the promise of liquidity when the economic foundation looks increasingly fragile.
Gold, however, thrived in the uncertainty. With Dollar under pressure and real yields tumbling, the metal surged to record levels, positioning itself as the standout performer of the week. The move toward the 4000 psychological mark no longer looks distant, and safe-haven demand is clearly back in play.

Labor Cracks Widen; Market Leans Toward Back-to-Back Fed Cuts
The US August jobs report delivered another shockingly weak print, setting Fed-easing expectations firmer than at any point this year. Non-farm payrolls rose just 22k, well below the modest 78k consensus, while the jobless rate ticked up to 4.3%, a near four-year high.
Beneath the headline, the revision story was arguably more damaging for sentiment. June was marked down to -13k, the first monthly job loss since the pandemic, while July was nudged up to 79k—hardly a meaningful rebound when paired with August’s soft gain.
Taken together, the data argue that the labor market is cooling faster than Fed officials anticipated. The narrative has shifted from “soft landing” toward “insurance required,” with growing pressure on policymakers to provide timely support.
Rates markets moved quickly. Fed funds futures now fully price a 25bp cut at this month’s FOMC, with about 11% odds attached to a 50bp move. If next week’s core CPI slows unexpectedly, the probability of a jumbo cut would likely rise further.
Importantly, the market isn’t stopping at September. Odds of a back-to-back 25bp reduction in October have climbed to around 80%, reflecting the view that the Fed is behind the curve and must catch up if labor slack widens.

That makes the September SEP and dot plot pivotal. The question is whether the median still implies two cuts for 2025—or shifts toward three—and how far officials mark down growth and the longer-run policy rate.
Politics adds another wrinkle. The White House has reportedly shortlisted Kevin Hassett, Kevin Warsh, and Christopher Waller to succeed Chair Powell; all three align with the administration’s pro-easing agenda, reinforcing the market’s conviction that policy will turn looser.
With the policy debate reframed, attention now turns to market transmission—Treasury yields and Dollar will tell us how quickly easier policy gets priced.
10-Year Yield Slides Below 4.1%, Dollar at Risk of Deeper Fall
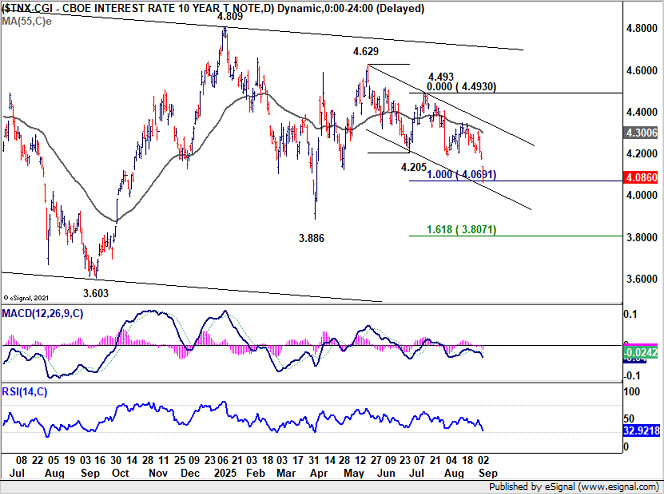
The reaction in Treasuries was swift and decisive after the weak payrolls. 10-year yield plunged through the 4.1 threshold to close at 4.086, marking its lowest levels in months. Traders rushed into bonds on bets that the Fed will move faster and harder to counter cooling labor demand.
Technically, 10-year yield is hovering near the bottom of its near term falling channel, with 4.000 handle also acting as psychological support. Stabilization may occur around current levels, but the near term outlook will stay bearish as long as 4.205 support-turned-resistance holds.
Sustained break below 4.000—particularly if accompanied by dovish Fed projections at the September meeting—could accelerate the slide. Next target is 161.8% projection of 4.629 to 4.205 from 4.493 at 3.807, which is slightly below 3.886 structural support.
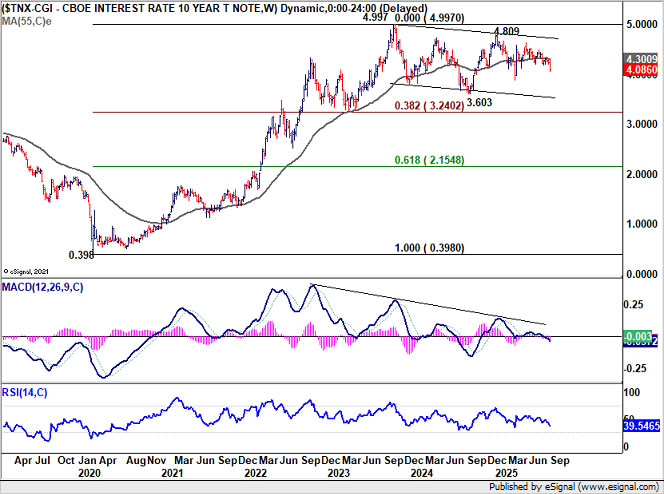
The medium-term backdrop also leans negative with rejection by 55 W EMA (now at 4.300). Fall from 4.809 could be seen as the third leg of the corrective pattern from 4.997 (2023 high). This implies scope for further losses through 3.603 to 38.2% retracement of 0.398 (2020 low) to 4.997 at 3.240 in the medium term, before finding a bottom.
Meanwhile, Dollar's selloff wasn’t catastrophic, as Dollar Index closed the week at 97.76, well above the July low at 96.37. But the index is clearly under pressure after multiple rejections at 55 D EMA (now at 98.40). Deeper fall is mildly in favor to retest on 96.37 in the near term. Whether that level holds may depend heavily on the Fed’s updated projections.
Upside recovery, meanwhile, looks limited. A break above 98.83 would extend the corrective structure off 96.37, but gains would likely stall beneath 100.25 resistance.
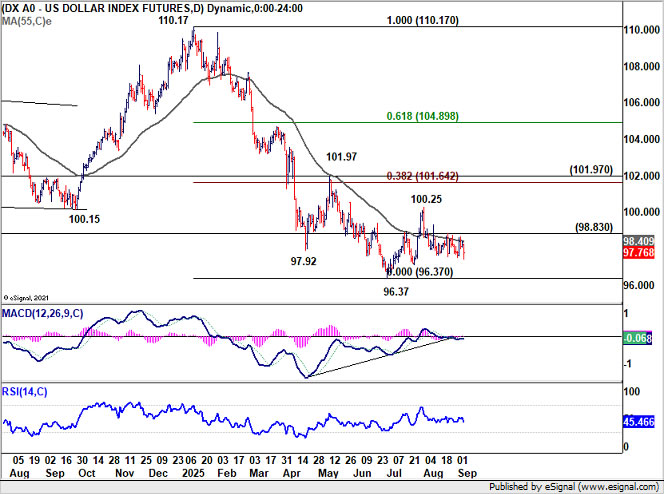
For the longer term picture, Dollar Index continues to hover slightly above long-term channel bottom that has defined the uptrend since 2008, now sitting around 96.0. Sustained break of the channel would open up deeper down trend to 61.8% retracement of 70.69 (2008 low) to 114.77 (2022 high) at 87.52.

Stocks Struggle Despite Fed Easing Bets
US equities gave back early gains on Friday, with DOW, S&P 500, and NASDAQ all finishing lower despite briefly touching record intraday levels. The pullback highlights investor unease that Fed easing may not fully insulate earnings from a slowing labor market and rising tariff pressures.
For equity bulls, the question is no longer whether the Fed will cut, but whether those cuts will arrive fast enough to cushion corporate profits.
Technical signals continues suggest fatigue after recent record runs. S&P 500 is losing momentum as reflected in D MACD. The index also struggles to break decisively above 61.8% projection of 3491.58 to 6147.43 from 4835.04 at 6476.35.
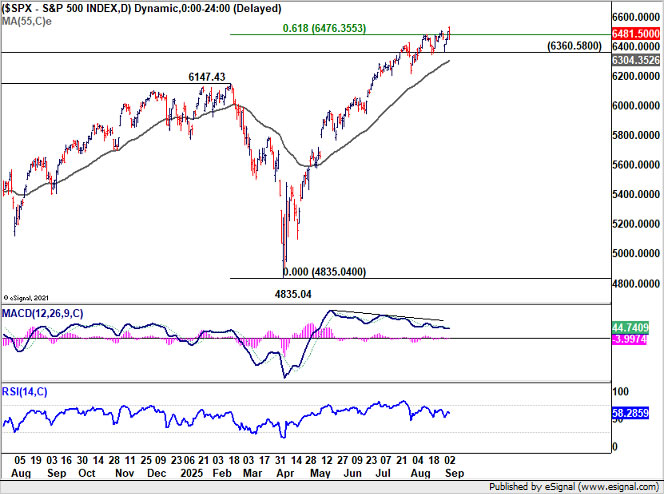
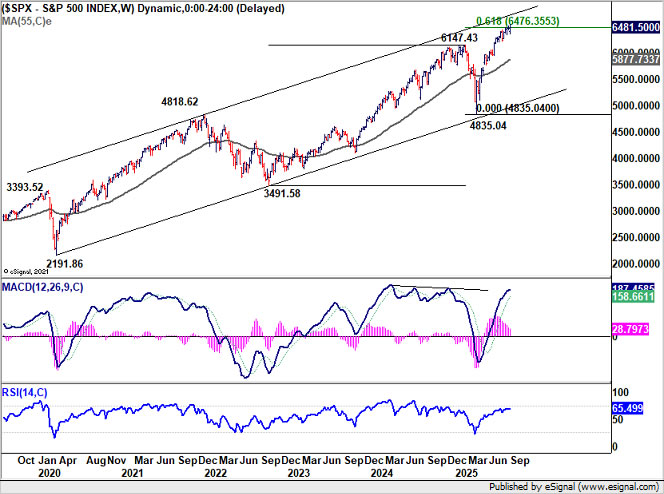
The market is also running into the ceiling of its long-term rising channel, currently near 6690, further restraining bullish momentum. Even if stocks attempt another leg higher, the path looks constrained.
On the downside, break of 6360.58 support could trigger profit-taking and accelerate a correction. Sustained fall below the 55 D EMA (now at 6304.35) would confirm a medium-term correction, with risks extending toward 55 W EMA (now at 5877.73).
Gold Surges to Record, Eyes 4000 Next
Gold's reaction to NFP was much more clear-cut. While there was brief intraweek retreat, Gold quickly jumps after after the data and closed at new record high. For the near term, outlook will now stay bullish as long as 3511.49 support holds. Next target is 261.8% projection of 3267.90 to 3408.21 from 3311.30 at 3678.63.
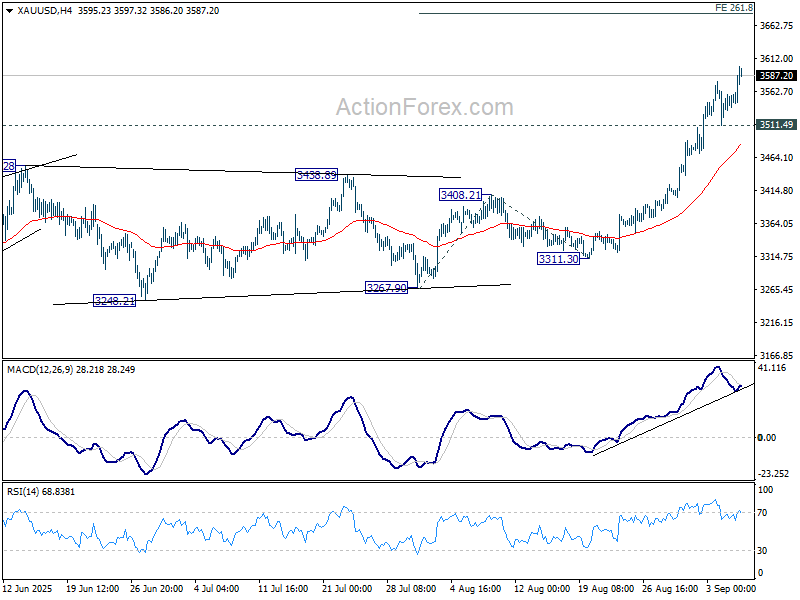
More importantly, Gold has now taken out 200% projection of 1160.17 to 2704.87 from 1614.60 at 3443.94 decisively. The current up trend would now be targeting 261.8% projection at 4009.20, which is close 4000 psychological level, in the medium term.

EUR/USD Weekly Outlook
EUR/USD's rise from 1.1390 resumed late last week by breaching 1.1741. The development aligns with the case that correction from 1.1829 has completed with three waves down to 1.1390. Initial bias is now on the upside this week for retesting 1.1829 first. Firm break there will resume larger up trend. For now, risk will stay on the upside as long as 1.1607 support holds, in case of retreat.
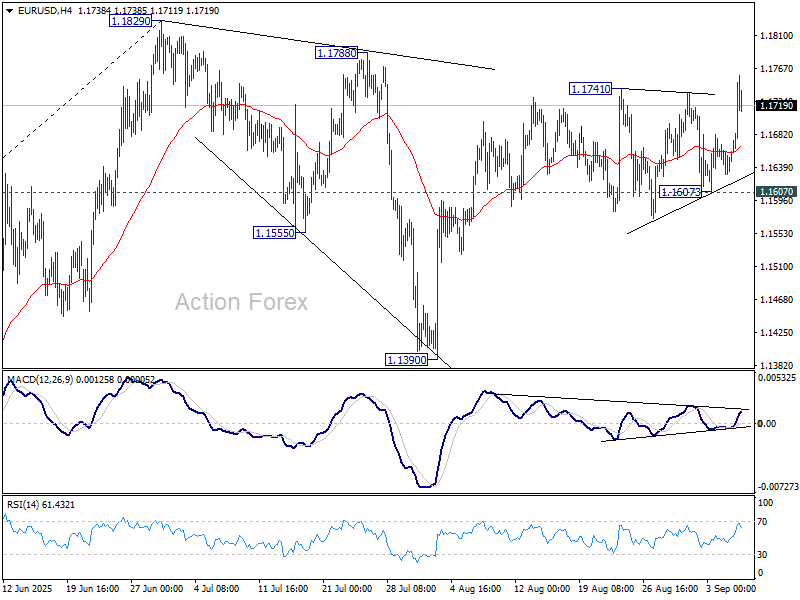
In the bigger picture, rise from 0.9534 (2022 low) long term bottom could be correcting the multi-decade downtrend or the start of a long term up trend. In either case, further rise should be seen to 100% projection of 0.9534 to 1.1274 from 1.0176 at 1.1916. This will remain the favored case as long as 1.1604 support holds.
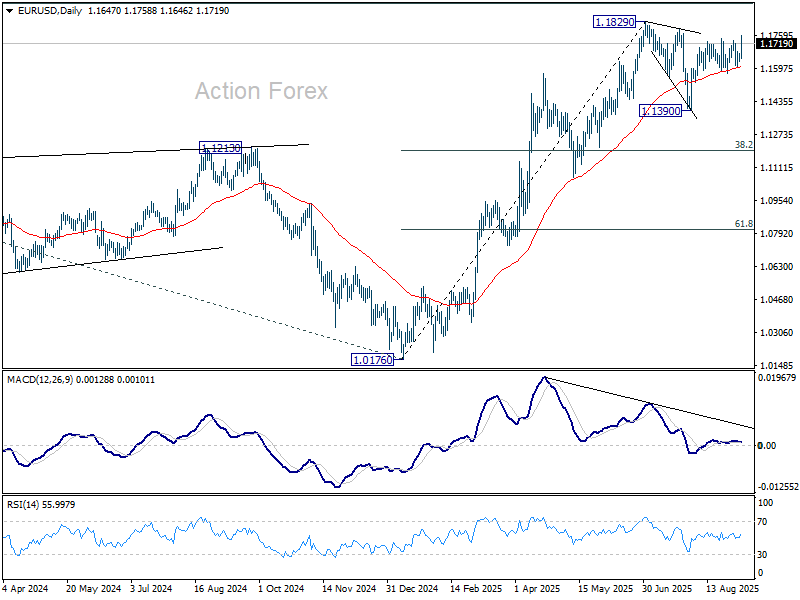
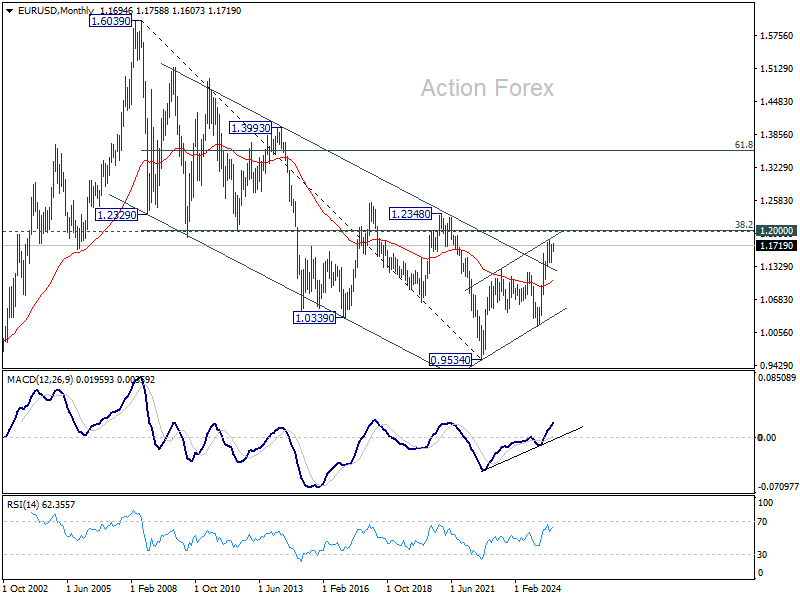
In the long term picture, a long term bottom was in place already at 0.9534, on bullish convergence condition in M MACD. Further rise should be seen to 38.2% retracement of 1.6039 (2008 high) to 0.9534 at 1.2019. Rejection by 1.2019 will keep the price actions from 0.9534 as a corrective pattern. But sustained break of 1.2019 will suggest long term bullish trend reversal, and target 61.8% retracement at 1.3554.

EUR/USD Weekly Outlook
EUR/USD's rise from 1.1390 resumed late last week by breaching 1.1741. The development aligns with the case that correction from 1.1829 has completed with three waves down to 1.1390. Initial bias is now on the upside this week for retesting 1.1829 first. Firm break there will resume larger up trend. For now, risk will stay on the upside as long as 1.1607 support holds, in case of retreat.
In the bigger picture, rise from 0.9534 (2022 low) long term bottom could be correcting the multi-decade downtrend or the start of a long term up trend. In either case, further rise should be seen to 100% projection of 0.9534 to 1.1274 from 1.0176 at 1.1916. This will remain the favored case as long as 1.1604 support holds.
In the long term picture, a long term bottom was in place already at 0.9534, on bullish convergence condition in M MACD. Further rise should be seen to 38.2% retracement of 1.6039 (2008 high) to 0.9534 at 1.2019. Rejection by 1.2019 will keep the price actions from 0.9534 as a corrective pattern. But sustained break of 1.2019 will suggest long term bullish trend reversal, and target 61.8% retracement at 1.3554.
USD/JPY Weekly Outlook
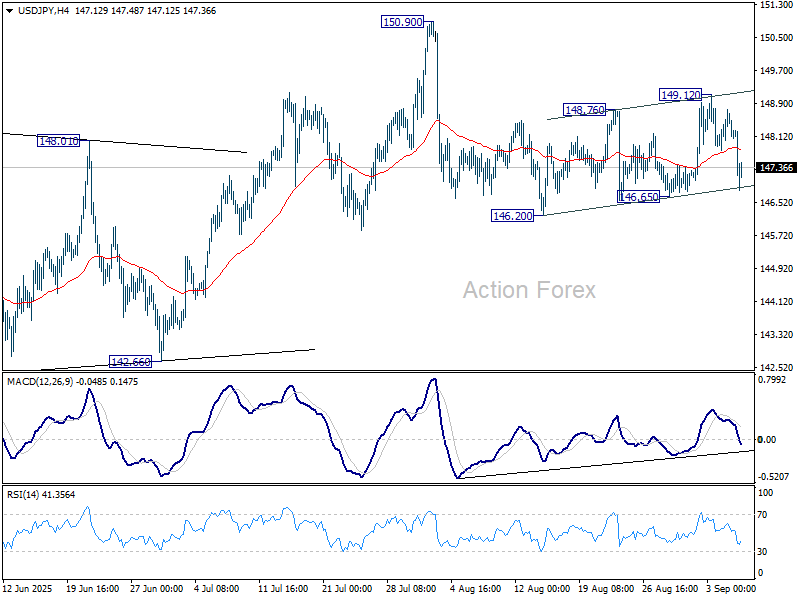
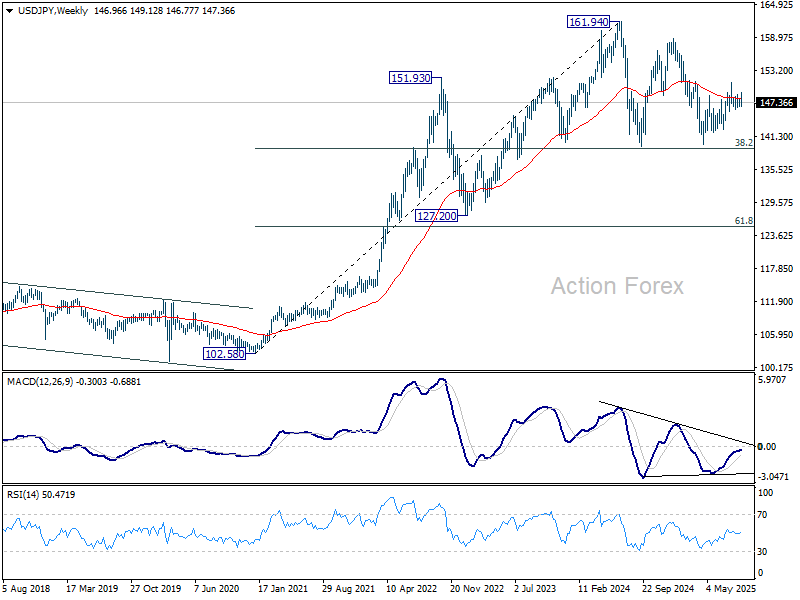
USD/JPY edged higher to 149.12 last week but reversed from there. Nevertheless, downside is contained above 146.65 support so far. Initial bias remains neutral this week first. On the downside, break of 146.65 will suggest that fall from 150.90 is resuming. More importantly, sustained trading below 55 D EMA (now at 147.12) will argue that whole rebound from 139.87 has completed with three waves up to 150.90. Deeper decline should then be seen to 142.66 support next.
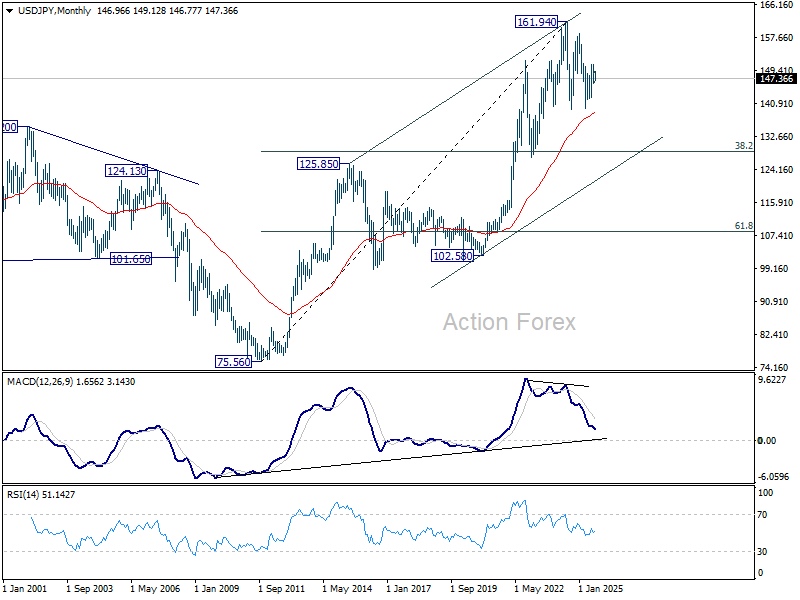
In the bigger picture, price actions from 161.94 (2024 high) are seen as a corrective pattern to rise from 102.58 (2021 low). Decisive break of 61.8% retracement of 158.86 to 139.87 at 151.22 will argue that it has already completed with three waves at 139.87. Larger up trend might then be ready to resume through 161.94 high. In case the corrective pattern extends with another fall, strong support is expected from 38.2% retracement of 102.58 to 161.94 at 139.26 to bring rebound.

In the long term picture, there is no sign that up trend from 75.56 (2011 low) has completed. But then, firm break of 161.94 is needed to confirm resumption. Otherwise, more medium term range trading could still be seen.
GBP/USD Weekly Outlook
GBP/USD's late rebound and breach of 1.3549 resistance suggests that fall from 1.3594 has completed as a corrective pullback. Rise from 1.3140 should be ready to resume. Initial bias is now on the upside this week. Break of 1.3594 will target a retest on 1.3787 high. For now, risk will stay on the upside as long as 1.3332 support holds, in case of retreat.
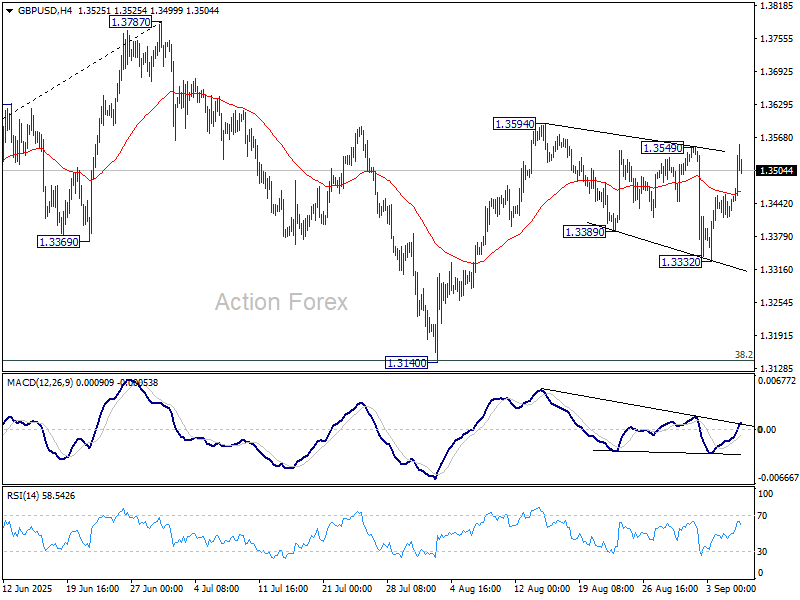
In the bigger picture, up trend from 1.3051 (2022 low) is in progress. Next medium term target is 61.8% projection of 1.0351 to 1.3433 from 1.2099 at 1.4004. Outlook will now stay bullish as long as 55 W EMA (now at 1.3118) holds, even in case of deep pullback.

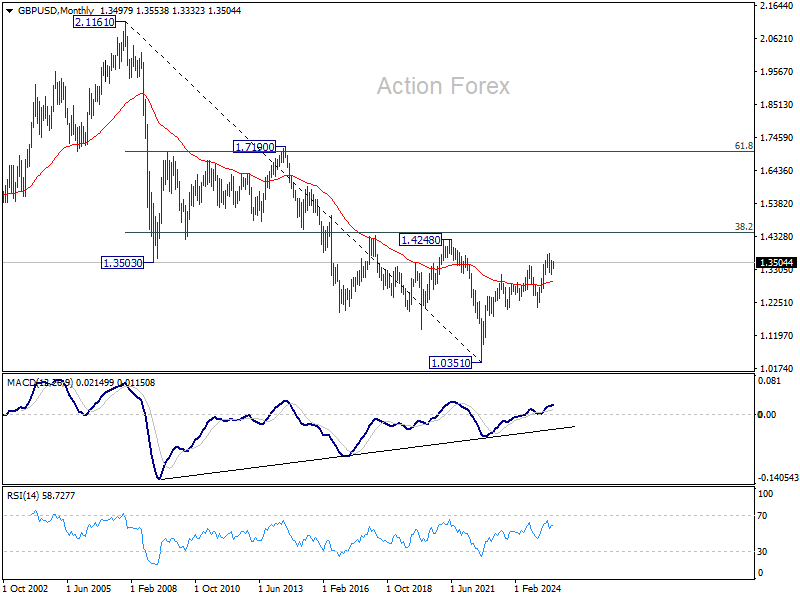
In the long term picture, for now, price actions from 1.0351 (2022 low) are still seen as a corrective pattern to the long term down trend from 2.1161 (2007 high) only. However, firm break of 1.4248 resistance (38.2% retracement of 2.1161 to 1.0351 at 1.4480) will be a strong sign of long term bullish reversal.

USD/CHF Weekly Outlook
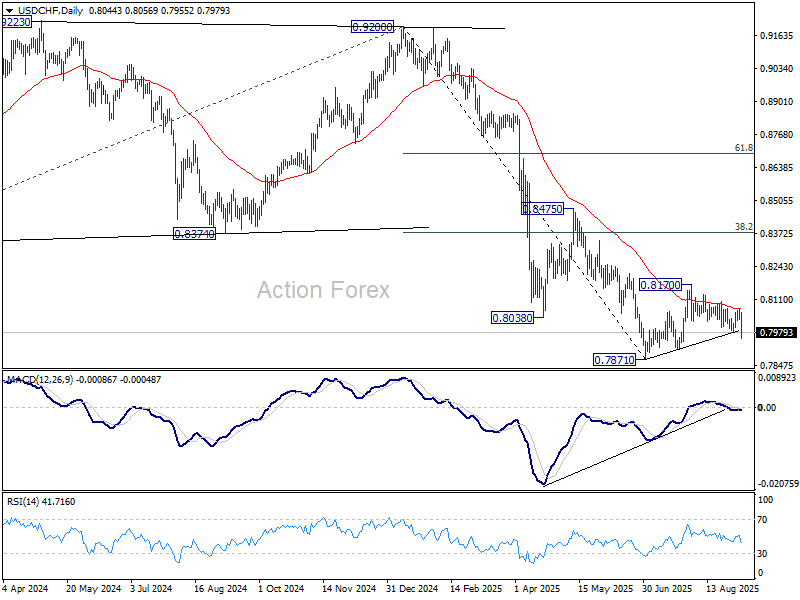
USD/CHF's fall from 0.8170 extended lower last week after interim recovery. The development aligns with the case that corrective rebound from 0.7871 has completed at 0.8170. Initial bias is now on the downside this week for retesting 0.7871. For now, risk will stay on the downside as long as 0.8071 resistance holds, in case of recovery.

In the bigger picture, long term down trend from 1.0342 (2017 high) is still in progress. Next target is 100% projection of 1.0146 (2022 high) to 0.8332 from 0.9200 at 0.7382. In any case, outlook will stay bearish as long as 0.8475 resistance holds.
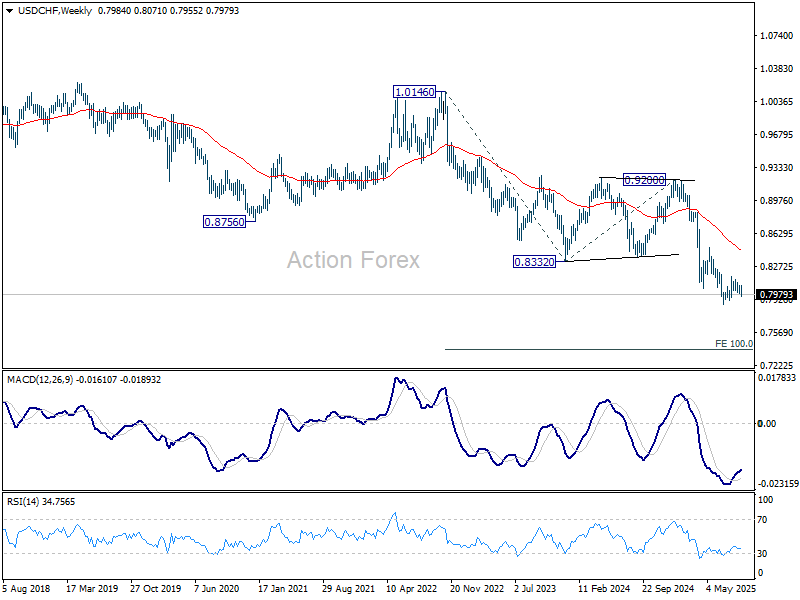
In the long term picture, price action from 0.7065 (2011 low) are seen as a corrective pattern to the multi-decade down trend from 1.8305 (2000 high). It's uncertain if the fall from 1.0342 is the second leg of the pattern, or resumption of the downtrend. But in either case, outlook will stay bearish as long as 0.9200 resistance holds. Retest of 0.7065 should be seen next.

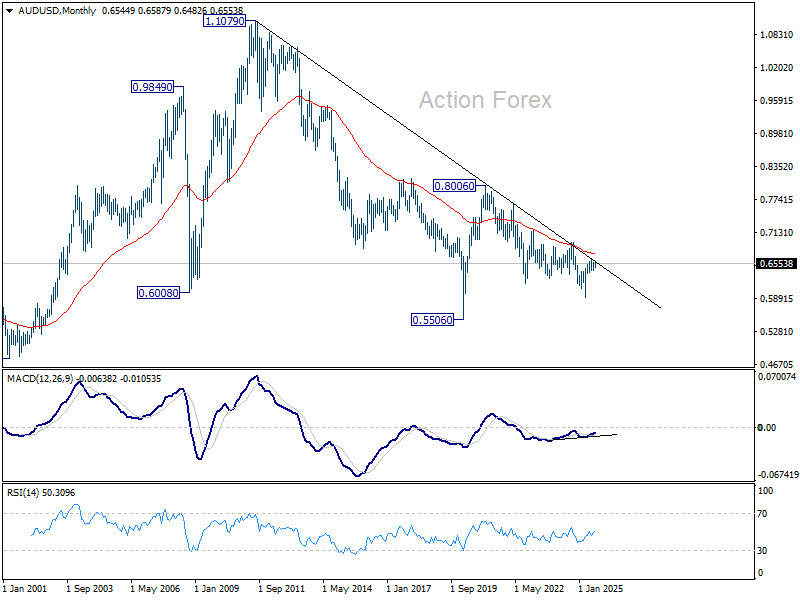
AUD/USD Weekly Report
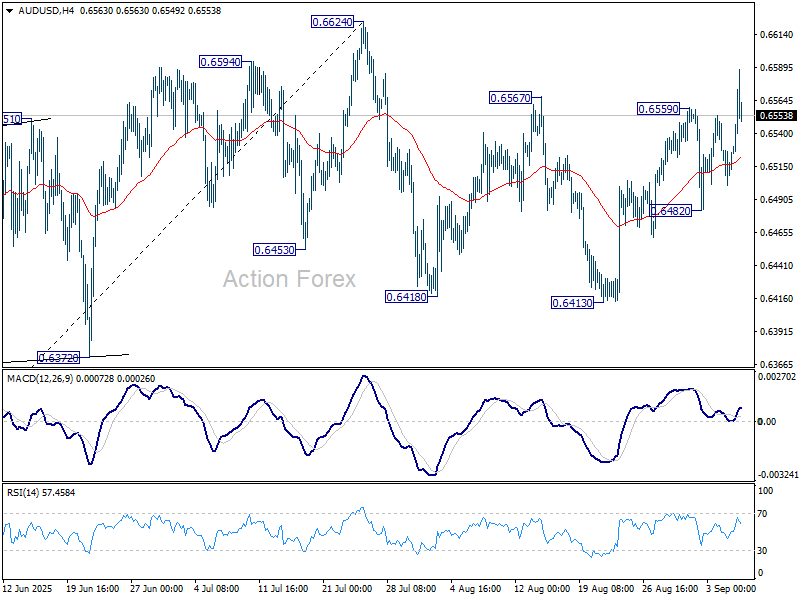
After interim pullback, AUD/USD's rebound from 0.6413 extended through 0.6567 resistance last week. The development suggests that correction from 0.6624 has already completed. Initial bias is back on the upside for retesting 0.6624 first. Firm break there will resume larger rally from 0.5913 to 0.6713 fibonacci level. For now, risk will stay on the upside as long as 0.6482 support holds, in case of retreat.
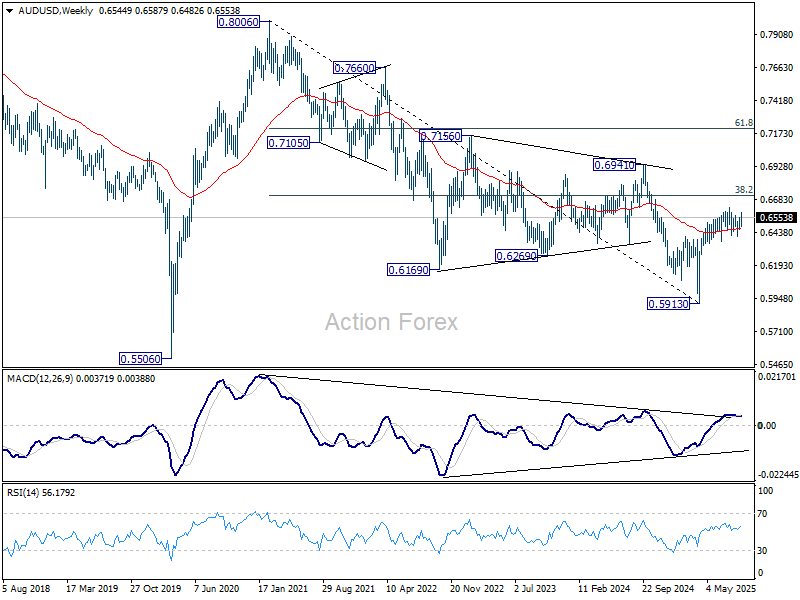
In the bigger picture, there is no clear sign that down trend from 0.8006 (2021 high) has completed. Rebound from 0.5913 is seen as a corrective move. While stronger rally cannot be ruled out, outlook will remain bearish as long as 38.2% retracement of 0.8006 to 0.5913 at 0.6713 holds. Nevertheless, considering bullish convergence condition in W MACD, even in case of another fall through 0.5913, downside should be contained above 0.5506 (2020 low).

In the long term picture, fall from 0.8006 is seen as the second leg of the corrective pattern from 0.5506 long term bottom (2020 low). Hence, in case of deeper decline, strong support should emerge above 0.5506 to contain downside to bring reversal. On the upside, firm break of 0.6941 will argue that the third leg has already started back to 0.8006.
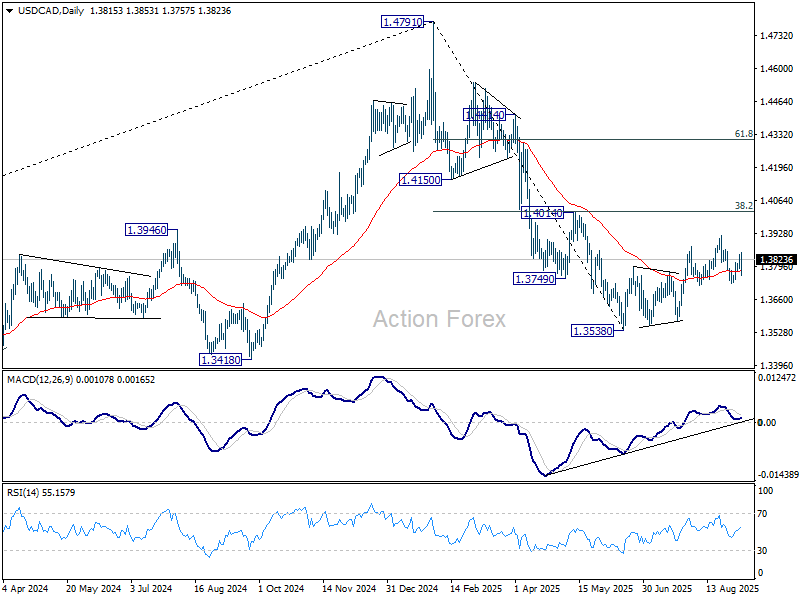
USD/CAD Weekly Outlook
USD/CAD's strong rebound last week suggests that pullback from 1.3923 short term top has completed at 1.3725, after defending 1.3720 support. The development indicates that corrective rebound from 1.3538 is not completed yet. Initial bias stays on the upside this week for retesting 1.3923 first. For now, risk will stay on the upside as long as 1.3725 support holds, in case of retreat.

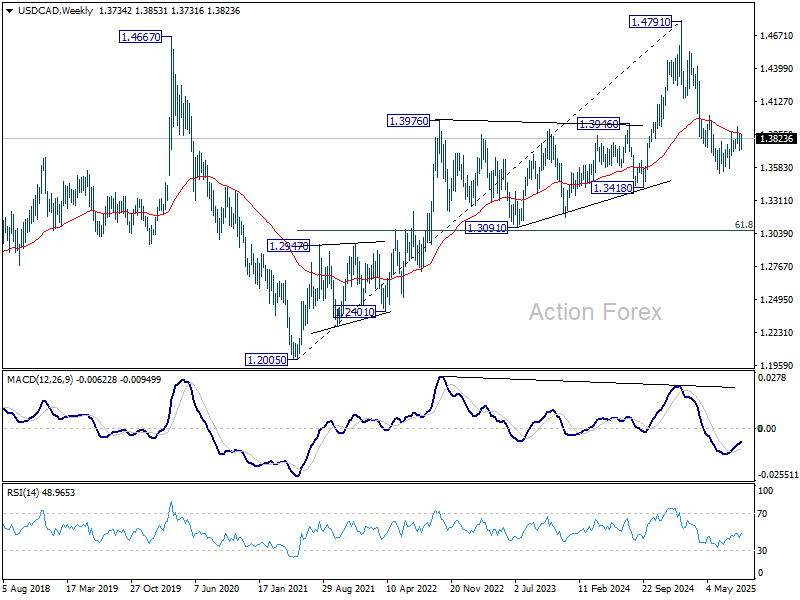
In the bigger picture, price actions from 1.4791 medium term top could either be a correction to rise from 1.2005 (2021 low), or trend reversal. In either case, further decline is expected as long as 1.4014 cluster resistance (38.2% retracement of 1.4791 to 1.3538 at 1.4017) holds. Next target is 61.8% retracement of 1.2005 (2021 low) to 1.4791 at 1.3069.
In the long term picture, considering bearish divergence condition in M MACD, up trend from 0.9506 (2027 low) might have completed with five waves up to 1.4791. Sustained trading below 55 M EMA (now at 1.3511) will solidify this case and bring deeper medium term fall to 38.2% retracement of 0.9056 to 1.4791 at 1.2600, even as a correction. Nevertheless, strong rebound from the 55 E MEA will retain bullishness for up trend resumption through 1.4791 later.

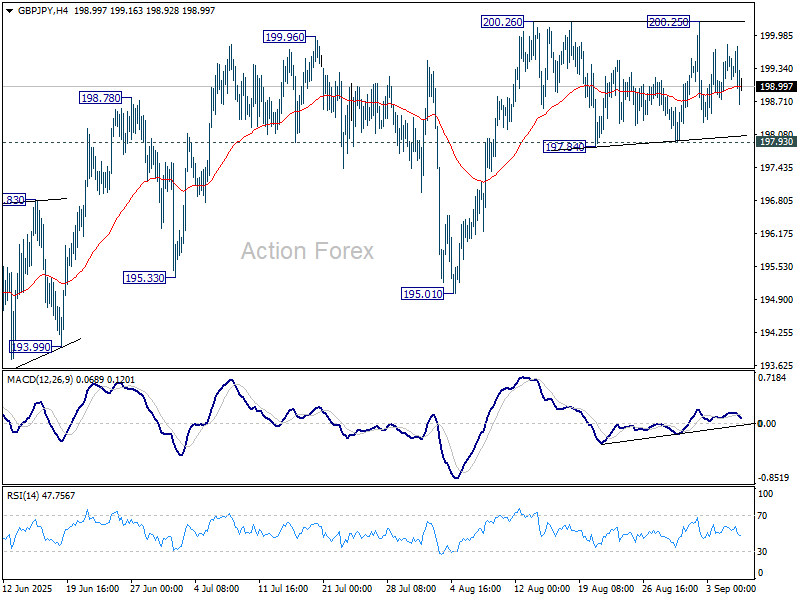
GBP/JPY Weekly Outlook
GBP/JPY stayed in sideway trading last week and outlook is unchanged. Initial bias remains neutral this week and further rise is in favor as long as 197.93 support holds. On the upside, firm break of 200.26 will resume the rally from 184.35 to 100% projection of 180.00 to 199.79 from 184.35 at 204.14. On the downside, however, break of 197.93 support will turn bias to the downside for 195.01 support next.
In the bigger picture, price actions from 208.09 (2024 high) are seen as a correction to rally from 123.94 (2020 low). The pattern might still extend with another falling leg. But in that case, strong support should be seen from 38.2% retracement of 123.94 to 208.09 at 175.94 to contain downside. Meanwhile, decisive break of 208.09 will confirm long term up trend resumption.
In the long term picture, there is no sign that the long term up trend from 122.75 (2016 low) has concluded. But firm break of 208.09 is needed to confirm resumption. Otherwise, more medium term range trading could still be seen.

EUR/JPY Weekly Outlook
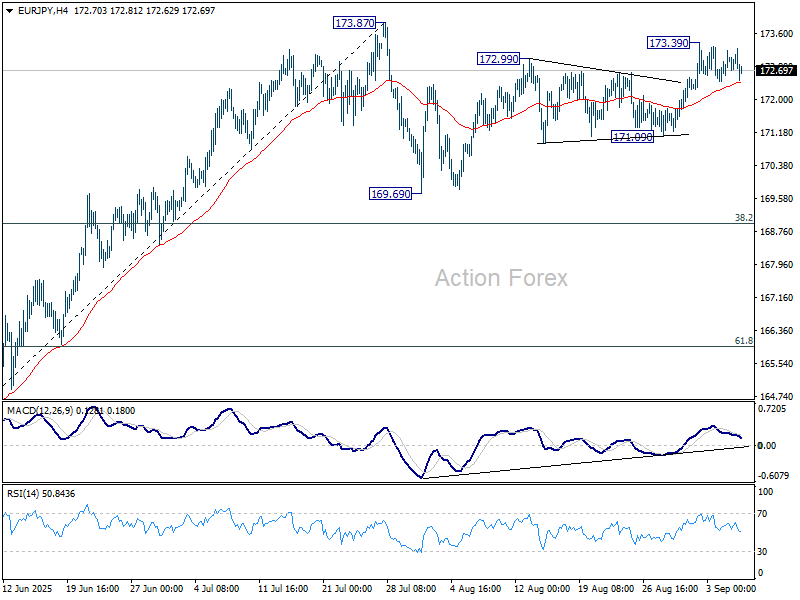
EUR/JPY's rise from 169.69 resumed last week but retreated again after hitting 173.39. Initial bias is neutral this week, and further rise is in favor. Above 173.39 will target a retest on 173.87. Firm break there will resume larger up rise to retest 175.41 key resistance. However, break of 171.09 will extend the corrective pattern from 173.87 with another leg towards 169.69 again.
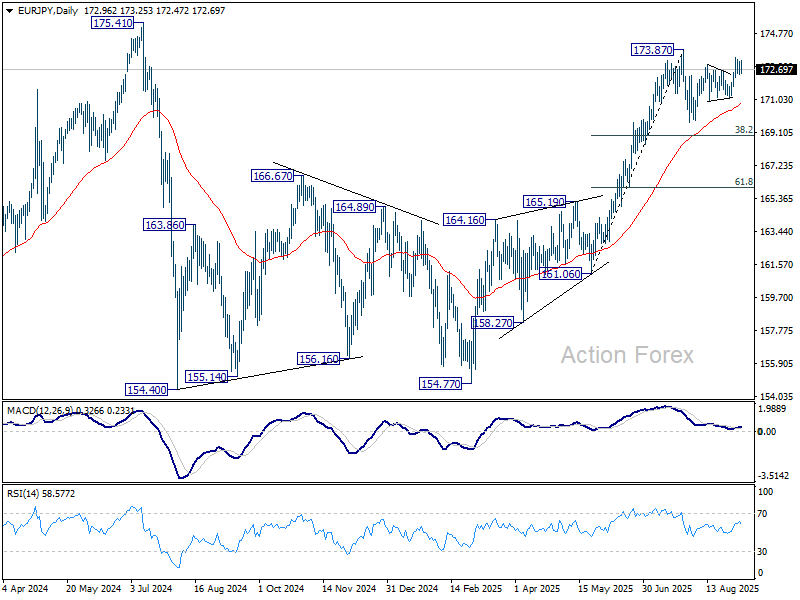
In the bigger picture, current rally from 154.77 is still tentatively seen as resuming the larger up trend. Firm break of 175.41 (2024 high) will confirm and target 61.8% projection of 124.37 to 175.41 from 154.77 at 186.31. However, sustained break of 38.2% retracement of 161.06 to 173.87 at 168.97 will delay this bullish case, and probably extend the correction from 175.41 with another fall.
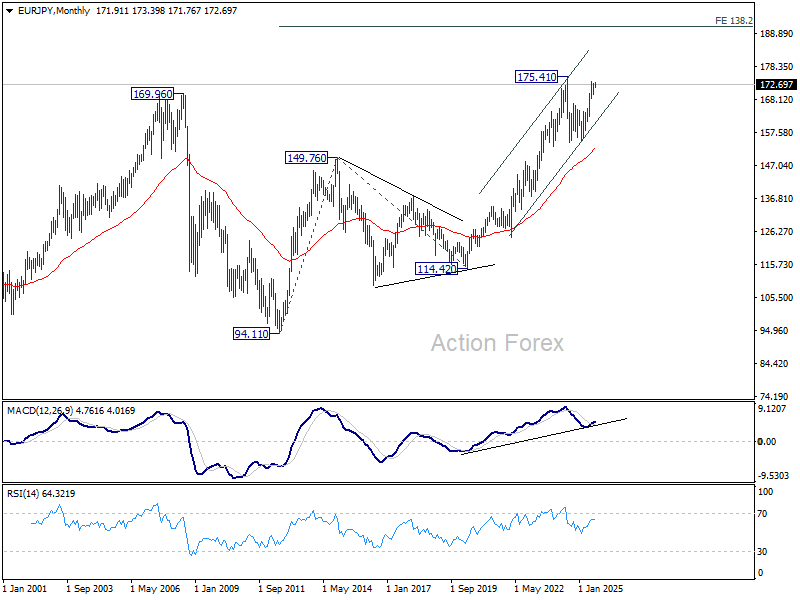
In the long term picture, up trend from 94.11 (2021 low) is still in progress. On resumption, next target is 138.2% projection of 94.11 to 149.76 (2014 high) from 114.42 (2020 low) at 191.32.

EUR/GBP Weekly Outlook
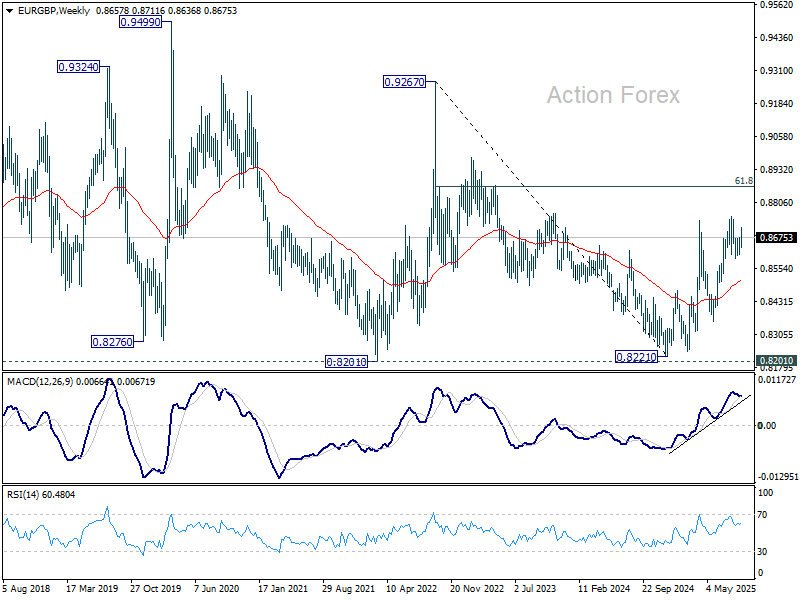
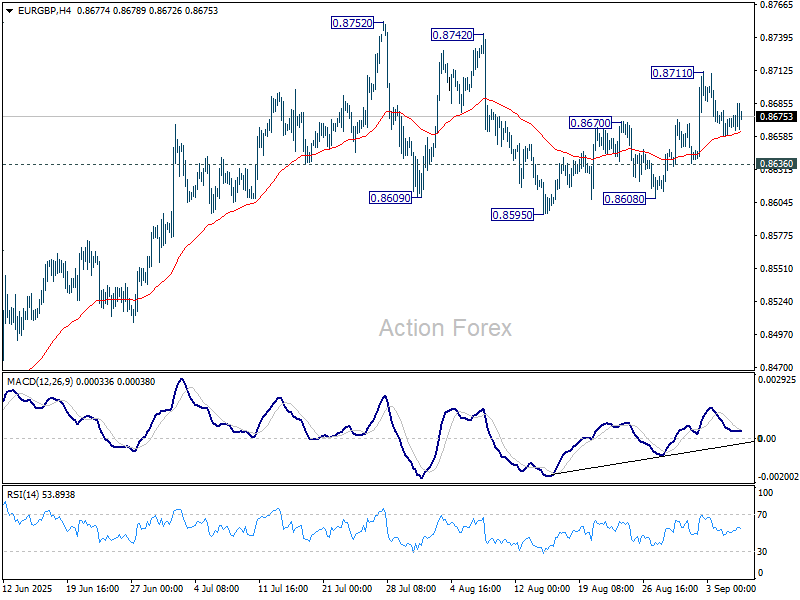
EUR/GBP's rebound form 0.8595 resumed and jumped to 0.8711 last week, but retreated since then. Initial bias stays neutral this week and further rise is mildly in favor as long as 0.8636 minor support holds. Above 0.8711 will bring retest of 0.8752 high. However, break of 0.8636 will extend the pattern from 0.88752 with another falling leg, and target 0.8959 support.
In the bigger picture, the structure from 0.8221 medium term bottom are not impulsive enough to suggest that it's reversing the down trend from 0.9267 (2022 high). But even if it's a correction, further rise could still be seen to 61.8% retracement of 0.9267 to 0.8221 at 0.8867. Nevertheless, sustained trading below 55 W EMA (now at 0.8513) will argue that the pattern has completed and bring retest of 0.8221 low.

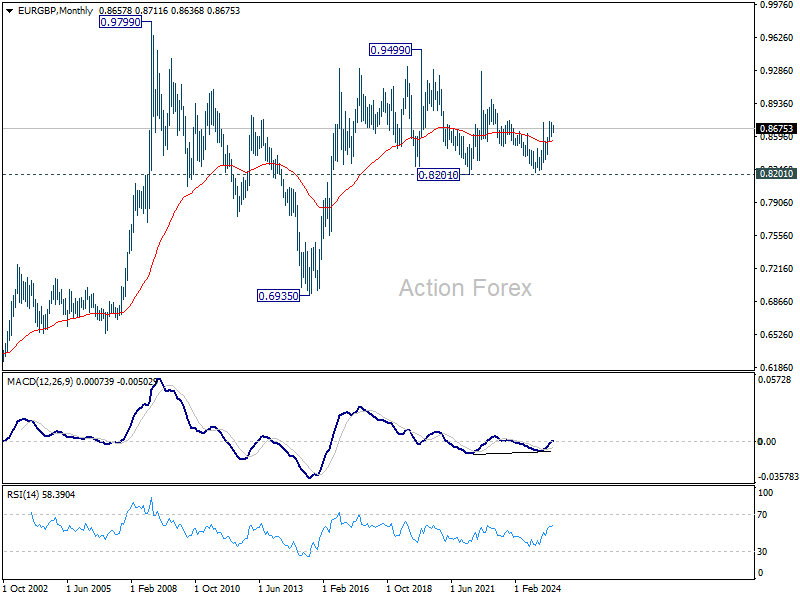
In the long term picture, price action from 0.9499 (2020 high) is seen as part of the long term range pattern from 0.9799 (2008 high). Range trading should continue between 0.8201 and 0.9499, until there is clear signal of imminent breakout.