Sample Category Title
Japanese Yen Slides After Hawkish BoJ Comments
The Japanese yen is sharply lower on Tuesday and has fallen to a two-week low. In the European session, USD/JPY is trading at 148.62, up 1.0% on the day.
BoJ Deputy Governor says rate hike coming
Bank of Japan Deputy Governor Ryozo Himino said on Tuesday that the central bank would raise rates if conditions were appropriate. Himino said there were "upside and downside risks for economy and inflation", citing the tight labor market and global economic uncertainty as upside inflation risks and tariffs and commodity prices as downward price risks.
Himino said that the impact of US tariffs could be "smaller or larger than expected" and the BoJ woul have to carefully assess the situation. The remarks reflect a genuine uncertainty over the tariffs, as US President Trump has been erratic is his trade policy. Japan and the US have reached a deal in which most Japanese products will be tariffed at 15%, but some sticking points remain, such as Japan's import of US rice.
Himino didn't provide any clues as to the timing of a rate hike but the markets are anticipating a hike in October or December. US Treasury Secretary Scott Bensen called out the BoJ in August, saying it had fallen behind the curve in the fight against inflation and needed to raise rates. Those hawish remarks raised expectations of a rate hike.
The deputy governor added that underlying inflation is still below the 2% target but it is rising and will hit the target. This is another hawkish signal from the BoJ that it plans to move towards normalization and a rate hike is only a question of timing.
ISM Manufacturing PMI expected to contract
The US will release ISM Manufacturing PMI later today. Manufacturing has been in the doldrums, with five straight readings below 50, which indicates contraction. The market estimate for August stands at 49.0, which would be an improvement from the July reading of 48.0, the weakest level since October 2024. The weak global economy and the impact of counter-tariffs on US goods continues to dampen manufacturing activity.
USD/JPY Technical
- USD/JPY has pushed above resistance at 147.22 and is putting pressure on 147.83. The next resistance line is 148.31
- 146.74 is providing support
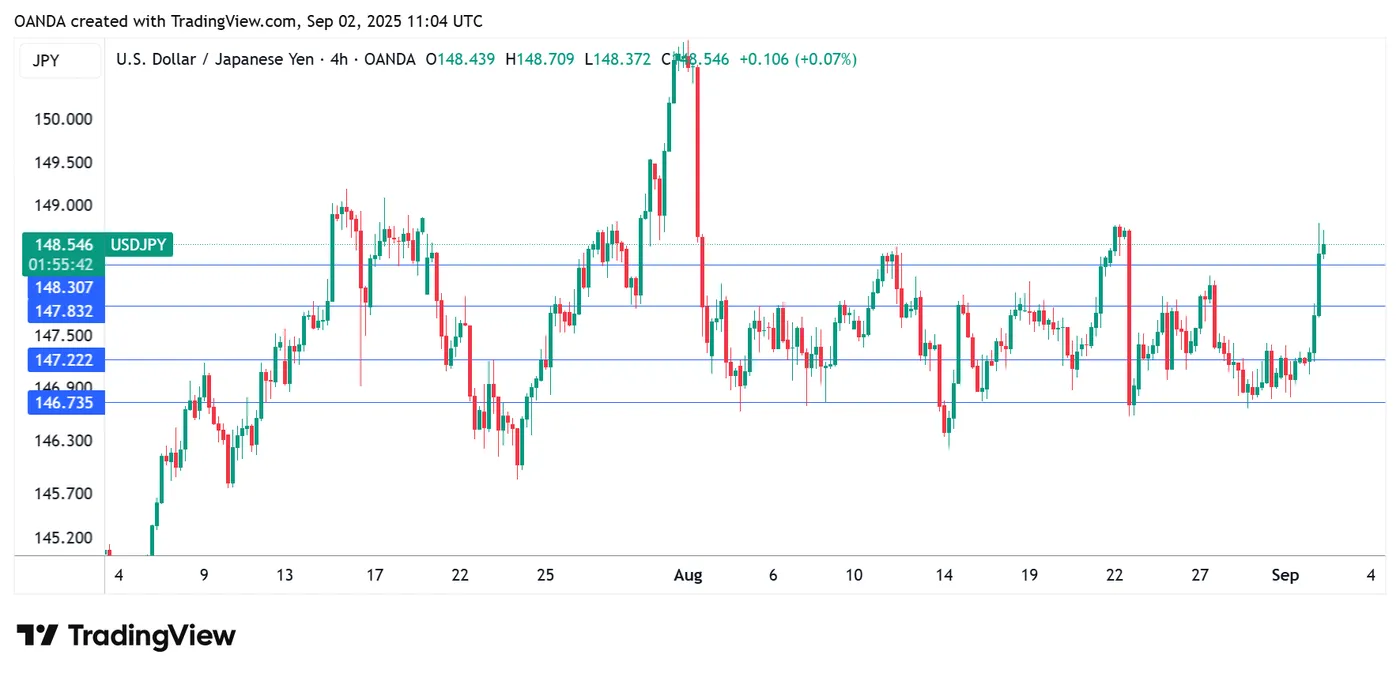
USDJPY 4-Hour Chart, September 2, 2025
GBP/USD Exchange Rate Tumbles
As today’s GBP/USD chart shows, the pound sterling fell by nearly 1% against the US dollar in just one hour, forming an exceptionally long bearish candle.
The sharp drop was driven by concerns over public finances and a broad sell-off in the bond market. According to Reuters, the yield on UK 30-year government bonds hit 5.69% – the highest level since May 1998 – highlighting the elevated risk premium.
Technical analysis of GBP/USD Price Chart
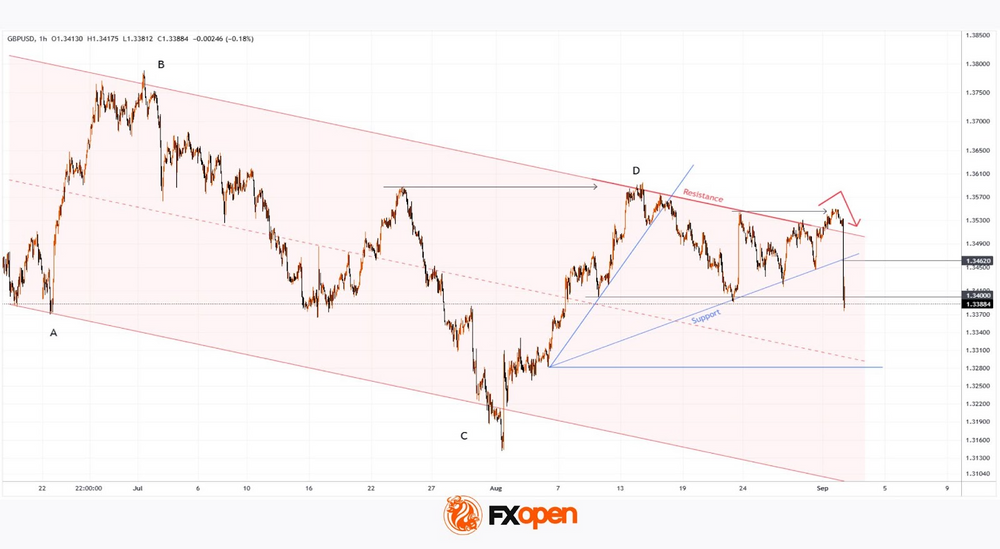
When analysing the pair’s movements in July, we questioned GBP/USD’s ability to sustain growth. Since then, the chart has developed a series of lower highs and lower lows, forming a bearish A→B→C→D structure.
At the end of August, the pair consolidated between the Support and Resistance lines shown on the chart.
Factors reinforcing the bearish context and confirming earlier doubts include:
→ a failed bullish breakout attempt (marked with a red arrow);
→ Liquidity Grab patterns above previous highs (marked with black arrows).
What could happen next?
Today’s decline highlights a strong resistance zone formed by:
→ the breakout level of August’s support around 1.3462;
→ the upper boundary of the descending channel.
Bulls may find some support at the psychological 1.3400 level. However, if pressure increases (particularly if new bearish fundamental drivers emerge), GBP/USD could slide towards the median of the descending channel.
Trade over 50 forex markets 24 hours a day with FXOpen. Take advantage of low commissions, deep liquidity, and spreads from 0.0 pips. Open your FXOpen account now or learn more about trading forex with FXOpen.
This article represents the opinion of the Companies operating under the FXOpen brand only. It is not to be construed as an offer, solicitation, or recommendation with respect to products and services provided by the Companies operating under the FXOpen brand, nor is it to be considered financial advice.
Eurozone CPI ticks up to 2.1%, core stays 2.3%
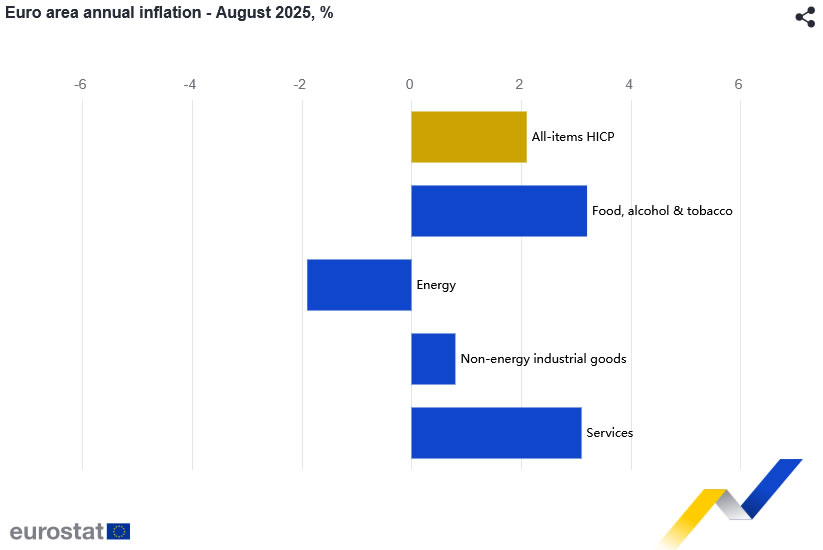
Eurozone headline inflation inched higher in August, with the flash CPI rising to 2.1% yoy from 2.0% yoy, in line with expectations. The increase came largely from a slower drag in energy prices, though food and services inflation moderated slightly from July levels.
Core CPI, excluding food, energy, alcohol, and tobacco, remained unchanged at 2.3% yoy, defying expectations of a slight dip to 2.2% yoy. The measure has now held steady since May.
By component, food, alcohol and tobacco continued to drive the highest annual inflation rate at 3.2%, followed by services at 3.1%. Non-energy industrial goods stayed muted at 0.8%, while energy prices fell -1.9% from a year earlier. The data suggest inflation continues to stabilize near the ECB’s 2% target.
Pound and Euro Hold Ground—Statistics in Focus
European currencies are holding near four-week highs at the start of the week. Following the volatile swings sparked by Jerome Powell’s remarks at the Jackson Hole symposium, the market has yet to form a clear scenario: the dollar corrected but then came under renewed pressure. As a result, EUR/USD and GBP/USD managed to test key resistance levels, though no breakout from their sideways ranges has yet occurred. The next move will largely depend on upcoming macroeconomic data releases from Europe, the UK, and the US, which could shift the short-term outlook.
Today, market participants are focused on the release of business activity indices and producer prices in Europe, along with inflation (CPI) data in Italy and the euro area. The significance of these releases is heightened by their potential to shape expectations for the European Central Bank’s future policy. Tomorrow, a batch of important statistics is due from the UK.
GBP/USD
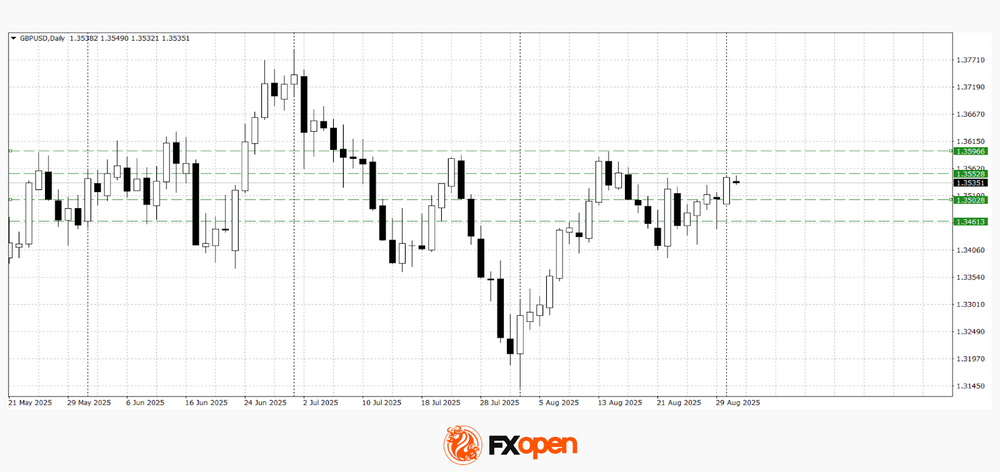
The GBP/USD pair yesterday tested a key resistance at 1.3550. Technical analysis suggests a potential move towards 1.3600 if the price maintains its current upward momentum. This growth scenario could be invalidated should support at 1.3500 be broken.
Key events that could influence GBP/USD:
- Today at 17:00 (GMT+3): US ISM Manufacturing PMI
- Tomorrow at 11:30 (GMT+3): UK Services PMI
EUR/USD
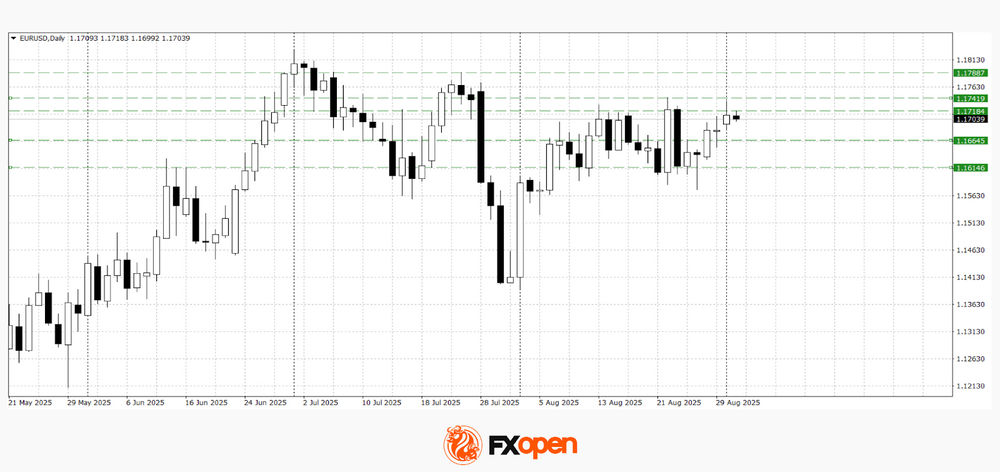
At the start of the week, buyers of the single European currency pushed the pair towards the upper boundary of the medium-term sideways range at 1.1740. Technical analysis points to a possible decline towards 1.1620–1.1640 if the pair rebounds from 1.1740. Conversely, a consolidation above 1.1740 could signal a resumption of the upward trend.
Key events that could influence EUR/USD:
- Today at 12:00 (GMT+3): Eurozone CPI
- Today at 14:30 (GMT+3): Speech by ECB representative Elderson
- Today at 17:00 (GMT+3): Speech by Bundesbank President Nagel
Trade over 50 forex markets 24 hours a day with FXOpen. Take advantage of low commissions, deep liquidity, and spreads from 0.0 pips. Open your FXOpen account now or learn more about trading forex with FXOpen.
This article represents the opinion of the Companies operating under the FXOpen brand only. It is not to be construed as an offer, solicitation, or recommendation with respect to products and services provided by the Companies operating under the FXOpen brand, nor is it to be considered financial advice.
Elliott Wave Analysis: S&P 500 (ES) Nearing Diagonal Wave 5 Completion
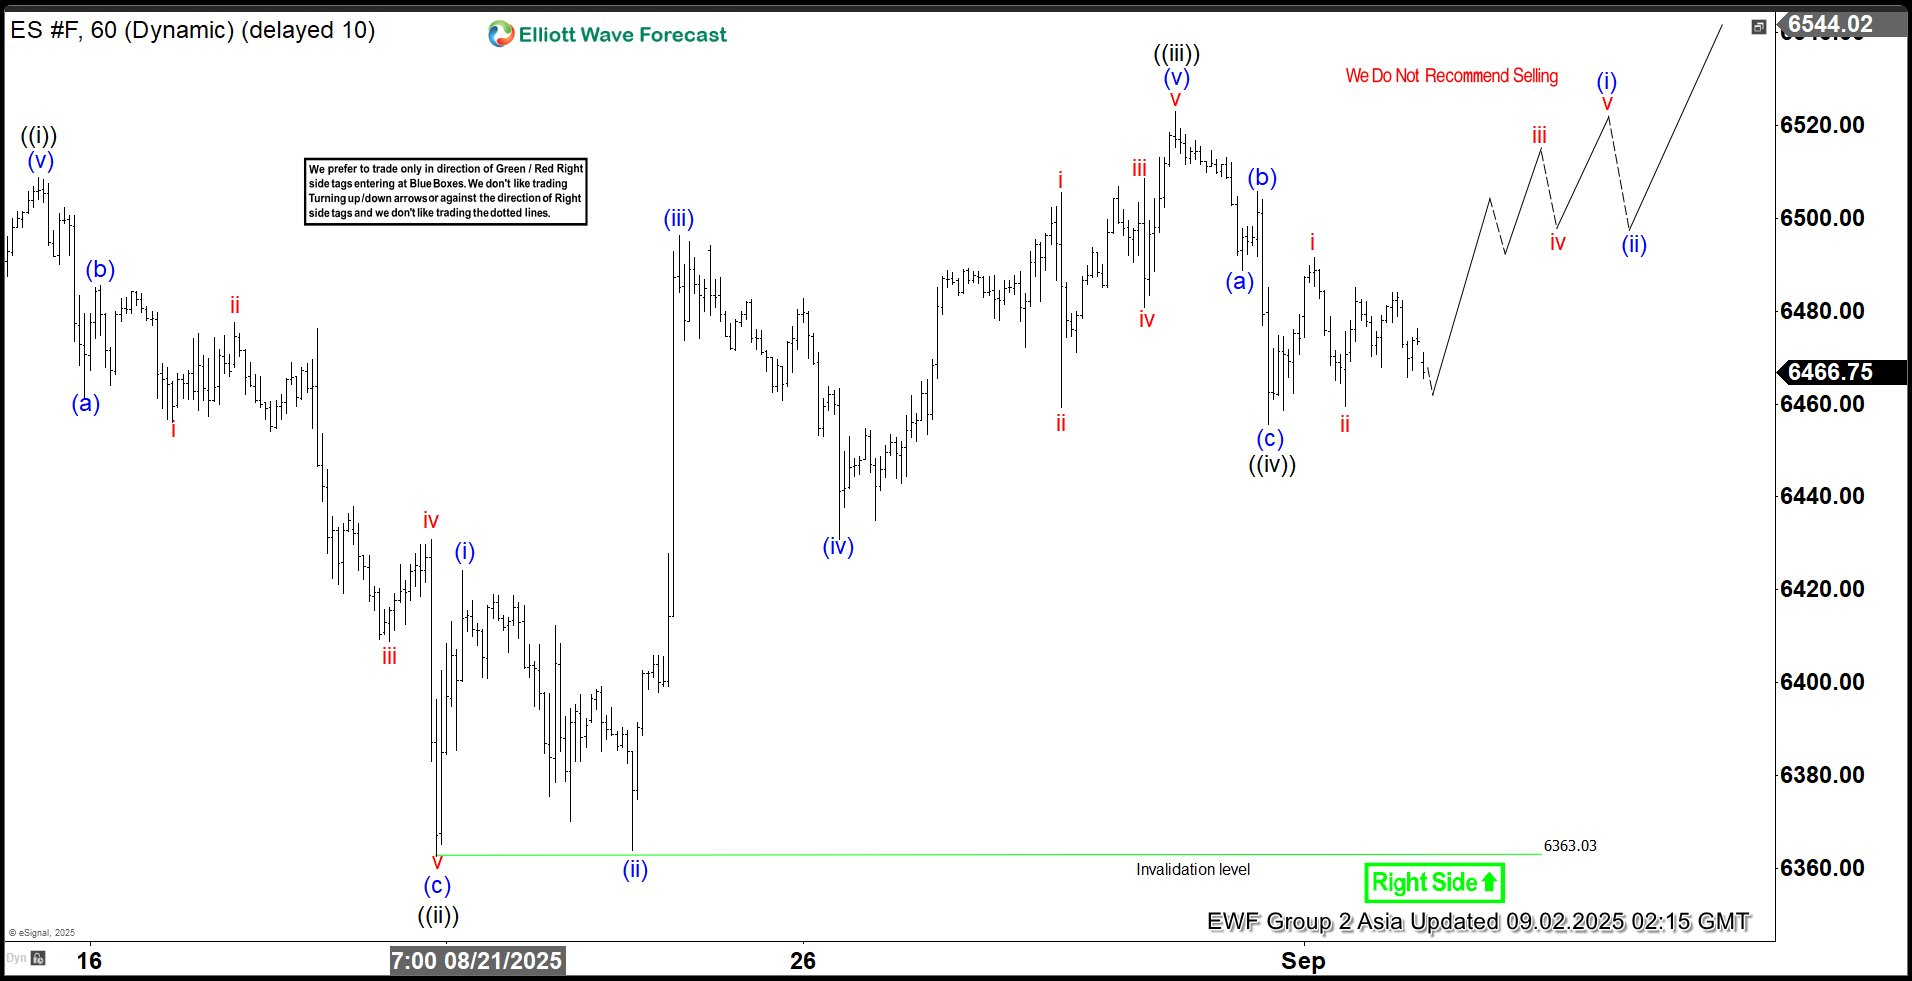
On August 2, the S&P 500 E-Mini futures (ES) pulled back to 6239.50, marking the low of wave 4. Wave 5, now underway, is unfolding as a five-wave diagonal pattern. A defining trait of a diagonal is the overlap between wave ((i)) and wave ((iv)) within its internal structure. From the wave 4 low, wave ((i)) peaked at 6508.75, followed by a retreat to 6362.75, concluding wave ((ii)). The index then resumed its upward trajectory in wave ((iii)), which itself contains a five-wave subdivision. From wave ((ii)), wave (i) reached 6424.25, and a brief dip to 6364 completed wave (ii).
The index climbed again in wave (iii) to 6496.25, with a subsequent pullback in wave (iv) ending at 6430.75. The final leg, wave (v), concluded at 6523, completing wave ((iii)). Wave ((iv)) then unfolded as a zigzag Elliott Wave structure. From wave ((iii)), wave (a) dropped to 6488.75, wave (b) rallied to 6505.75, and wave (c) declined to 6455.5, finalizing wave ((iv)). In the near term, as long as the pivot low at 6363 holds, any dips should find support in a 3, 7, or 11-swing pattern, setting the stage for further upside. This outlook supports continued bullish momentum in the index.
S&P 500 E-Mini Futures (ES) – 60 Minute Elliott Wave Technical Chart:
ES – Elliott Wave Technical Video:
https://www.youtube.com/watch?v=W7gpmMSjWJE
Any Labour Market Related Weakness Likely to Raise Bets for Fed Cuts
Markets
The absence of a meaningful economic calendar and US investors (Labour Day) resulted in uninspired trading at the start of the new month. Lingering legal concerns may have weighed on the dollar. They include Fed governor Lisa Cook’s case as well as a US appeals court’s ruling late Friday. The latter states that Trump overstepped his executive powers in using the 1977 International Emergency Economic Powers Act to impose amongst others the fentanyl and the reciprocal tariffs. The court allowed the IEEPA tariffs to remain in place through October 14 and the US administration will appeal to the Supreme Court in the meantime. The greenback lost ground against most major peers but closed above the intraday lows nevertheless. DXY eased to 97.77. EUR/USD was unable to hold the 1.17 into the close. European stock markets finished with slight gains, as did European yields. The German curve bear steeped with net daily changes between 1.5 bps to 2.4 bps. The French OAT/swapspread, in focus as PM Bayrou’s minority government faces near-certain defeat in next Monday’s confidence vote, stabilized near the recent highs.
US Treasury cash markets reopened in this morning’s Asian dealing with slight losses. The belly underperforms with yields adding around 3-3.5 bps in the 5-10yr bucket. Japanese yields (ex ultralong maturities) ease a few bps after a 10-yr auction drew the biggest demand in almost 2 years. The real test occurs later this week though, with Thursday’s 30-yr sale in focus. The dollar has a slight edge over its G10 peers. Legal issues (Cook, US tariffs) and politics (France) aside, the economic calendar is to flavour the trading session today. The US kicks off its lengthy economic update with the US manufacturing ISM gauge. It’s market importance is less than that of the services counterpart (Thursday), especially against the backdrop of other critical data points, including the payrolls, up for release this week, but it is nevertheless worth mentioning. Consensus expects a marginal improvement to a still below neutral 49 (from 48). The employment component is at the center of attention since Powell’s dovish pivot at Jackson Hole. Any labour market related weakness is likely to raise bets for Fed cuts, pressuring front-end yields and the dollar. We consider the bar to price out monetary easing, particularly for September (+/- 90% discounted), to be very high. European inflation numbers, seen at 0.1% m/m and 2.1% y/y, should come with little surprises after the national readings published over the last few days.
News & Views
US Treasury Secretary Bessent told the Washington Examiner that the Trump administration may declare a national housing emergency in the fall. He added that it would be a critical leg of Republicans’ 2026 mid-term election platform. Bessent said that the government is still trying to figure out what they can do without stepping into the business of local governments. Deregulation and environmental rollbacks (eg opening up federal land for housing development) could be part of the action plan. Other mechanisms might include federal funding mobilization or public-private partnerships. The dovish pivot of Fed chair Powell could also improve affordability via a more neutral monetary policy, though the jury is still out whether this will impact the (mortgage-related) very long end of the US yield curve.
The Association for Financial Markets in Europe calls in a new report on capital markets to relax cross-border regulations. AFME Pankas said that "banks operating cross-border within the union are suffering significantly from revenue declines due to a fragmented approach causing capital and liquidity to be locked up.” AFME estimates that national banking markets lock up €225bn of capital at big lenders. The ECB earlier estimated that about €250bn of liquid assets can’t move freely withing the banking union because of local regulations dating back to the aftermath of the financial crisis. The industry lobby also points to a deregulation swing by US and UK regulators which further harms the competitiveness of European lenders. It also refers to consistent decline of cross-border mergers between EU banks over the last two decades, limiting consolidation and efficiency gains.
EUR/USD Daily Outlook
Daily Pivots: (S1) 1.1655; (P) 1.1682; (R1) 1.1713; More...
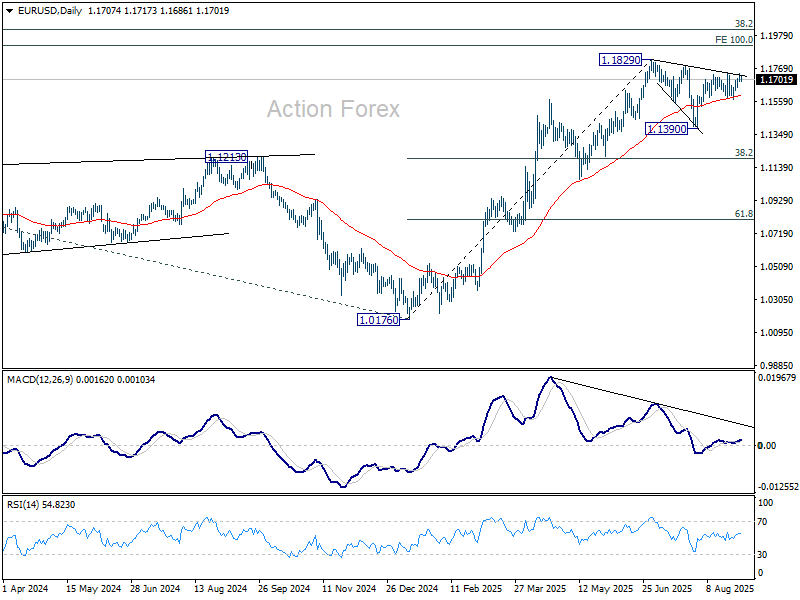
EUR/USD retreated ahead of 1.1741 resistance and intraday bias remains neutral for the moment. Overall outlook is unchanged that corrective fall from 1.1829 should have completed with three waves down to 1.1390. On the upside, above 1.1741 will bring retest of 1.1829 high first. Firm break there will resume larger up trend. However, sustained break of 1.1573 will dampen this view, and indicate that corrective pattern from 1.1829 is extending with another falling leg towards 1.1390 again.
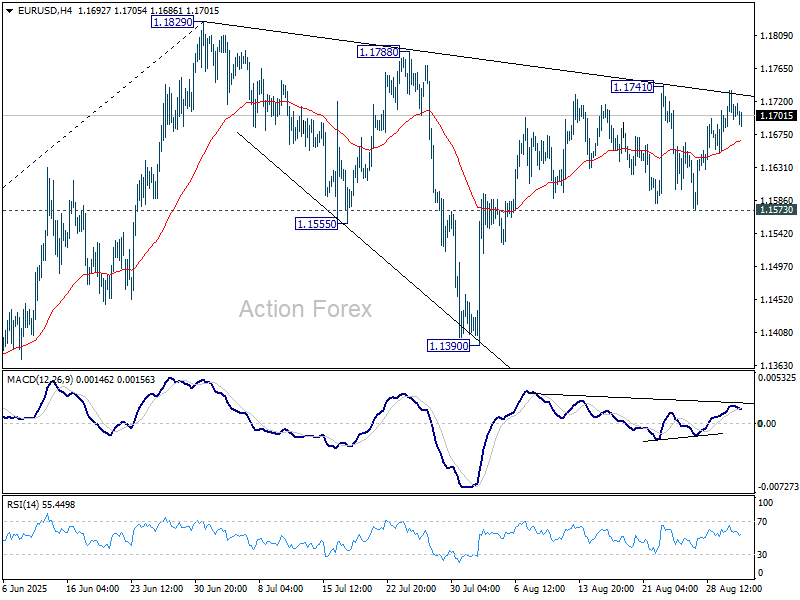
In the bigger picture, rise from 0.9534 (2022 low) long term bottom could be correcting the multi-decade downtrend or the start of a long term up trend. In either case, further rise should be seen to 100% projection of 0.9534 to 1.1274 from 1.0176 at 1.1916. This will remain the favored case as long as 1.1604 support holds.
USD/JPY Daily Outlook
Daily Pivots: (S1) 146.85; (P) 147.12; (R1) 147.44; More...
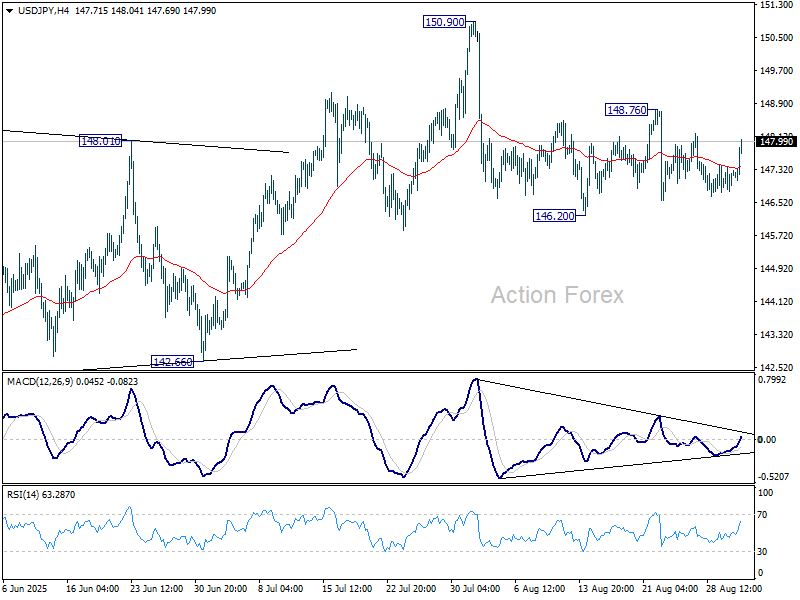
USD/JPY rebounds notably today but stays in range of 146.20/148.76. Intraday bias remains neutral for the moment. On the upside, firm break of 148.76 will suggest that pullback from 150.90 has completed as a correction. Intraday bias will be back on the upside for retesting 150.90. On the downside, firm break of 146.20 will resume the decline from 150.90. More importantly, that would also argue that rebound from 139.87 has completed as a corrective move to 150.90. Deeper fall should be seen to 142.66 support for confirmation.
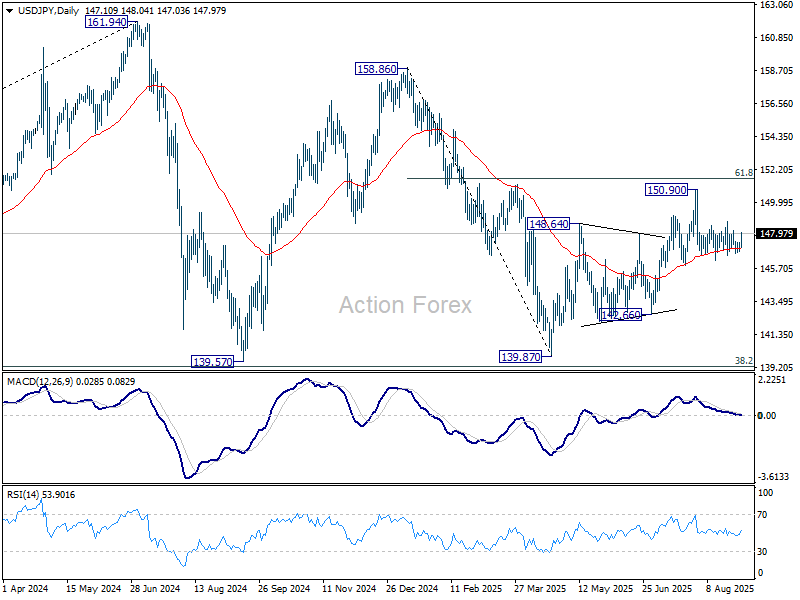
In the bigger picture, price actions from 161.94 (2024 high) are seen as a corrective pattern to rise from 102.58 (2021 low). Decisive break of 61.8% retracement of 158.86 to 139.87 at 151.22 will argue that it has already completed with three waves at 139.87. Larger up trend might then be ready to resume through 161.94 high. In case the corrective pattern extends with another fall, strong support is expected from 38.2% retracement of 102.58 to 161.94 at 139.26 to bring rebound.
GBP/USD Daily Outlook
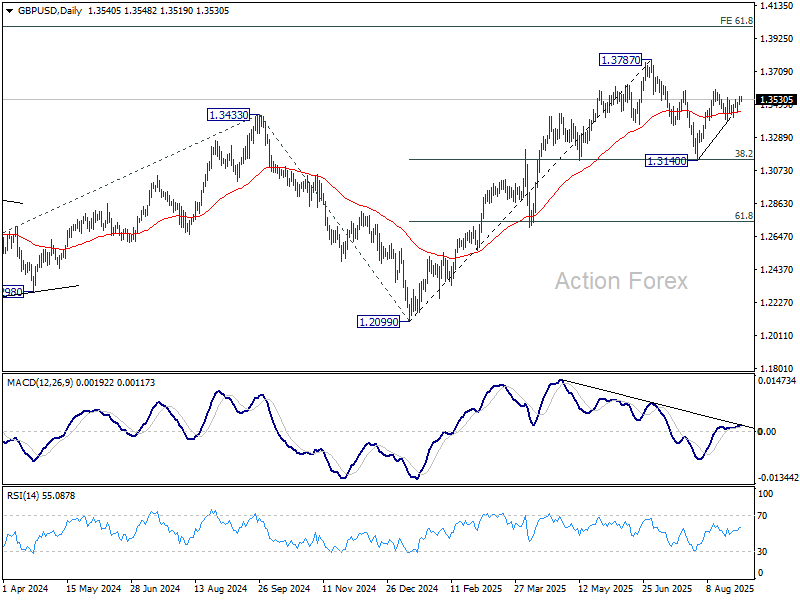
Daily Pivots: (S1) 1.3510; (P) 1.3530; (R1) 1.3566; More...
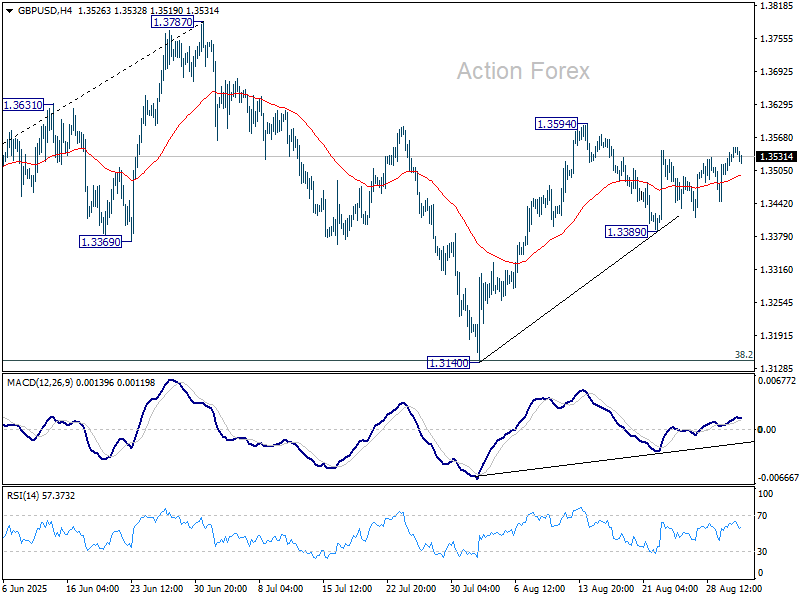
GBP/USD is still bounded in range below 1.3594 and intraday bias stays neutral. With 1.3389 support intact, further rally is in favor. On the upside, above 1.3594 will resume the rebound from 1.3140 to retest 1.3787 high. On the downside, however, break of 1.3389 support will extend the corrective pattern from 1.3787 with another fall, and target 1.3140 support.
In the bigger picture, up trend from 1.3051 (2022 low) is in progress. Next medium term target is 61.8% projection of 1.0351 to 1.3433 from 1.2099 at 1.4004. Outlook will now stay bullish as long as 55 W EMA (now at 1.3104) holds, even in case of deep pullback.
USD/CHF Daily Outlook
Daily Pivots: (S1) 0.7988; (P) 0.8002; (R1) 0.8019; More….
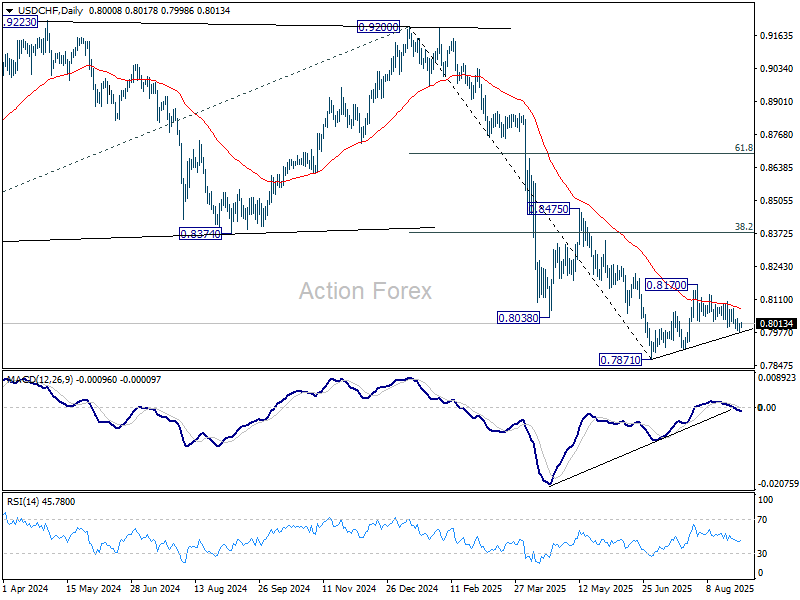
USD/CHF recovered after edging lower to 0.7984 and intraday bias is turned neutral first. The current favored case is that corrective rebound from 0.7871 has completed at 0.8170. Below 0.7984 will target 0.7910 support, and then retest 0.7871. However, break of 0.8103 resistance will turn bias to the upside to resume the rebound from 0.7871 through 0.8170.
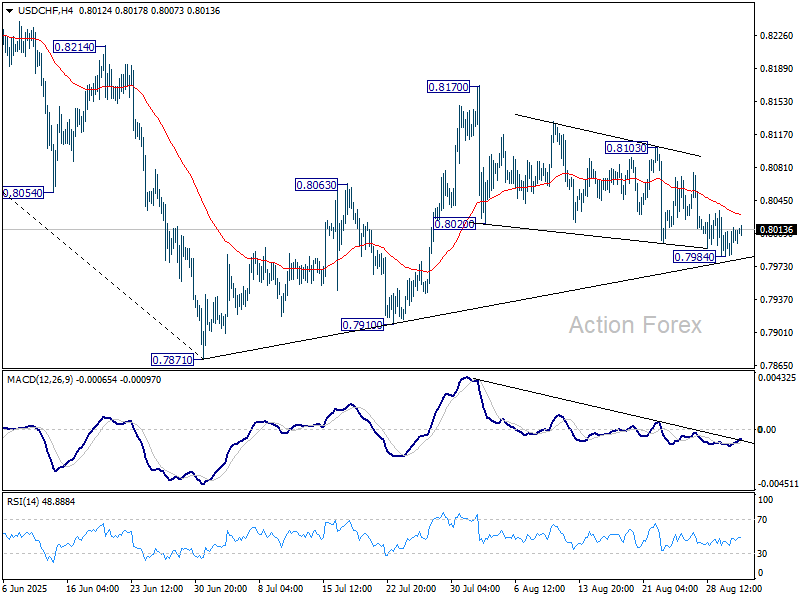
In the bigger picture, long term down trend from 1.0342 (2017 high) is still in progress. Next target is 100% projection of 1.0146 (2022 high) to 0.8332 from 0.9200 at 0.7382. In any case, outlook will stay bearish as long as 0.8475 resistance holds.