

Sample Category Title
USD/CHF Mid-Day Outlook
Daily Pivots: (S1) 0.7983; (P) 0.8010; (R1) 0.8034; More….
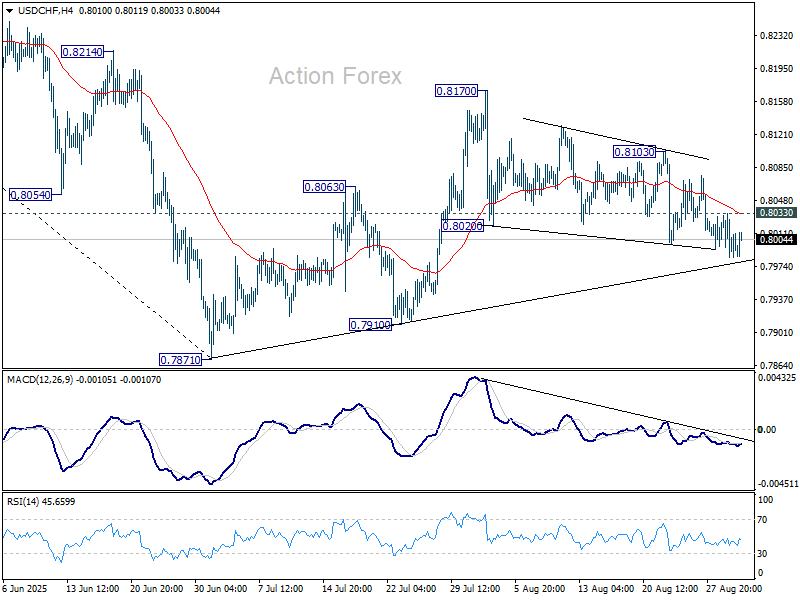
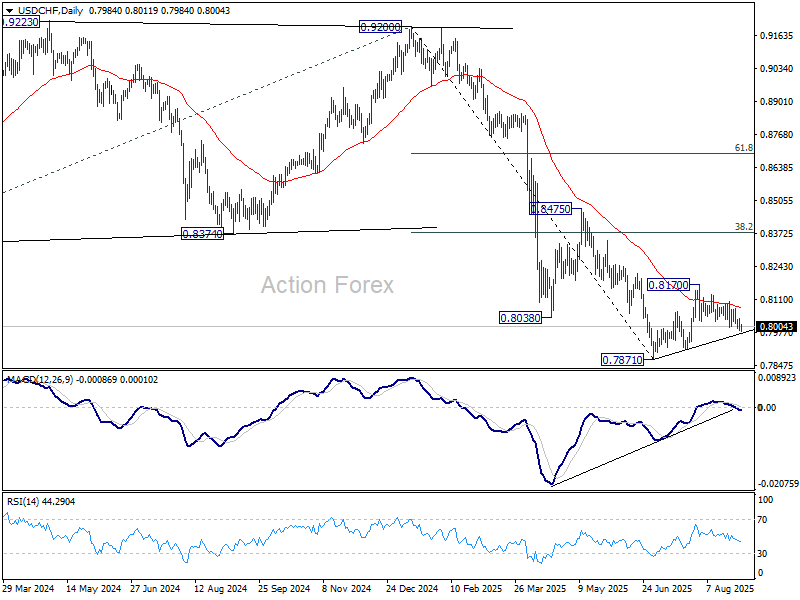
Intraday bias in USD/CHF stays mildly on the downside. The current favored case is that corrective rebound from 0.7871 has completed at 0.8170. Deeper fall would be seen to 0.7910 support, and then retest 0.7871. Nevertheless, break of 0.8033 minor resistance will dampen this bearish view and turn intraday bias neutral again first.
In the bigger picture, long term down trend from 1.0342 (2017 high) is still in progress. Next target is 100% projection of 1.0146 (2022 high) to 0.8332 from 0.9200 at 0.7382. In any case, outlook will stay bearish as long as 0.8475 resistance holds.
GBP/USD Mid-Day Outlook
Daily Pivots: (S1) 1.3459; (P) 1.3490; (R1) 1.3534; More...
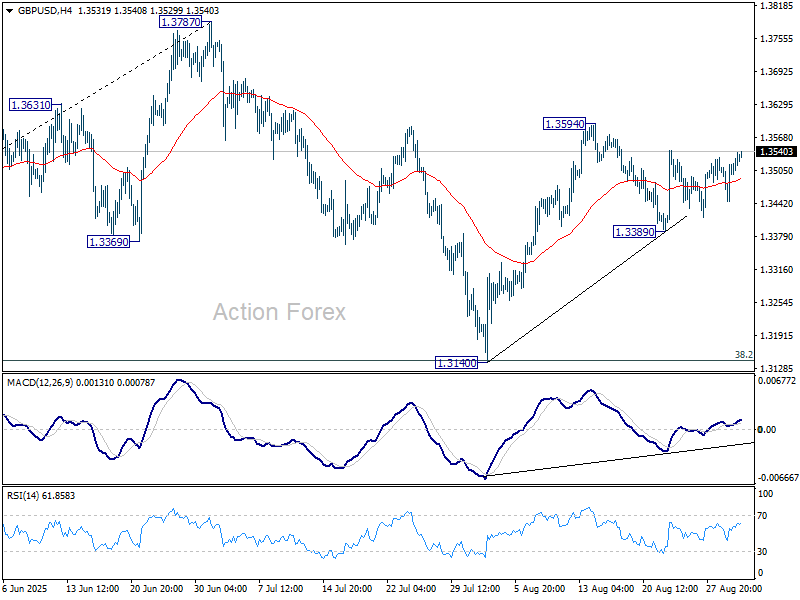
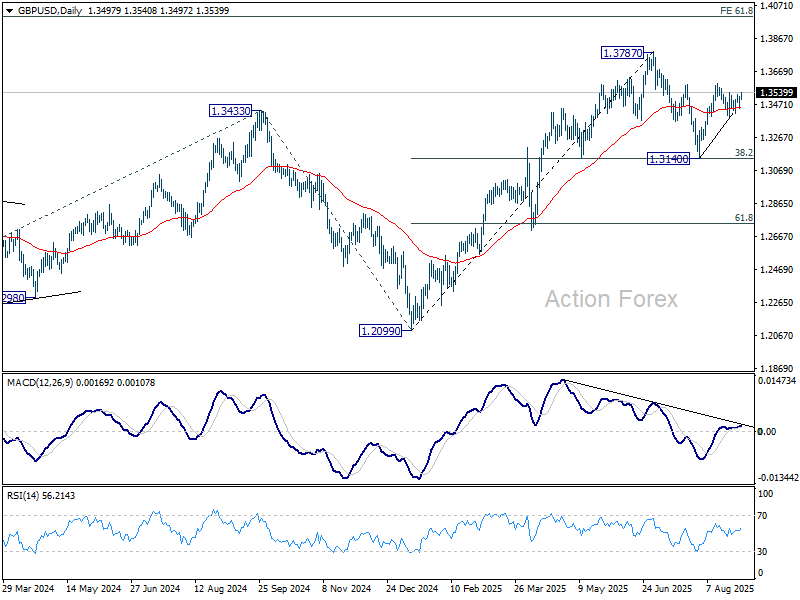
Range trading continues in GBP/USD and intraday bias remains neutral. With 1.3389 support intact, further rally is in favor. On the upside, above 1.3594 will resume the rebound from 1.3140 to retest 1.3787 high. On the downside, however, break of 1.3389 support will extend the corrective pattern from 1.3787 with another fall, and target 1.3140 support.
In the bigger picture, up trend from 1.3051 (2022 low) is in progress. Next medium term target is 61.8% projection of 1.0351 to 1.3433 from 1.2099 at 1.4004. Outlook will now stay bullish as long as 55 W EMA (now at 1.3104) holds, even in case of deep pullback.
EUR/USD Mid-Day Outlook
Daily Pivots: (S1) 1.1655; (P) 1.1682; (R1) 1.1713; More...
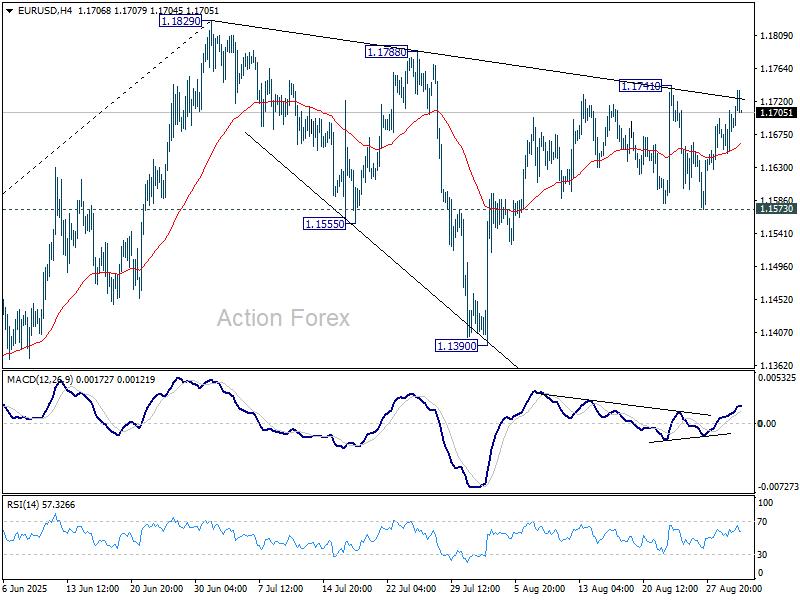
EUR/USD continues to struggle to break through 1.1741 resistance and intraday bias stays neutral Overall outlook is unchanged that corrective fall from 1.1829 should have completed with three waves down to 1.1390. On the upside, above 1.1741 will bring retest of 1.1829 high first. Firm break there will resume larger up trend. However, sustained break of 1.1573 will dampen this view, and indicate that corrective pattern from 1.1829 is extending with another falling leg towards 1.1390 again.
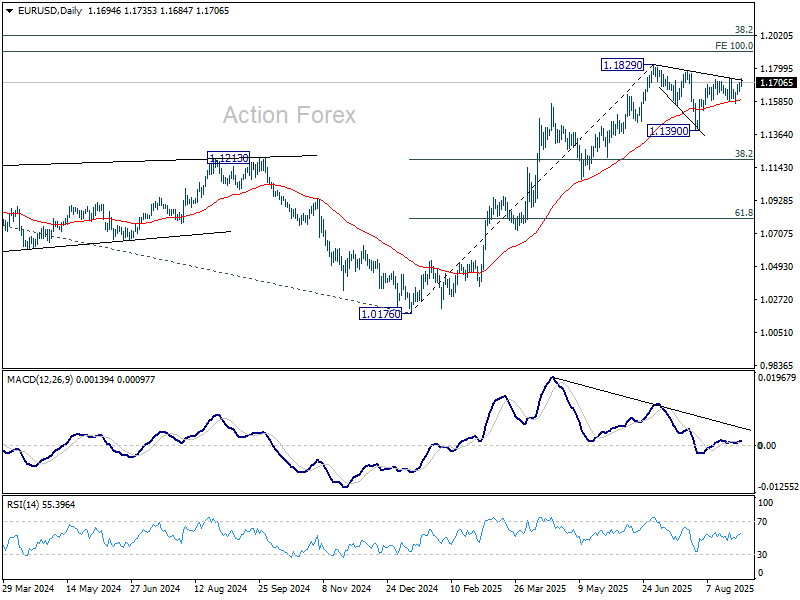
In the bigger picture, rise from 0.9534 (2022 low) long term bottom could be correcting the multi-decade downtrend or the start of a long term up trend. In either case, further rise should be seen to 100% projection of 0.9534 to 1.1274 from 1.0176 at 1.1916. This will remain the favored case as long as 1.1604 support holds.
Euro Leads But French Politics Cap Gains, Dollar Mixed
Euro is leading the foreign exchange market today, staging a solid recovery from last week’s weakness. Investors are clearly positioning back into the single currency, but the rally has yet to find a convincing fundamental driver, leaving momentum somewhat constrained.
Political uncertainty in France is also serving as a cap on Euro gains. The minority government of Prime Minister Francois Bayrou faces a high-stakes confidence vote on September 8 over its budget plans for 2026. With opposition parties aligned against the austerity package, defeat is seen as highly likely.
Still, markets are not turning bearish on the Euro purely on political grounds. Historically, domestic instability within one Eurozone member weighs heavily on the currency only when there are signs of contagion spreading across the bloc. At this stage, broader Eurozone fundamentals remain stable, and no such contagion is evident.
Dollar, meanwhile, is trading on the softer side but also lacks decisive momentum. Traders are cautious ahead of a heavy week of U.S. releases, with Friday’s nonfarm payrolls at the center of attention. The risk is skewed toward further Dollar weakness if data fall short, forcing the Fed to act more forcefully than the current market pricing suggests. For now, however, markets are waiting rather than moving aggressively.
In today’s performance table, Euro tops the leaderboard so far, followed by Sterling and Aussie. Yen is the weakest, trailed by Swiss Franc and Loonie, while the greenback and Kiwi are mixed in the middle.
In Europe, at the time of writing, FTSE is up 0.15%. DAX is up 0.41%. CAC is up 0.02%. UK 10-year yield is up 0.029 at 4.752. Germany 10-year yield is up 0.029 at 2.756. Earlier in Asia, Nikkei fell -1.24%. Hong Kong HSI rose 2.15%. China Shanghai SSE rose 0.46%. Singapore Strait Times rose 0.15%. Japan 10-year JGB yield rose 0.02 to 1.625.
ECB's Lagarde warns on Fed independence, tariff uncertainty
ECB President Christine Lagarde issued a stark warning today, saying it would be “very worrying” if U.S. President Donald Trump succeeded in his efforts to exert control over the Fed.
In an interview with Radio Classique, Lagarde stressed "if US monetary policy were no longer independent and instead dependent on the dictates of this or that person, then I believe that the effect on the balance of the American economy could, as a result of the effects this would have around the world, be very worrying, because it is the largest economy in the world,"
Lagarde added that Friday’s U.S. appeals court ruling, which declared most of Trump’s tariffs illegal, created a “further layer of uncertainty” for the global economic outlook. The combination of policy unpredictability in Washington and structural risks elsewhere leaves investors wary at a time when global growth is already under strain from weak trade flows and tariff disputes.
Turning to domestic matters, Lagarde addressed mounting political risk in France ahead of the September 8 confidence vote. Opposition parties have pledged to bring down Prime Minister Francois Bayrou’s minority government over unpopular budget squeeze plans for 2026. The political drama has hit French bonds and equities, raising questions about the stability of the Eurozone’s second-largest economy.
Lagarde stressed, however, that France’s banking system is not at the root of the problem. She noted that banks are far better capitalised and structured than during the 2008 financial crisis, and remain responsibly managed. Still, she acknowledged that markets are sensitive to political shocks, and that uncertainty around government stability continues to weigh on risk sentiment.
Eurozone unemployment rate eases to 6.2% in July, matches expectations
Eurozone unemployment edged down to 6.2% in July from 6.3% in June, in line with expectations. The broader EU rate slipped from 6.0% to 5.9%, according to Eurostat.
Eurostat estimated 13.025 million unemployed across the EU in July, including 10.805 million in the Eurozone. Compared with June, jobless figures fell by -165k in the EU and -170k in the Eurozone.
China RatingDog PMI manufacturing rises to 50.5, relief rally rather than turning point
China’s manufacturing sector showed a modest improvement in August, with the RatingDog Manufacturing PMI rising from 49.5 to 50.5, beating expectations of 49.9 and returning to expansion. However, RatingDog described the uptick as a “breath of relief rather than a sustained rally,” reflecting cautious optimism. By contrast, the official NBS survey offered a more subdued view, with manufacturing inching up from 49.3 to 49.4 and non-manufacturing steady at 50.3.
The RatingDog report highlighted firmer new orders, which pushed inventories of raw materials and finished goods higher. Export demand remains weak but showed slower contraction. Yao cautioned that external demand may have been pulled forward while domestic demand stays soft, limiting the scope for sustained output gains without stronger local consumption.
Meanwhile, input costs continued to climb under the “Anti-involution” policy backdrop, and those upstream pressures are now filtering into output prices, ending an eight-month streak of falling charges. With profit recovery still slow, the durability of the latest rebound depends on whether exports can stabilize further and domestic demand begins to catch up.
EUR/USD Mid-Day Outlook
Daily Pivots: (S1) 1.1655; (P) 1.1682; (R1) 1.1713; More...
EUR/USD continues to struggle to break through 1.1741 resistance and intraday bias stays neutral Overall outlook is unchanged that corrective fall from 1.1829 should have completed with three waves down to 1.1390. On the upside, above 1.1741 will bring retest of 1.1829 high first. Firm break there will resume larger up trend. However, sustained break of 1.1573 will dampen this view, and indicate that corrective pattern from 1.1829 is extending with another falling leg towards 1.1390 again.
In the bigger picture, rise from 0.9534 (2022 low) long term bottom could be correcting the multi-decade downtrend or the start of a long term up trend. In either case, further rise should be seen to 100% projection of 0.9534 to 1.1274 from 1.0176 at 1.1916. This will remain the favored case as long as 1.1604 support holds.
EUR/USD Technical: Euro on the Brink of a Medium-Term Bullish Breakout
Since our last publication, the EUR/USD has indeed shaped the expected minor bullish breakout above the highlighted 1.1520 short-term pivotal support and hit the 1.1680/1.1705 short-term resistance. It rallied by 1.6% to print an intraday high of 1.1730 on 13 August 2025.
Let’s now examine its latest technical elements to determine its next potential trajectory and key levels.
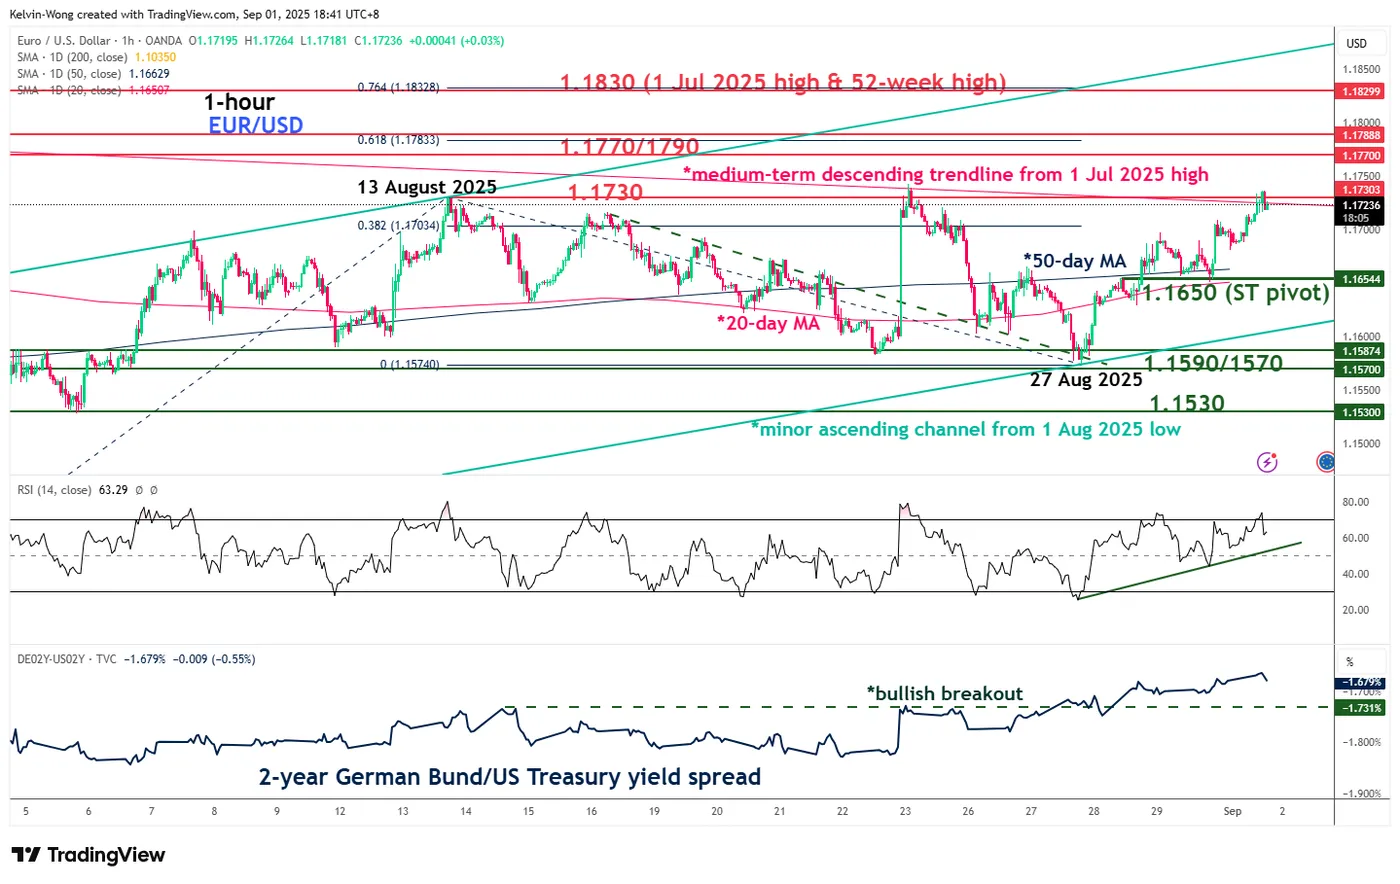
Fig. 1: EUR/USD minor trend as of 1 Sep 2025 (Source: TradingView)
Preferred trend bias (1-3 days)
After shaping a minor corrective range configuration from 13 August 2025 high of 1.1730 to 27 August 2025 low of 1.1574, the EUR/USD is likely to kickstart a potential fresh medium-term bullish impulsive up move sequence.
Bullish bias above 1.1650 key short-term pivotal support. A clearance above 1.1730 intermediate resistance reinforces the bullish tone for the next intermediate resistances to come in at 1.1770/1790 and 1.1830 (also a Fibonacci extension) in the first step.
Key elements
- Price actions of the EUR/USD have started to trade back above its 20-day and 50-day moving averages since last Thursday, 28 August 2025.
- The EUR/USD has oscillated within a minor ascending channel in place since the 1 August 2025 low of 1.1392.
- The hourly RSI momentum indicator has continued to oscillate above a parallel ascending trendline above the 50 level, which short-term bullish momentum is likely intact.
- The yield spread between the 2-year German Bund and the US Treasury note broke higher on Thursday, 28 August, narrowing the differential to –1.68% from –1.82% on 22 August. This development indicates a relative decline in the yield attractiveness of the 2-year US Treasury versus its German counterpart, which in turn exerts downside pressure on the US dollar against the euro.
Alternative trend bias (1 to 3 days)
A break below 1.1650 support negates the bullish tone on the EUR/USD to see another round of minor corrective decline for a retest on the next intermediate support at 1.1590/1.1570 (also the 27 August 2025 swing low area).
EUR/USD Gains Ground Amid Fresh Doubts Over the Fed
The EUR/USD pair rose to 1.1704 on Monday. The US dollar is trading near one-month lows as the market awaits a series of US labour market reports. These figures could influence the Federal Reserve's upcoming policy decisions.
The key event will be Friday's August employment report, alongside data on the unemployment rate, job openings, and private sector employment.
Investors continue to assess Friday's release of the Personal Consumption Expenditures (PCE) index. It confirmed rising prices and heightened uncertainty regarding the pace of future interest rate cuts. Nevertheless, the market is pricing in an approximately 88% probability of a 25-basis-point Fed rate cut this month.
On the trade front, a federal appeals court ruled that the majority of former President Donald Trump's retaliatory tariffs were unlawful, giving the administration until 14 October to appeal to the US Supreme Court.
Trading activity at the start of the week is expected to be subdued due to the US market closure for the Labor Day holiday.
Technical Analysis: EUR/USD
H4 Chart:
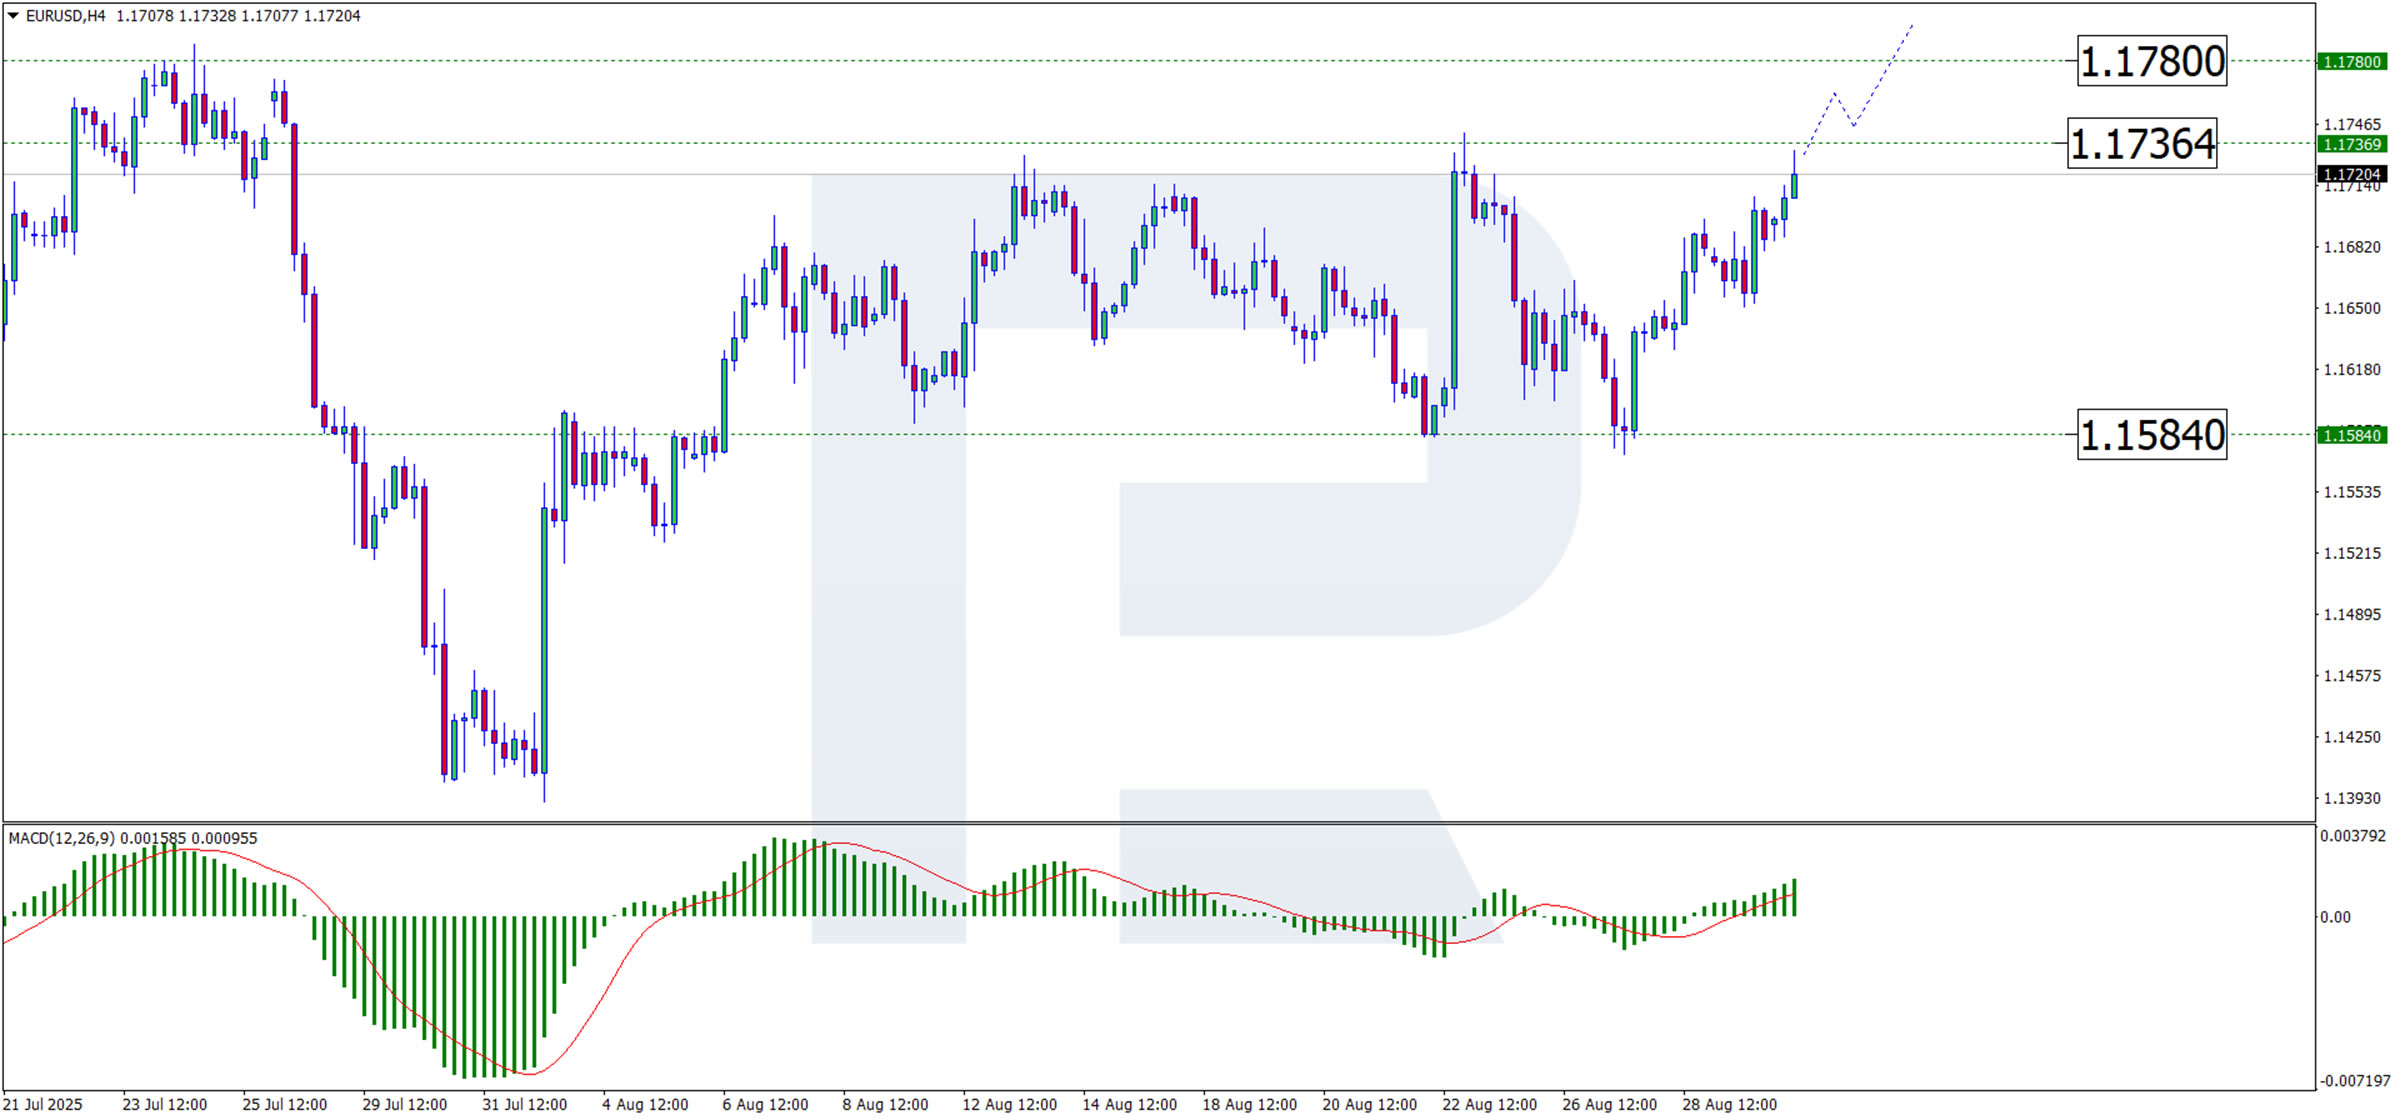
On the H4 chart, EUR/USD has formed an upward wave towards the upper boundary of the sideways channel at 1.1736. A breakout above this resistance level could signal the start of a new upward trend. However, a pullback within a corrective wave is possible, which would see the breached resistance level retested as new support. This scenario is supported by the MACD indicator, whose histogram and signal line are above zero and continue to rise. This momentum suggests the upward trend is likely to persist towards the 1.1780 level, with potential corrections along the way.
H1 Chart:
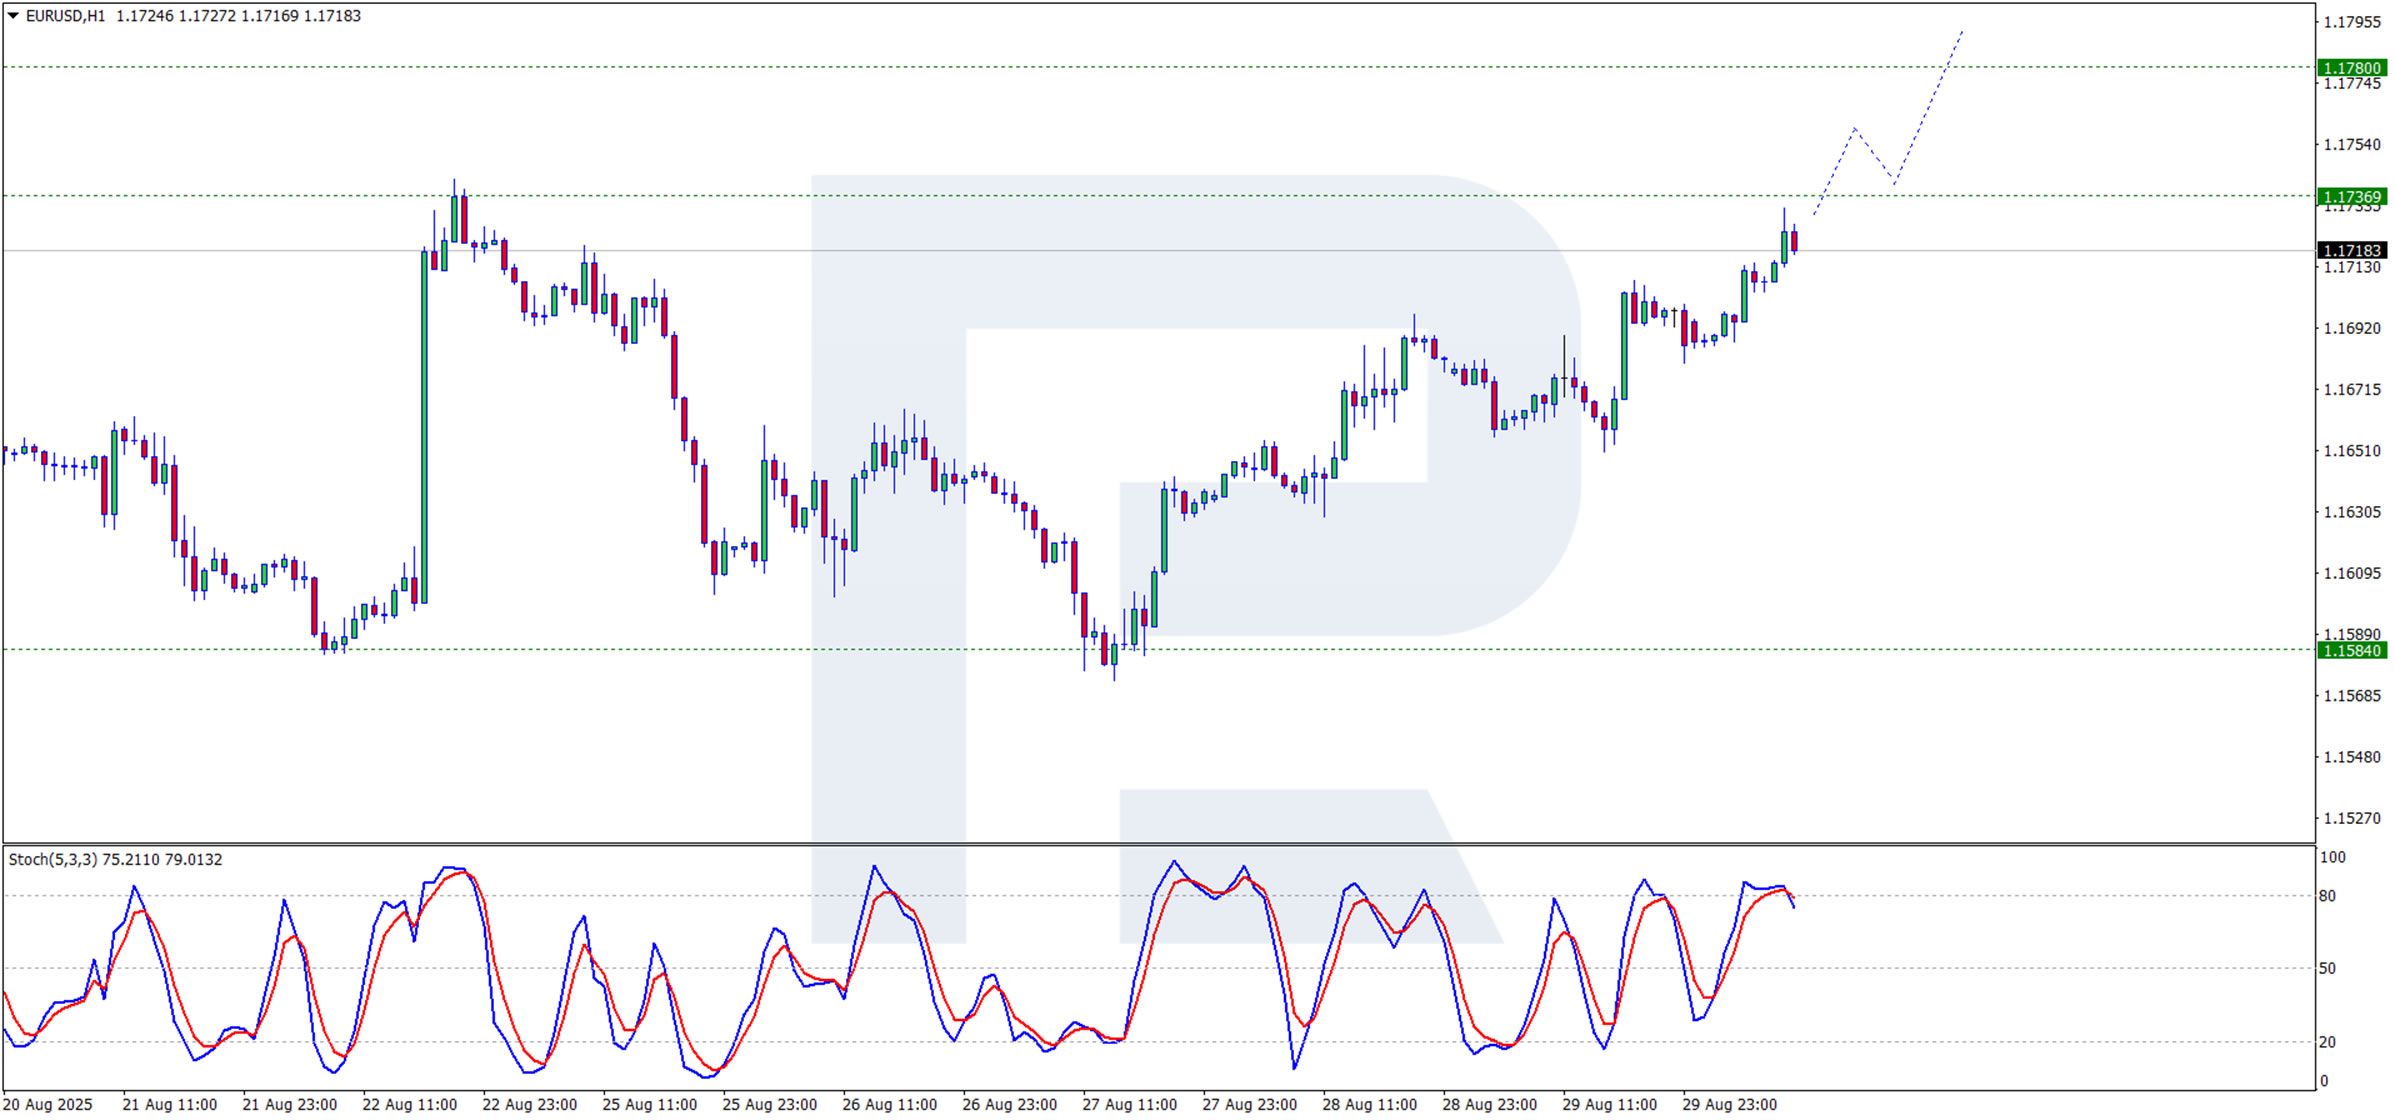
On the H1 chart, the pair is forming a correction as it tests the resistance level. A breakout above this resistance would indicate a resumption of the upward wave. The signal line of the Stochastic oscillator is crossing above the 80 level, signalling a potential short-term correction before the upward trend potentially continues.
Conclusion
The pair is benefiting from a weaker dollar as market participants reassess the Fed's policy trajectory. All attention is now on the upcoming US labour market data, which will be crucial for determining the pair's short-term direction. Technically, the outlook remains bullish, with a break above key resistance needed to confirm further gains.
Dollar Index: Dollar Remains Weak on Fed Rate Cut Expectations
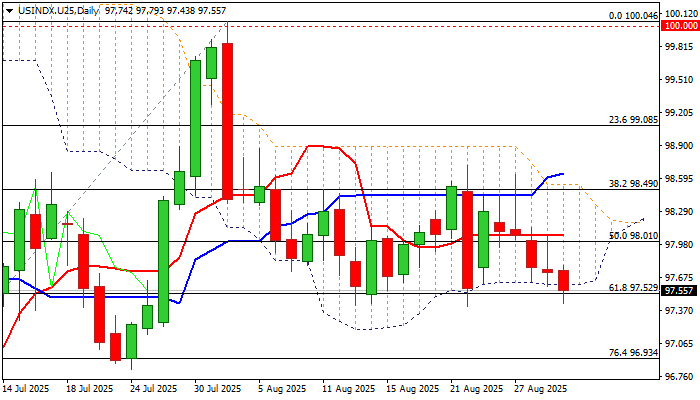
The dollar index remains in red for the fifth straight day and probes again through key supports at $97.61/52 (daily cloud base / Fibo 61.8% of 95.97/100.04) which have so far contained a number of attacks and marks solid supports.
The dollar keeps negative tone on rising bets for Fed rate cut in September (the latest dovish comments from two Fed policymakers added to the outlook), as well as the most recent political turmoil in the US after President Trump’s attempt to fire Fed Governor Cook and court ruling that most of Trump’s tariffs are illegal.
However, markets are likely to be more cautious ahead of releases of key economic (US August labor data) that will be in focus this week for the final signal ahead of Fed’s September policy meeting.
US labor sector showed significant signs of slowing in past couple of months that is now Fed’s biggest worry, after Chair Powell said that elevated inflation is likely to be a temporary phenomenon.
Economists expect significant drop in job openings and private sector hiring (JOLTS / ADP) but predict that non-farm payrolls will remain almost unchanged and unemployment tick higher.
Disappointing NFP would be the last signal confirming September rate cut and open prospects for potential further easing towards the end of the year.
In such scenario, pressure on greenback will increase, with firm break of cloud base / Fibo triggers to expose next targets at $96.93/82 (Fibo 76.4% / July 24 higher low).
Conversely, upbeat August NFP (unlikely scenario) would provide temporary relief, but not expected to result in major dollar’s direction changes.
Res: 97.61; 98.01; 98.15; 98.49.
Sup: 97.41; 97.15; 96.93; 96.48.
XAG/USD: Silver Surges Through $40 and Hits the Highest Since 2011
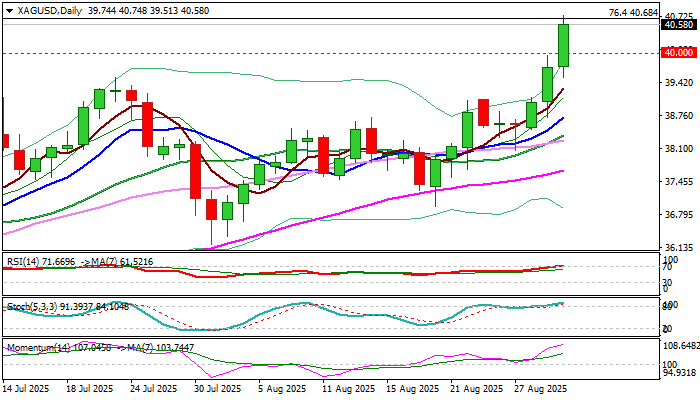
Silver accelerated higher at the start of the week (up over 2% in Asia / early Europe on Monday) and broke above psychological $40 barrier for the first time in over a decade.
Fresh gains hit the highest since April 2011 and cracked Fibo barrier at $40.68 (76.4% of larger $49.78/$11.23 downtrend, 2011/2020), in extension of steep upleg from $38.07 (Aug 27 higher low).
Silver received fresh boost from growing expectations of Fed rate cut in September, showing stronger reaction to the latest news than gold, with tight supply also contributing to the rally.
Daily close above $40 is needed to confirm strong bullish stance, though bulls started to face headwinds at $40.68 Fibo barrier, due to overbought daily studies.
In current environment, dips should be limited and mark positioning for fresh advance, with broken $40 level reverting to solid support, along with former multi-year top at $39.52, where dips should find firm ground.
Sustained break of $40 barrier and Fibo level at $40.68, to generate strong bullish signal and unmask targets at $43.38/$44.18 (highs of Sep / Aug 2011 respectively).
Res: 40.74; 41.00; 41.57; 42.00.
Sup: 40.00; 39.52; 39.09; 38.72.
Bitcoin Price Chart Analysis: Are the Bulls Lifting Their Heads?
The second half of August proved a testing time for cryptocurrency enthusiasts. After hitting a record peak of around $124k on 14 August, the BTC/USD rate fell by roughly 13% by the end of the month.
Several factors may have contributed to this decline, including the perception of cryptocurrencies as a risky asset:
→ The US economy showed worrying signs of stagflation (slowing job growth combined with persistent core inflation).
→ Media commentary suggested the market was overheated, with hints of a bubble forming amid the hype surrounding AI.
Technical Analysis of BTC/USD
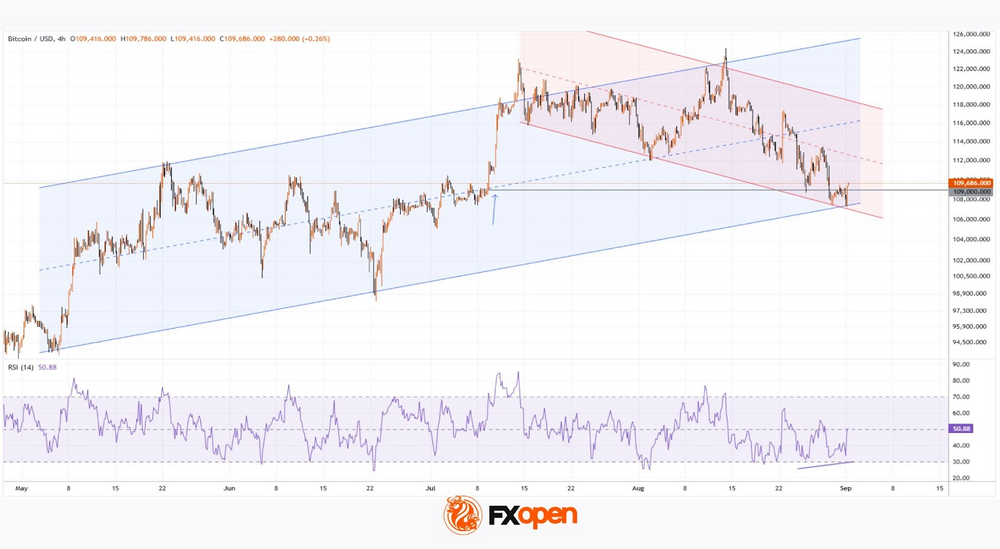
On 11 August, when analysing Bitcoin’s price, we extended the long-term upward channel (marked in blue) and suggested that the price might attempt to surpass its previous all-time high.
That expectation came true—but how might events unfold next?
While the upward blue channel (in place since spring 2025) remains valid, the chart also shows the outlines of a descending trajectory (marked in red)—a clear sign of bearish strength, with sellers demonstrating their ability to push prices down.
Attention should also be given to the $109k level. In mid-July, bears suffered a crushing defeat here, unable to counter a sharp rally (shown by the arrow). Therefore, we could expect some hesitancy from them around this area—something reflected in August price action:
→ On the 26th, the level acted as support.
→ On the 29th, bears managed to break through it.
→ Yet today, Bitcoin has climbed back above this level, forming a bullish double bottom pattern.
Given that the RSI indicator is showing a series of bullish divergences, and the lower boundary of the blue channel is reinforced by bullish price action near the $109k level, Bitcoin could remain within this multi-month channel. The next near-term target could be a recovery towards the median of the red channel.
FXOpen offers the world's most popular cryptocurrency CFDs*, including Bitcoin and Ethereum. Floating spreads, 1:2 leverage — at your service. Open your trading account now or learn more about crypto CFD trading with FXOpen.
*Important: At FXOpen UK, Cryptocurrency trading via CFDs is only available to our Professional clients. They are not available for trading by Retail clients. To find out more information about how this may affect you, please get in touch with our team.
This article represents the opinion of the Companies operating under the FXOpen brand only. It is not to be construed as an offer, solicitation, or recommendation with respect to products and services provided by the Companies operating under the FXOpen brand, nor is it to be considered financial advice.
Crypto Market Continues to Send Alarming Signals
Market Overview
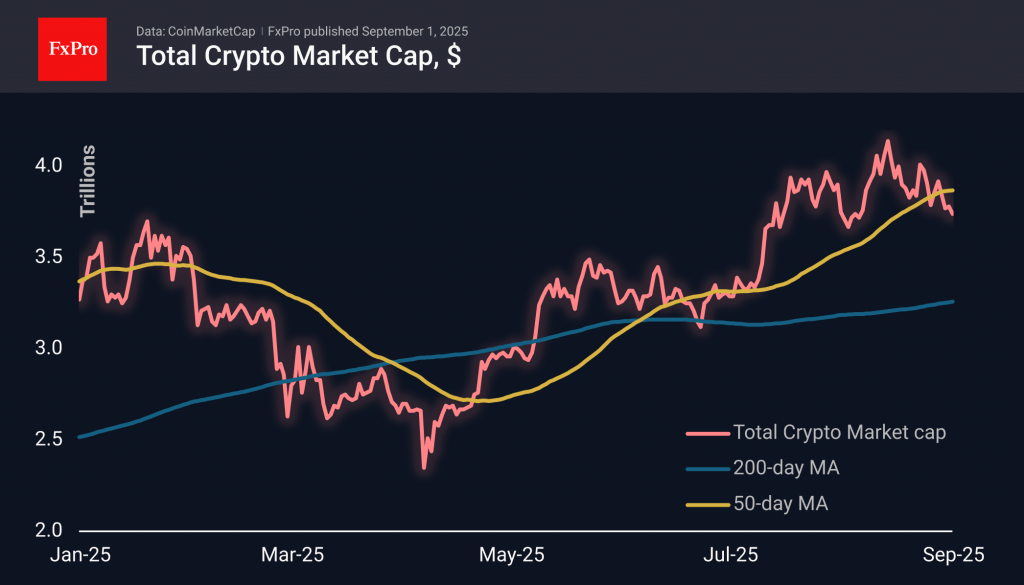
The cryptocurrency market capitalisation has fallen by 3.4% over the past seven days to $3.74 trillion, its lowest level in three and a half weeks. The total capitalisation chart continues to record a series of lower lows, signalling a downward trend. A break below the 50-day moving average reinforces this signal, confirming the medium-term downward trend.
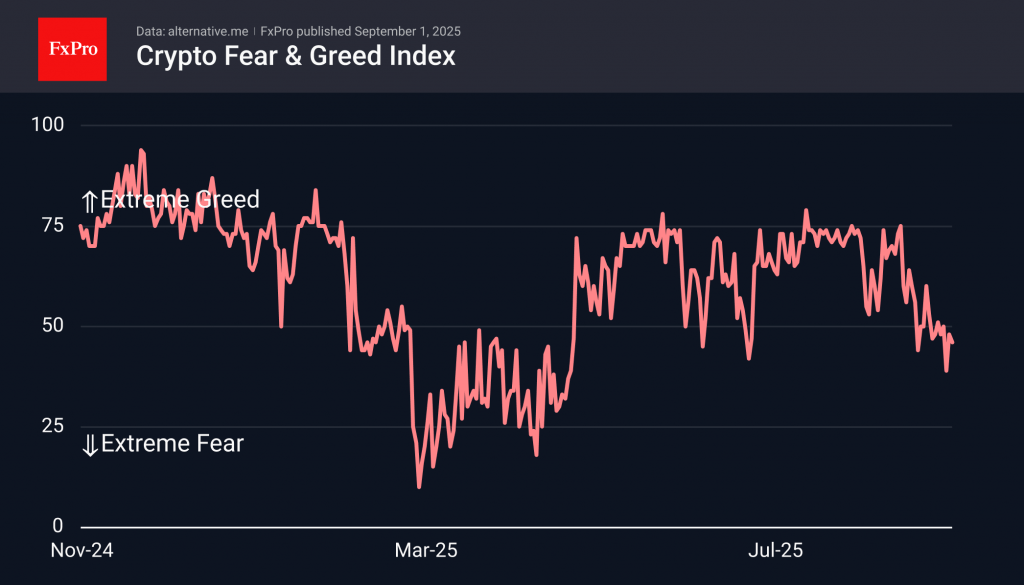
The sentiment index, at 46, is easily touching fear territory. It fell to 39 at the start of the day on Saturday, the lowest level since the end of April. Given how often cryptocurrencies are the first to react to changes in investor sentiment, such a dip looks like a harbinger of difficult weeks ahead for stocks.
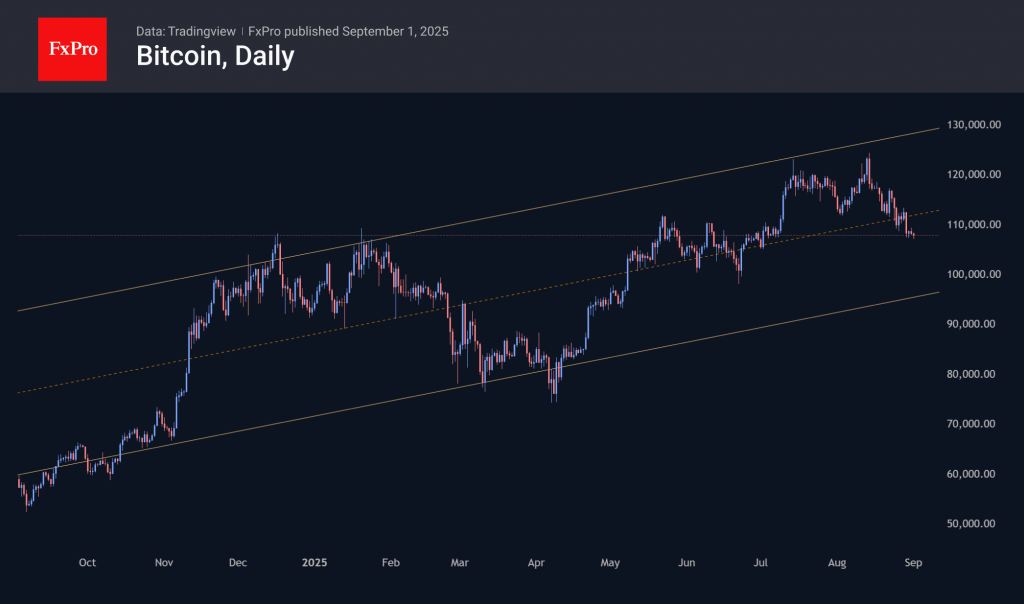
On Monday morning, Bitcoin briefly fell below $107K, its lowest level since early July. On daily timeframes, BTC is approaching but has not yet entered oversold territory, retaining the potential for further decline. Some support from bulls can be expected around the $105K price point, as this has been a resistance level for many months. This area also appears to be the last line of defence before the psychologically important $100K level, the breach of which could trigger panic selling.
News Background
September, along with August, is considered one of the two most unfavourable months for BTC. It has declined nine times in the last 14 years, with an average decline of 12.7% and an average growth of 9.2%. Meanwhile, the last two years have been successful for Bitcoin.
Weekly inflows into spot Bitcoin ETFs in the US resumed, amounting to $440.7 million last week. Total inflows since the approval of Bitcoin ETFs in January 2024 have increased to $54.24 billion.
Weekly inflows into spot Ethereum ETFs in the US also resumed after a noticeable outflow a week earlier, amounting to $1.08 billion. Total net inflows since the launch of ETFs in July 2024 have grown to $13.51 billion.
Spot Bitcoin ETFs in the US have almost caught up with the largest exchanges in terms of trading volume, becoming one of the main ways for investors to buy BTC, according to CryptoQuant.
According to Bloomberg, companies have filed 92 applications with the SEC to launch crypto ETFs in the US. Three exchange-traded funds based on Bitcoin and Ethereum, as well as numerous proposals for altcoins, are among those awaiting approval. Solana and XRP are the most popular.
Voting has ended on a proposal to reduce fees on the TRON network by 60%. According to blockchain founder Justin Sun, the majority of community members approved the initiative.
According to DeFiLlama, the dominance of the stablecoin Tether (USDT) in the stablecoin market has fallen below 60% for the first time since March 2023. The decline could be due to increased competition within the industry and tighter regulatory standards.