Sample Category Title
China RatingDog PMI manufacturing rises to 50.5, relief rally rather than turning point
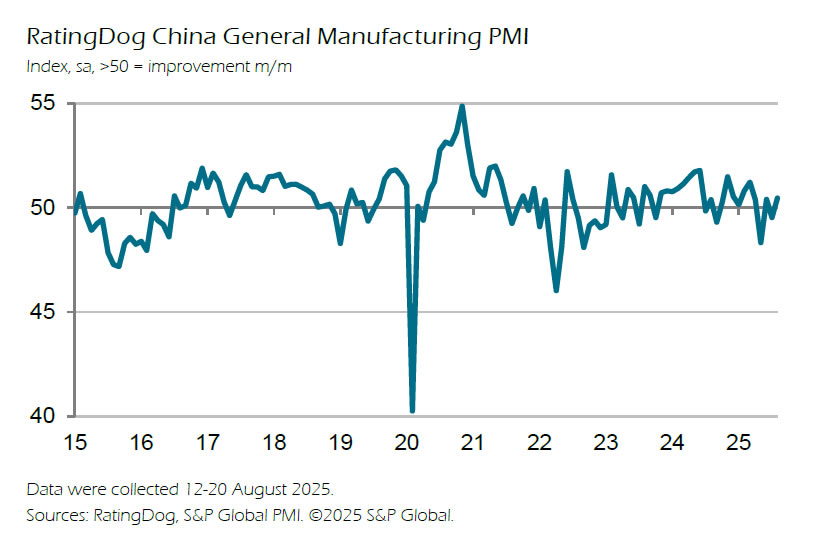
China’s manufacturing sector showed a modest improvement in August, with the RatingDog Manufacturing PMI rising from 49.5 to 50.5, beating expectations of 49.9 and returning to expansion. However, RatingDog described the uptick as a “breath of relief rather than a sustained rally,” reflecting cautious optimism. By contrast, the official NBS survey offered a more subdued view, with manufacturing inching up from 49.3 to 49.4 and non-manufacturing steady at 50.3.
The RatingDog report highlighted firmer new orders, which pushed inventories of raw materials and finished goods higher. Export demand remains weak but showed slower contraction. Yao cautioned that external demand may have been pulled forward while domestic demand stays soft, limiting the scope for sustained output gains without stronger local consumption.
Meanwhile, input costs continued to climb under the “Anti-involution” policy backdrop, and those upstream pressures are now filtering into output prices, ending an eight-month streak of falling charges. With profit recovery still slow, the durability of the latest rebound depends on whether exports can stabilize further and domestic demand begins to catch up.
Silver set to outpace Gold again once 40 barrier clears
Silver’s uptrend reignited last week, riding alongside Gold’s surge and now threatening to eclipse it in strength. The metal is pressing against 40 psychological level, its highest in over a decade, with markets sensing that Fed policy easing this month could provide an extra push. Historically, Silver often lags Gold at the start of a rally but outperforms once momentum builds, and the current advance could also fit that pattern.
That precedent is clear. During the 1970s bull market, Gold’s gain of roughly 2,200% was extraordinary, but silver’s surge of more than 3,000% was even more dramatic. In the 2008–2011 cycle, Gold advanced about 150% from trough to peak, while Silver exploded nearly 400%, touching almost 50. Even in the shorter 2020 rally, gold rose a solid 35% while silver soared 140%. The pattern is unmistakable: once the metals market gains conviction, Silver becomes the standout.
While Gold has provided the steady safe-haven anchor, while Silver’s dual role as monetary and industrial metal gives it more torque once investors commit to a full-fledged precious metals run. In this context, Silver looks positioned to extend higher even if Gold pauses for breath ahead. As long as the rally is not purely defensive, Silver stands to attract more speculative and retail flows, creating conditions for further outperformance. With a dovish Fed providing policy fuel, the next leg higher could confirm silver’s leadership role in this phase of the precious metals cycle.

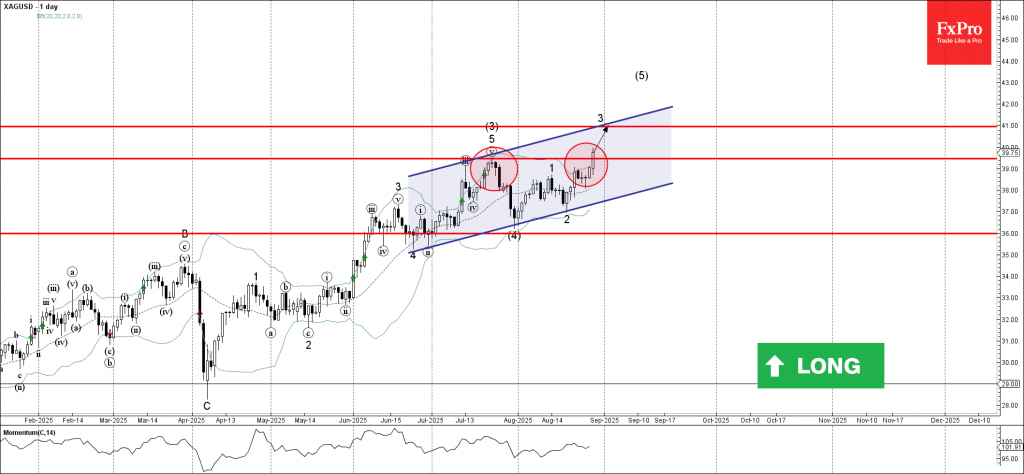
Technically, Silver is now pressing against the rising channel resistance that has defined the uptrend from 17.54 (2022 low). Sustained break above that barrier, followed by decisive move through 100% projection of 21.92 to 34.84 from 28.28 at 41.20, would open the door to upside acceleration consistent with a fifth-wave extension.
That would set the stage for 138.2% projection at 46.13, or even further to 161.8% projection at 49.18, which is close to 50 psychological level.

For the near term, the bullish outlook remains intact as long as 36.93 support holds. Any dips are likely to be seen as opportunities within the trend rather than signs of exhaustion.

Silver Wave Analysis
Silver: ⬆️ Buy
- Silver broke the key resistance level 39.50
- Likely to rise to resistance level 41.00
Silver recently broke above the key resistance level 39.50 (former top of wave (3) from the middle of July, as can be seen from the daily Silver chart below).
The breakout of the resistance level 39.50 continues the active short-term impulse wave 3 of the intermediate impulse wave (5) from the end of July.
Given the strong daily uptrend, Silver can be expected to rise to the next resistance level 41.00, target price for the completion of the active impulse wave 3.
Breakout or Breakdown? Gold, Dollar, and China Rally to Shape Risk Into Year-End
The past week was anything but quiet for global markets, even if headline price moves in currencies looked muted. Beneath the surface, three powerful narratives are colliding: political turmoil in the U.S. that threatens the independence of its central bank, a legal battle that could reshape global trade policy, and a relentless equity surge in China that is redefining investor sentiment.
Each of these developments carries implications that stretch beyond their immediate headlines. For some, it means renewed demand for havens. For others, it means technical signals flashing warnings of a deeper turn ahead. And for risk-sensitive currencies, it offers both opportunity and vulnerability.
Gold has reemerged as a crisis hedge, propelled higher by institutional uncertainty and legal challenges in Washington. Dollar, despite firm U.S. data, continues to wobble as traders look ahead to the anticipated Fed cut within weeks. Meanwhile, the Shanghai Composite’s march toward a pivotal resistance level has injected new energy into Asia-linked trades, with Australian Dollar riding the wave.
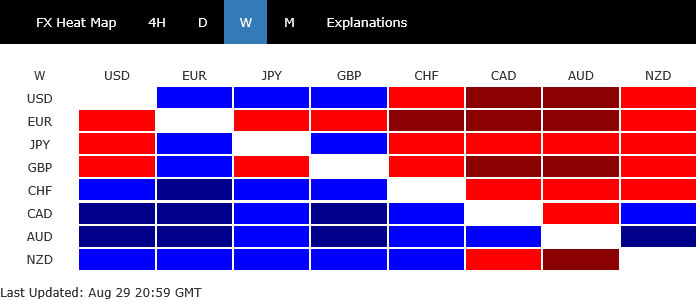
For currency traders, the week’s performance scoreboard told its own story: commodity currencies surged, with the Aussie leading, followed by Loonie and Kiwi. At the other end, European majors lagged, with Euro, Sterling, and Yen under pressure. Dollar and Franc sat uncomfortably in the middle.
Against this backdrop, the coming weeks may prove decisive. Will Gold confirm its breakout, will Dollar lose its structural footing, and can Chinese equities sustain their ascent? The answers could reshape FX flows and risk sentiment into year-end.
Gold Rally Signals Crisis Hedge as Fed Fight and Tariff Ruling Stir Risks
Gold’s performance last week stood out sharply against otherwise subdued global markets. The precious metal gained momentum for its role as a refuge in times of deepening political and institutional turmoil in the US.
The most pressing issue for markets has been the ongoing challenge to the Fed’s independence. U.S. President Donald Trump has made no secret of his desire to bring interest rates down more aggressively and has sought to exert stronger influence over the central bank. His latest move — an attempt to fire Fed Governor Lisa Cook — has intensified fears about the Fed’s autonomy.
Cook has filed a lawsuit contesting the legality of her removal. A hearing on her request for a temporary bar against Trump’s action ended Friday without a ruling, leaving markets in limbo. Legal experts note that the case could ultimately land in the Supreme Court, potentially setting precedent on whether presidents have authority to dismiss Fed officials at will.
If Trump prevails, he would likely be able to install a majority of the Fed Board aligned with his policy preferences. That would mark a profound shift in how monetary policy is set, raising concerns that rate decisions could be guided more by political imperatives than by economic data. For Gold, such risks have reinforced safe-haven flows.
The second area of turbulence is trade policy. On Friday, a U.S. appeals court ruled 7-4 that most of Trump’s tariffs are illegal, challenging one of his hallmark economic strategies. The decision applies to the “reciprocal” tariffs imposed in April and to earlier measures targeting China, Canada, and Mexico.
While the court allowed tariffs to remain in place until October 14 pending appeal, the ruling casts doubt on their durability. Markets now await whether the Trump administration will pursue a Supreme Court appeal. Analysts believe the White House has been preparing contingency plans — a “Plan B” — to preserve tariffs under different legal statutes should this challenge succeed.
For Gold, the combination of political disputes, Fed instability, and trade-policy risk forms a potent mix of supportive drivers. Investors are seeking insurance against outcomes that could shake confidence in both U.S. institutions and the global trading system.
Technically, Gold accelerated higher towards the end of the week and breached 3451.28 resistance. here are various interpretations on the price actions from 3499.79 record high. But in any case, further rally is now expected in Gold as long as 3404.20 support holds. Next target is 3499.79 high, and break there will pave the way to 161.8% projection of 3267.90 to 3408.21 from 3311.30 at 3538.32 in the near term.
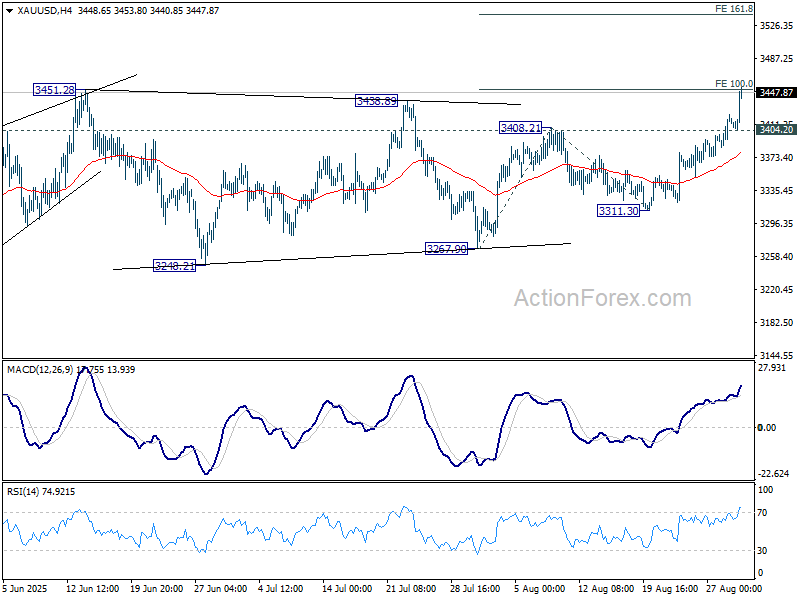
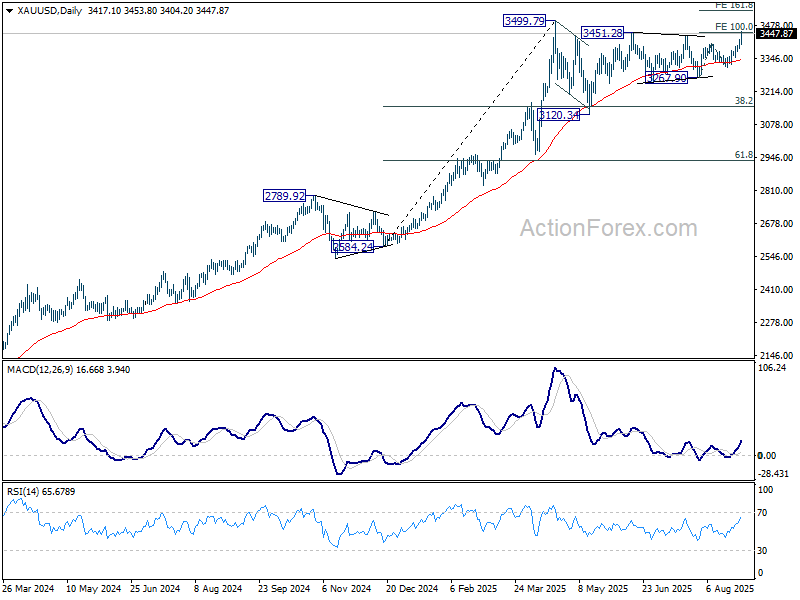
More importantly, decisive break of 3499.79 will confirm long term up trend resumption. That would set the stage for medium term rally to 261.8% projection of 1160.17 to 2074.84 from 1614.60 at 4009.20, that is 4000 psychological level.

Dollar Index Fails 55 D EMA Again, Risk Builds for Break Below 96.37
Dollar closed last week on a sluggish note, with a half-hearted rally attempt fading quickly and leaving the greenback mixed across the board. Despite relatively upbeat economic data, sentiment around the currency remains heavy, with markets firmly focused on the Fed’s expected easing in September.
Durable goods orders surprised to the upside, Q2 GDP was revised higher, and jobless claims edged down. Personal spending also impressed, reinforcing the view that households remain in strong shape despite global headwinds. Inflation data provided no surprises, with both headline and core PCE landing on expectations.
The resilience in data, however, did little to sway Fed expectations. Markets continue to price a September rate cut as the beginning of a new easing cycle, with two cuts expected in total this year.
The more intriguing development came from Fed Governor Christopher Waller. He warned that waiting for further labor market deterioration would risk the Fed “falling behind the curve.” He argued conditions already justify a shift toward neutral policy, which he places near 3%—some 125 to 150 basis points below current levels.
Waller suggested more easing will come over the next three to six months, though the pace remains open—whether as a sequence of cuts or gradual moves with pauses. His clear message was that policy should move steadily toward neutral, with the only question being how quickly.
Crucially, Waller is seen as a potential successor to Chair Jerome Powell when his term ends next year. His alignment with Trump’s preferences, and the possibility of the administration securing a majority on the Board by removing Governor Lisa Cook, highlights how Fed policy could be reshaped if political influence grows.
Technically, the Dollar Index has once again failed to sustain a break above its 55 D EMA (now at 98.47). Near-term risks remain tilted to the downside, with a retest of 96.37 low likely.
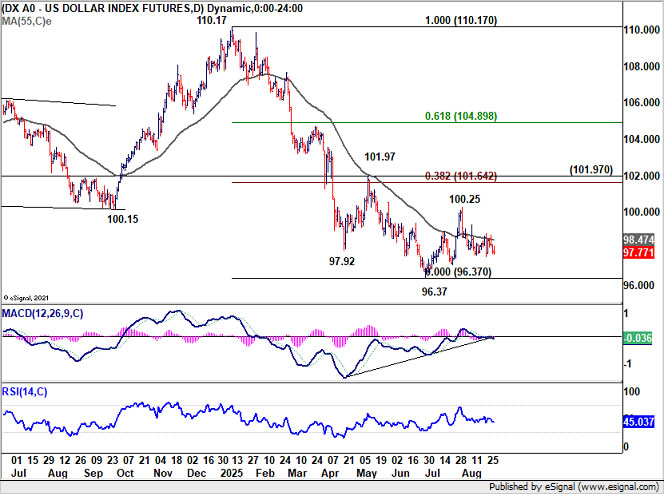
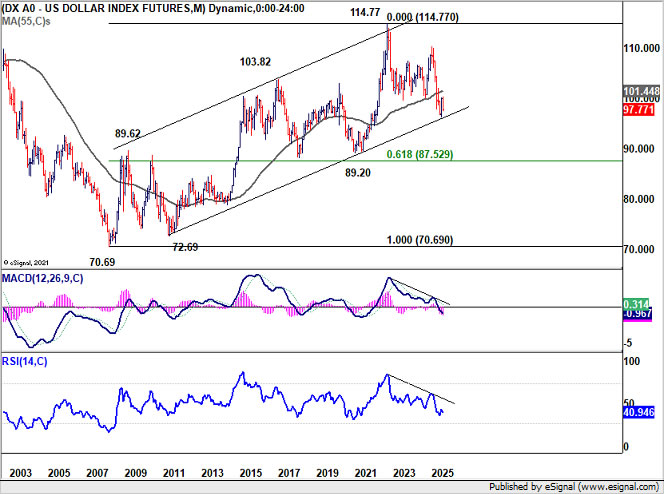
Importantly, firm break of 96.37 could mark a decisive move out of the long-standing uptrend channel from the 2008 low at 70.69, signaling the start of a medium-to-long-term downtrend toward sub-90 levels.
Meanwhile, even if the corrective pattern from 96.37 manages to have another rising leg, strong resistance should be seen from 38.2% retracement of 110.17 to 96.37 at 101.64 to cap upside.
China’s SSE Rally Nears Pivotal 4000, Aussie Awaits Break or Rejection
Chinese equities have surged to decade highs last week, with the rally fueled by state-backed institutions, large investors, and gradually returning retail participation. The powerful move has provided a much-needed boost to market sentiment, with ripple effects extending to currencies tied closely to China, notably Australian Dollar.
On the bullish side, relatively low valuations and ample liquidity are highlighted as reasons for the rally’s sustainability. Retail investors, who has been keeping a large portion of their savings in low-yielding deposits in the past few years, are expected to start rotating into equities. This flow of funds could create a fresh wave of demand, reinforcing momentum in the months ahead.
Yet skepticism lingers about the durability of this boom. The majority of Chinese household wealth is tied up in property, which remains in a prolonged downturn. Without stronger property markets, the wealth effect of equities alone may be limited.
For now, however, optimism is dominant, and Aussie has emerged as the strongest performer in the currency markets, riding on hopes of sustained Chinese strength. Should SSE Composite extend its rally further, the tailwind for AUD could help offset the drag from expectations of additional RBA easing.
Technically, the 4000 level on the Shanghai SSE Composite presents a formidable resistance. It coincides with both 100% projection of 2689.70 to 3674.40 from 3040.69 at 4027.24 and the major trendline that has spanned for nearly two decades. This zone is likely to prove difficult to overcome, at least on the first attempt.
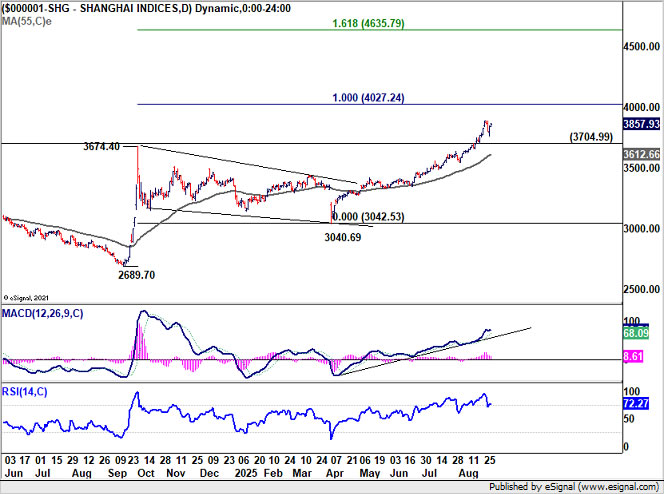
Failure at 4000 would likely result in a pullback, with a drop below 3704.99 pointing to rejection and setting up deeper correction toward 55 D EMA (now at 3612.66).
Conversely, decisive break above 4000 would be a game-changer, signaling strong underlying momentum in Chinese equities. Medium-term target would then point toward 161.8% projection at 4635.79. .
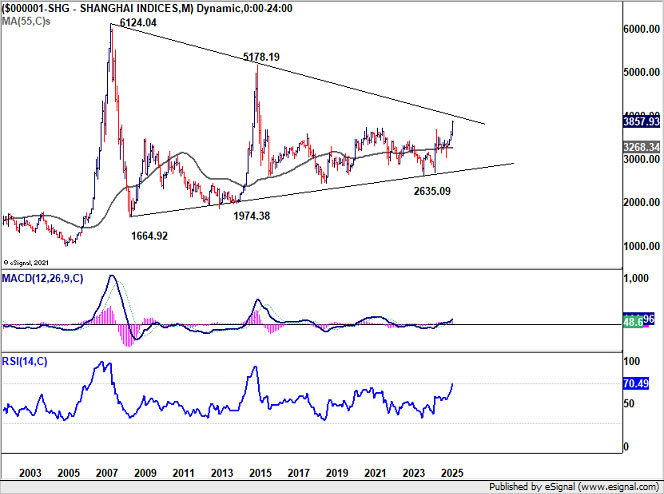
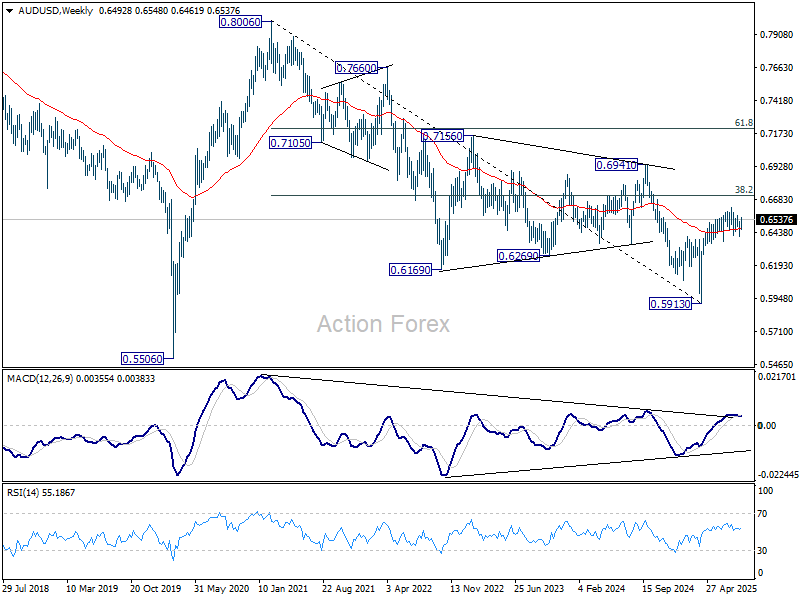
A strong break of SSE above 4000 could be a trigger for AUD/USD to break through 38.2% retracement of 0.8006 (2021 high) to 0.5913 at 0.6713 to set up long term bullish trend reversal.
USD/CAD Weekly Outlook
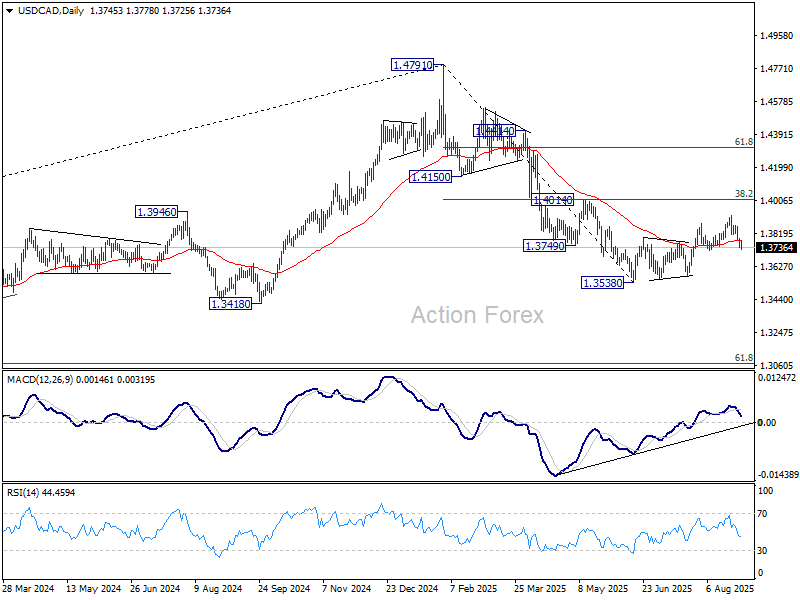
USD/CAD dropped sharply last week but still hold on to 1.3720 support. Initial bias stays neutral this week first. On the downside, decisive break of 1.3720 will argue that the corrective pattern from 1.3538 has already completed at 1.3923. Intraday bias will be back on the downside for 1.3574 support first. Break there will bring retest of 1.3538 low. On the upside, though, break of 1.3813 resistance will retail near term bullishness, and bring retest of 1.3923 high instead.
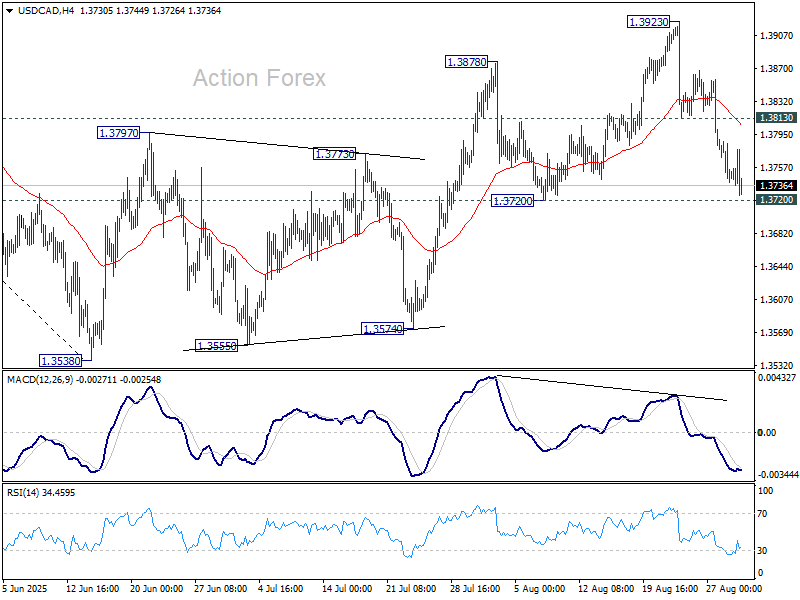
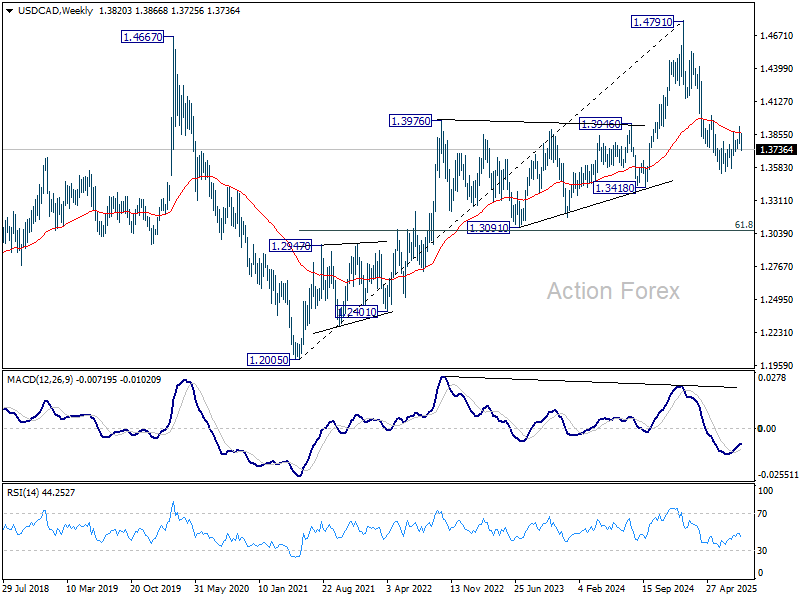
In the bigger picture, price actions from 1.4791 medium term top could either be a correction to rise from 1.2005 (2021 low), or trend reversal. In either case, further decline is expected as long as 1.4014 cluster resistance (38.2% retracement of 1.4791 to 1.3538 at 1.4017) holds. Next target is 61.8% retracement of 1.2005 (2021 low) to 1.4791 at 1.3069.
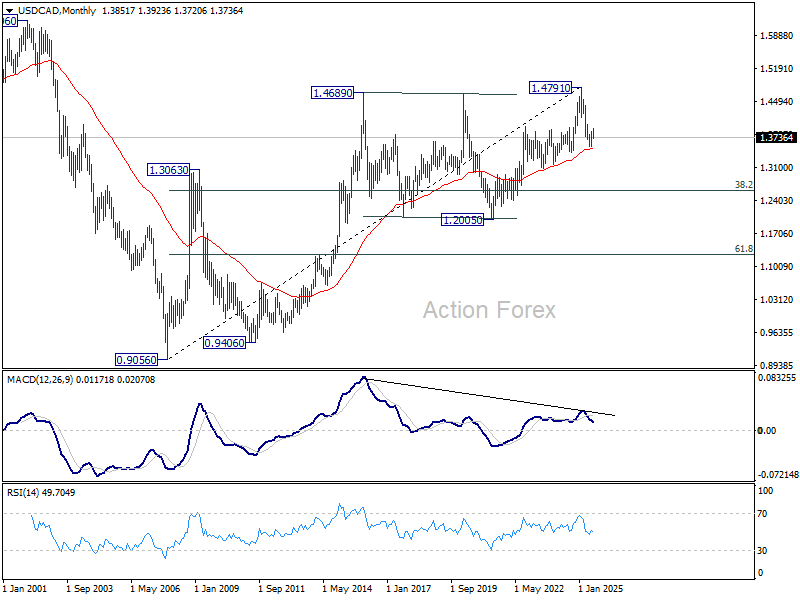
In the long term picture, as long as 55 M EMA (now at 1.3514) holds, up trend from 0.9056 (2007 low) should still resume through 1.4791 at a later stage. However, sustained trading below 55 M EMA will argue that the up trend has already completed, with rise from 1.2005 to 1.4791 as the fifth wave. 1.4791 would then be seen as a long term top and deeper medium term down trend should then follow.
EUR/USD Weekly Outlook
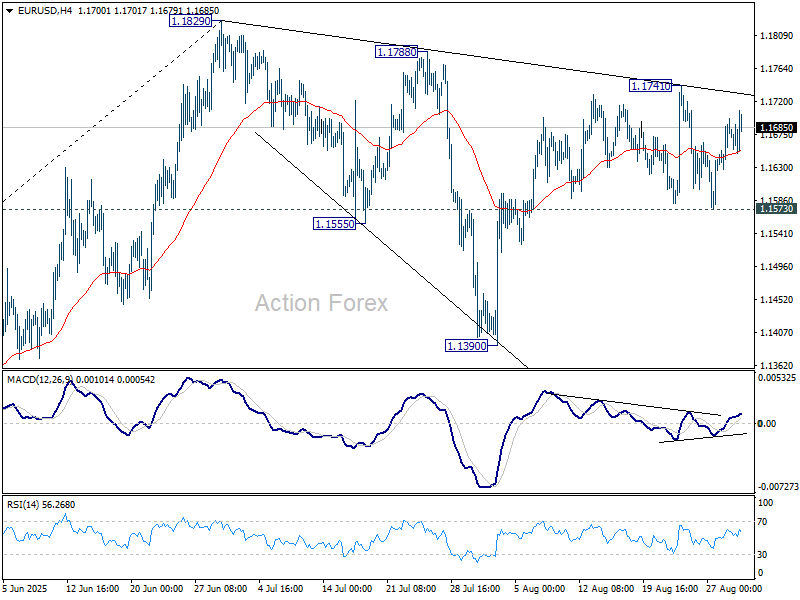
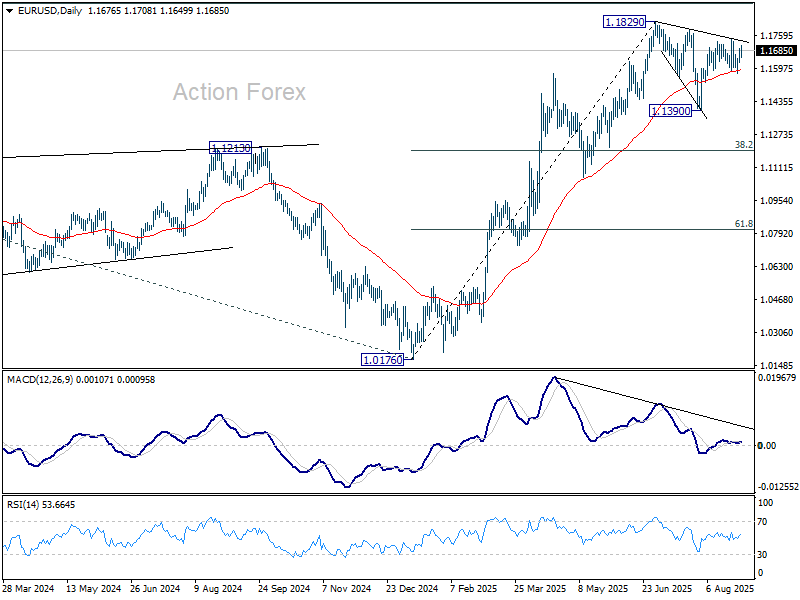
EUR/USD dipped to 1.1573 last week but quickly recovered. Overall outlook is unchanged that corrective fall from 1.1829 should have completed with three waves down to 1.1390. On the upside, above 1.1741 will bring retest of 1.1829 high first. Firm break there will resume larger up trend. However, sustained break of 1.1573 will dampen this view, and indicate that corrective pattern from 1.1829 is extending with another falling leg towards 1.1390 again.
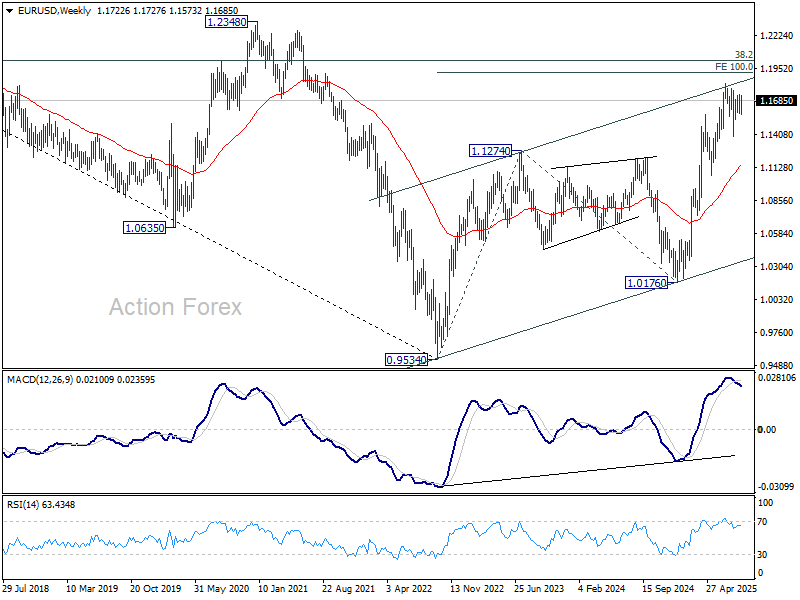
In the bigger picture, rise from 0.9534 (2022 low) long term bottom could be correcting the multi-decade downtrend or the start of a long term up trend. In either case, further rise should be seen to 100% projection of 0.9534 to 1.1274 from 1.0176 at 1.1916. This will remain the favored case as long as 1.1604 support holds.
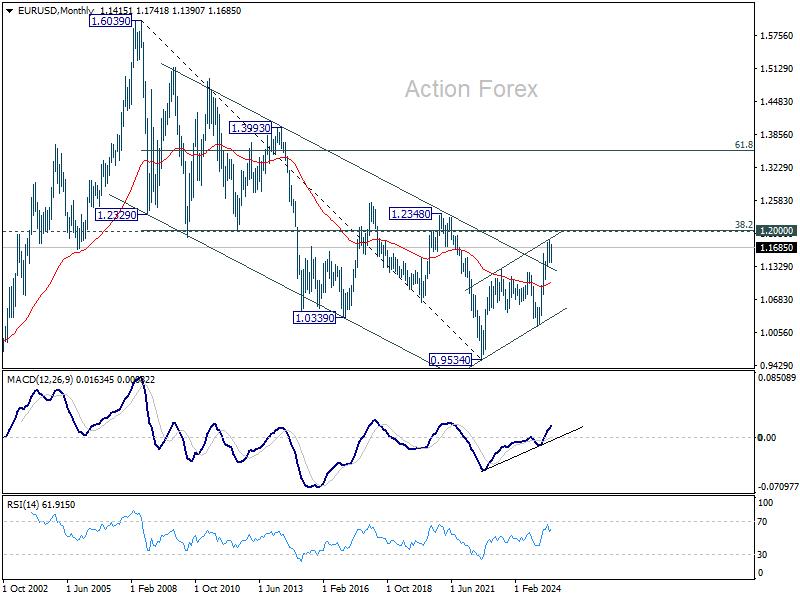
In the long term picture, a long term bottom was in place already at 0.9534, on bullish convergence condition in M MACD. Further rise should be seen to 38.2% retracement of 1.6039 (2008 high) to 0.9534 at 1.2019. Rejection by 1.2019 will keep the price actions from 0.9534 as a corrective pattern. But sustained break of 1.2019 will suggest long term bullish trend reversal, and target 61.8% retracement at 1.3554.
USD/JPY Weekly Outlook
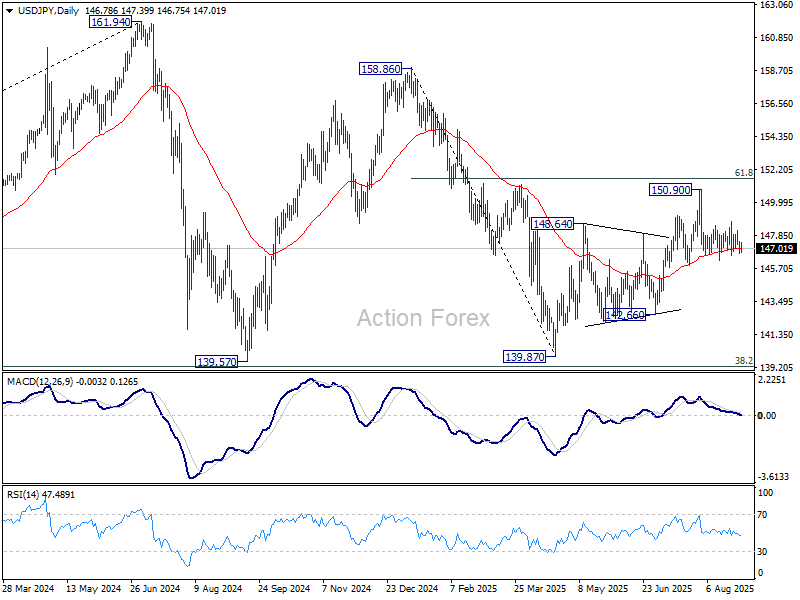
USD/JPY gyrated in range of 146.20/148.76 last week. Initial bias remains neutral this week first. On the downside, firm break of 146.20 will resume the decline from 150.90. More importantly, that would also argue that rebound from 139.87 has completed as a corrective move to 150.90. Deeper fall should be seen to 142.66 support for confirmation. On the upside, above 148.76 will bring another rise to retest 150.90 instead.
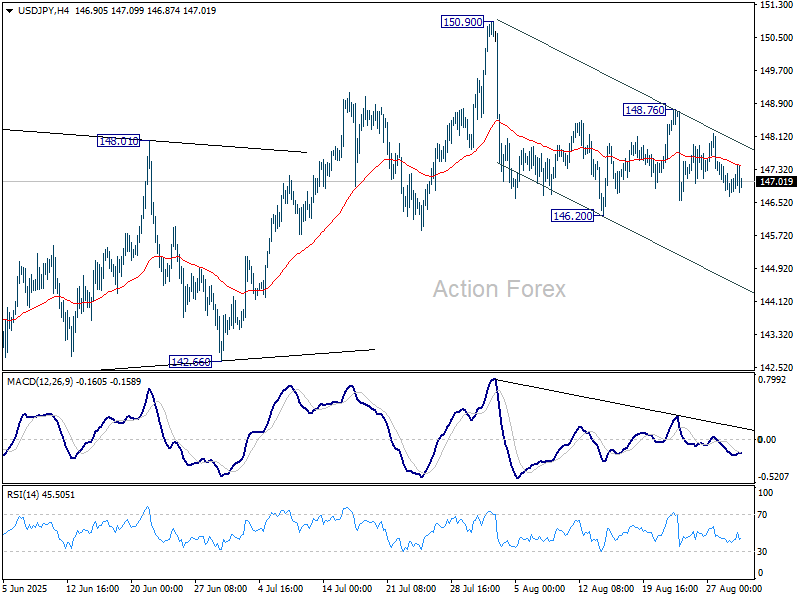
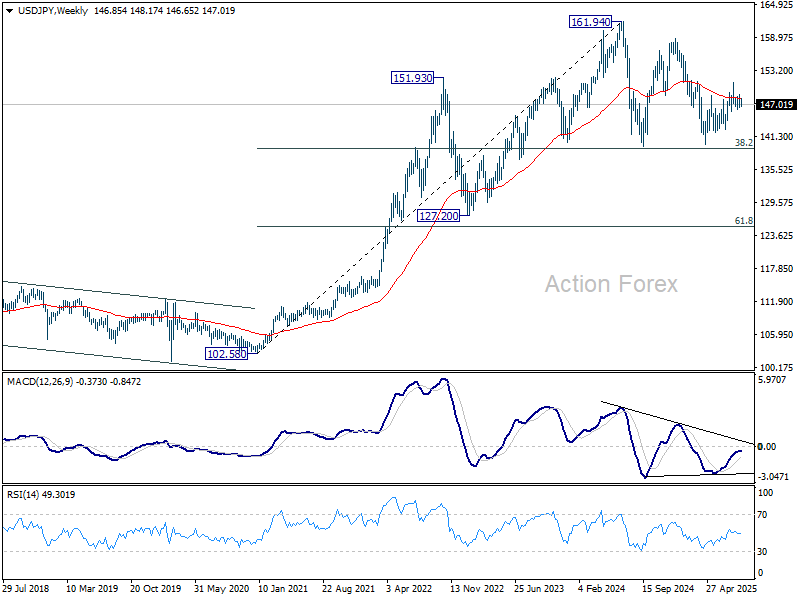
In the bigger picture, price actions from 161.94 (2024 high) are seen as a corrective pattern to rise from 102.58 (2021 low). Decisive break of 61.8% retracement of 158.86 to 139.87 at 151.22 will argue that it has already completed with three waves at 139.87. Larger up trend might then be ready to resume through 161.94 high. In case the corrective pattern extends with another fall, strong support is expected from 38.2% retracement of 102.58 to 161.94 at 139.26 to bring rebound.
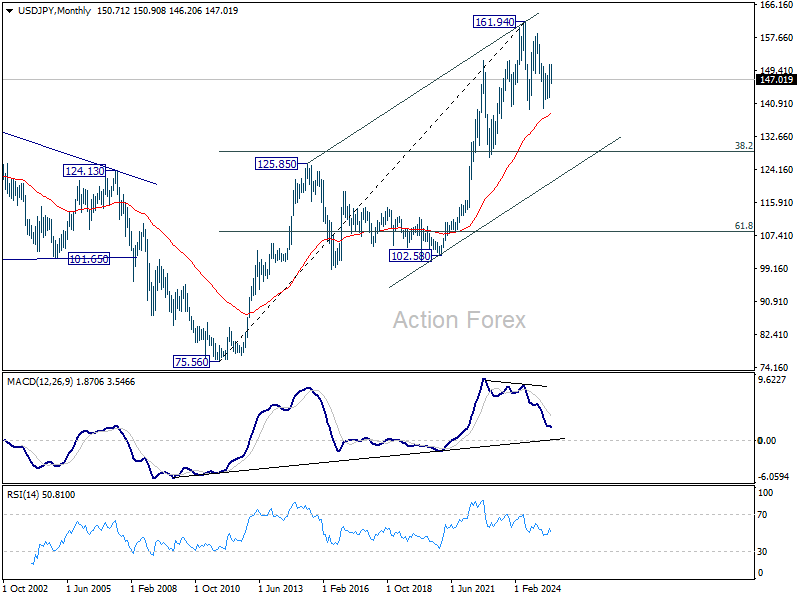
In the long term picture, there is no sign that up trend from 75.56 (2011 low) has completed. But then, firm break of 161.94 is needed to confirm resumption. Otherwise, more medium term range trading could still be seen.
GBP/USD Weekly Outlook
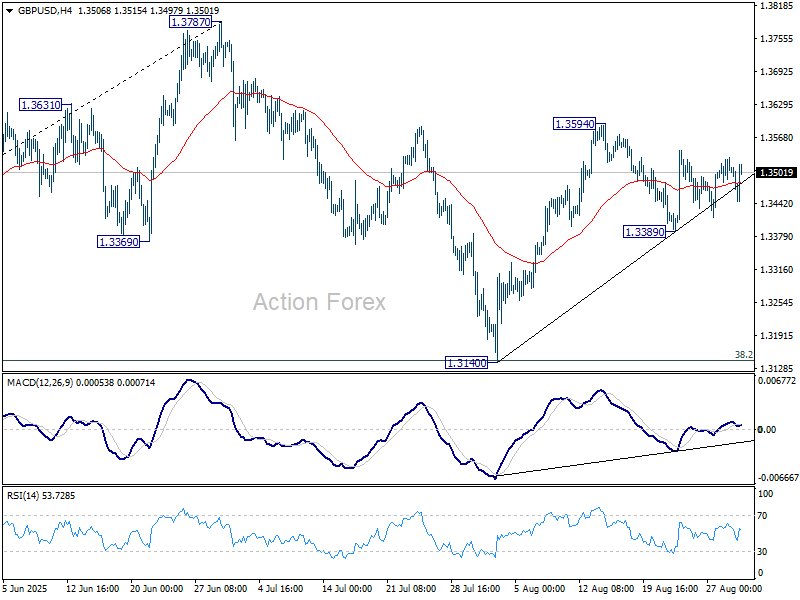
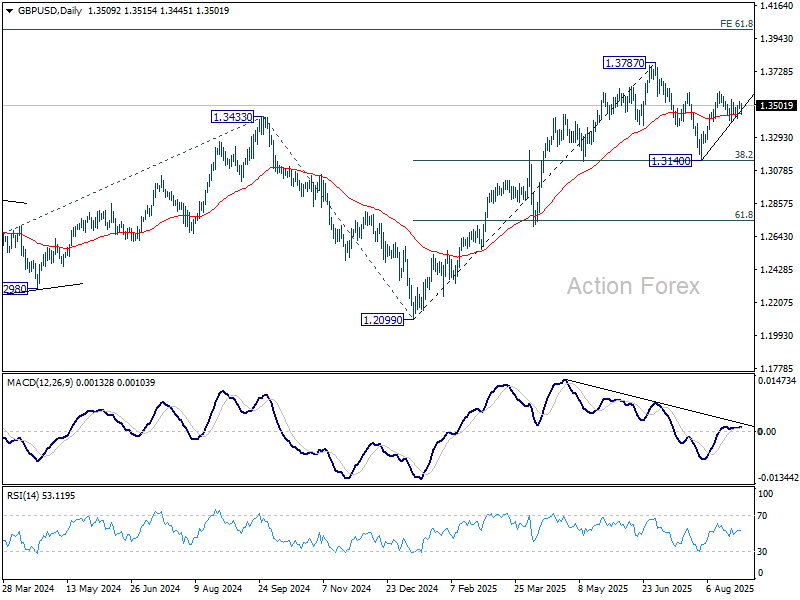
GBP/USD stayed in range of 1.3389/3594 last week as it turned into sideway trading. Initial bias remains neutral this week first. Further rally is mildly in favor as long as 1.3389 support holds. Above 1.3594 will resume the rebound from 1.3140 to retest 1.3787 high. On the downside, however, break of 1.3389 support will extend the corrective pattern from 1.3787 with another fall, and target 1.3140 support.
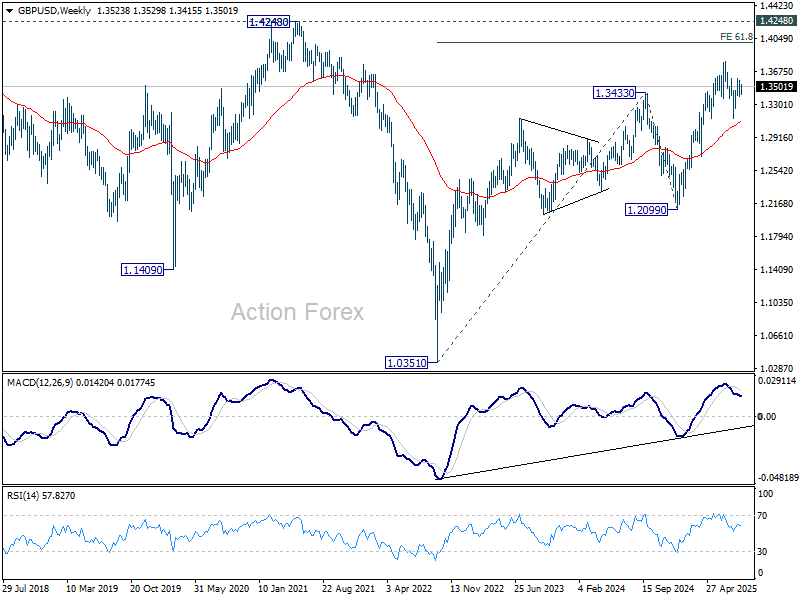
In the bigger picture, up trend from 1.3051 (2022 low) is in progress. Next medium term target is 61.8% projection of 1.0351 to 1.3433 from 1.2099 at 1.4004. Outlook will now stay bullish as long as 55 W EMA (now at 1.3104) holds, even in case of deep pullback.
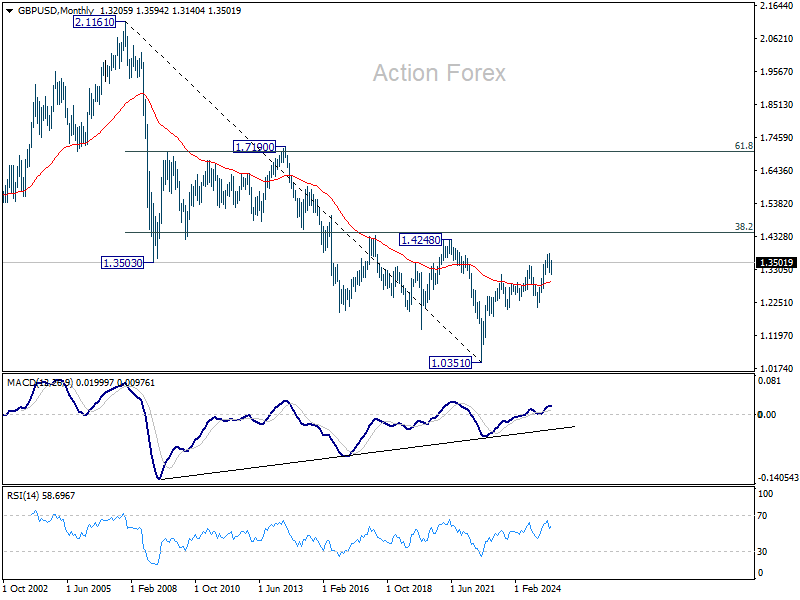
In the long term picture, for now, price actions from 1.0351 (2022 low) are still seen as a corrective pattern to the long term down trend from 2.1161 (2007 high) only. However, firm break of 1.4248 resistance (38.2% retracement of 2.1161 to 1.0351 at 1.4480) will be a strong sign of long term bullish reversal.
USD/CHF Weekly Outlook
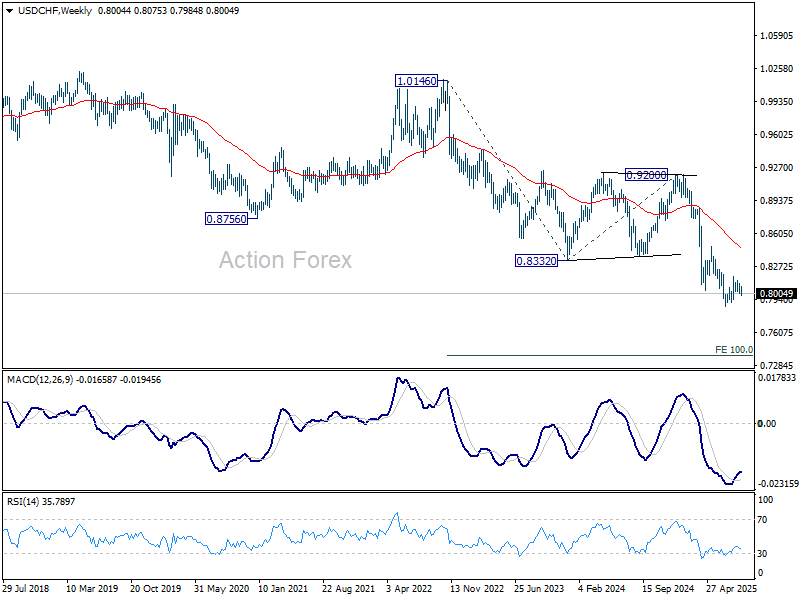
USD/CHF's fall from 0.8170 tried to resume late last week. Initial bias stays mildly on the downside this week. The current favored case is that corrective rebound from 0.7871 has completed at 0.8170. Deeper fall would be seen to 0.7910 support, and then retest 0.7871. Nevertheless, break of 0.8075 minor resistance will argue that the corrective rise is still in progress and bring retest of 0.8170 first.
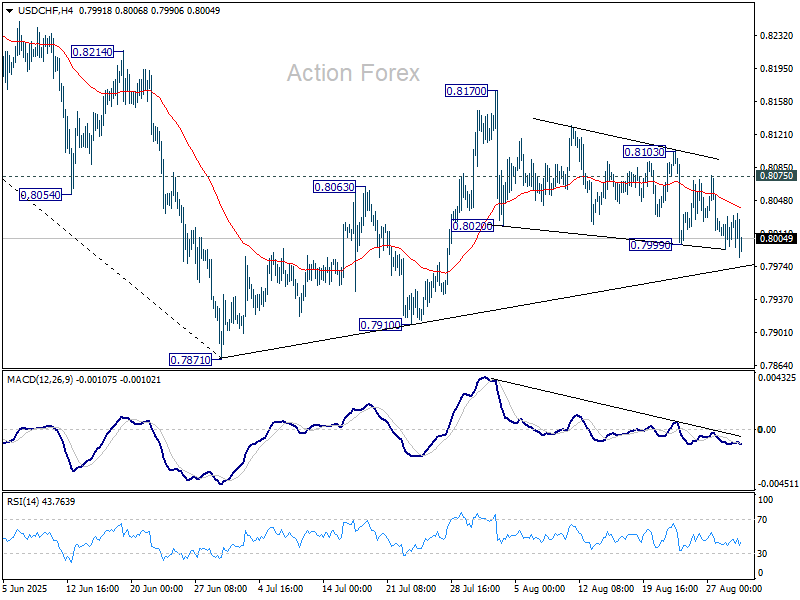
In the bigger picture, long term down trend from 1.0342 (2017 high) is still in progress. Next target is 100% projection of 1.0146 (2022 high) to 0.8332 from 0.9200 at 0.7382. In any case, outlook will stay bearish as long as 0.8475 resistance holds.

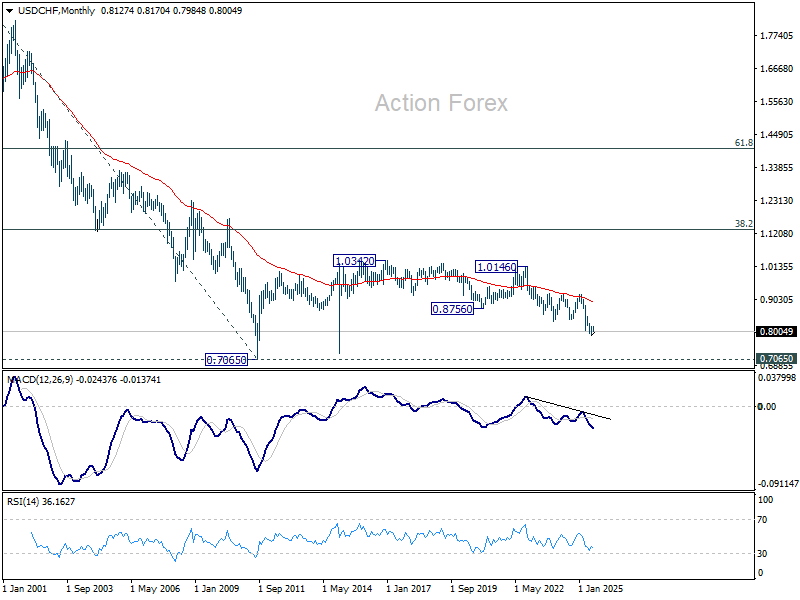
In the long term picture, price action from 0.7065 (2011 low) are seen as a corrective pattern to the multi-decade down trend from 1.8305 (2000 high). It's uncertain if the fall from 1.0342 is the second leg of the pattern, or resumption of the downtrend. But in either case, outlook will stay bearish as long as 0.9200 resistance holds. Retest of 0.7065 should be seen next.
AUD/USD Weekly Report
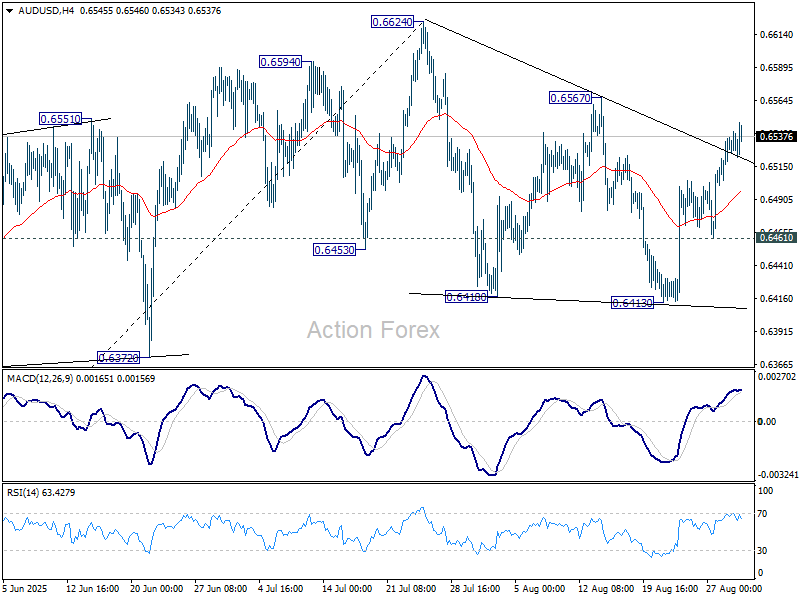
AUD/USD's rebound from 0.6413 accelerated higher last week but upside is capped below 0.6567 resistance so far. Initial bias stays neutral this week first. On the upside, firm break of 0.6567 should confirm that corrective pattern from 0.6624 has completed at 0.6413, and larger rally is ready to resume. Retest of 0.6624 high should be seen next. On the downside, though, break of 0.6461 will extend the corrective pattern with another fall, and target 0.6413 support, and possibly below.
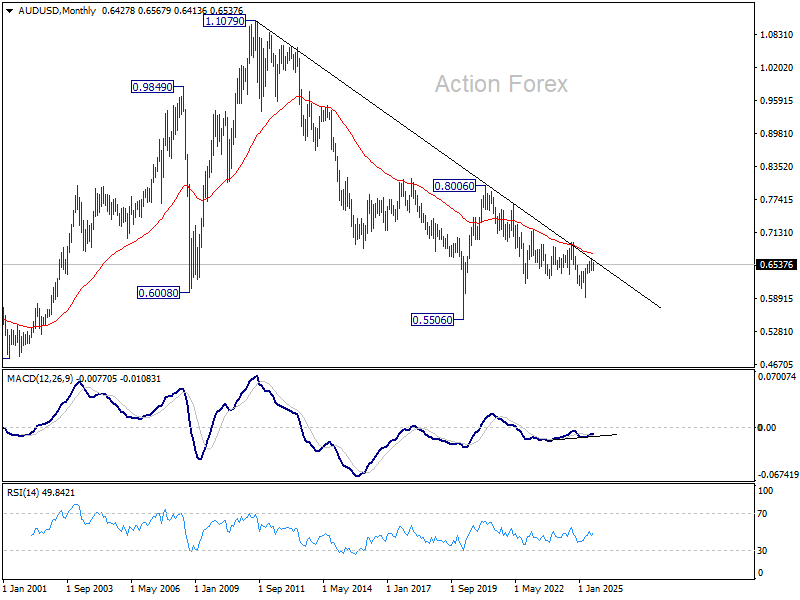
In the bigger picture, there is no clear sign that down trend from 0.8006 (2021 high) has completed. Rebound from 0.5913 is seen as a corrective move. While stronger rally cannot be ruled out, outlook will remain bearish as long as 38.2% retracement of 0.8006 to 0.5913 at 0.6713 holds. Nevertheless, considering bullish convergence condition in W MACD, even in case of another fall through 0.5913, downside should be contained above 0.5506 (2020 low).
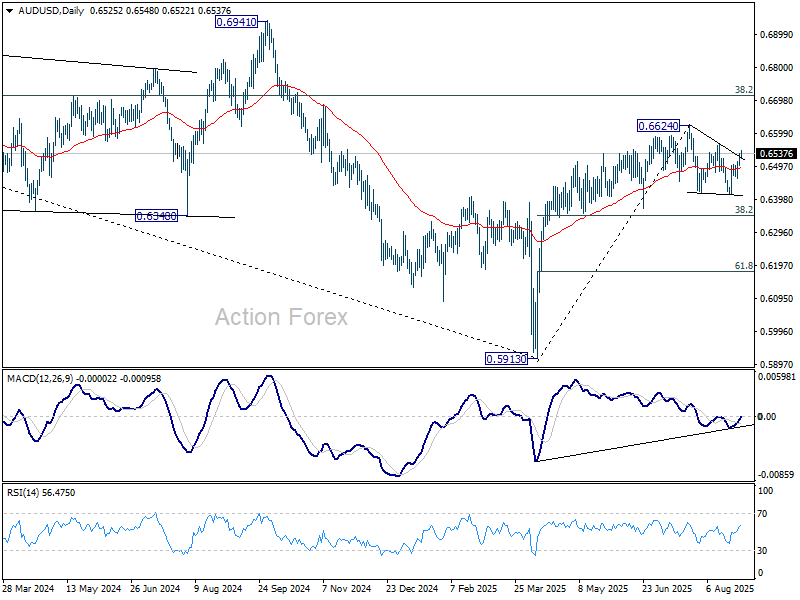
In the long term picture, fall from 0.8006 is seen as the second leg of the corrective pattern from 0.5506 long term bottom (2020 low). Hence, in case of deeper decline, strong support should emerge above 0.5506 to contain downside to bring reversal. On the upside, firm break of 0.6941 will argue that the third leg has already started back to 0.8006.