
Sample Category Title
All Eyes on Powell
Selling pressure across most major US and European indices continued yesterday. Tensions between Russia and Ukraine persist with mutual attacks, while hawkish risks to the market’s recent dovish Federal Reserve (Fed) narrative persist. Weekly jobless claims and the Philadelphia Fed survey were broadly consistent with concerns over a slowing labour market and lingering price pressures. The Fed minutes earlier this week showed that members remain more concerned about inflation risks than about labour market softening. Although the meeting took place just before the latest volatility around the August employment report, several policymakers reiterated a cautious stance toward immediate rate cuts. The doves are no longer certain that the Fed will cut rates in September. Market pricing now implies around a 75% probability of a 25bp cut, down from near certainty last week when some even considered 50bp cuts.
Inflation vs Jobs: a fine balance. The three-month average job gains in the US dropped from around 150K to just 35K, raising concerns that cracks are emerging in the US labour market following the August jobs report. The story has shifted from “the US job market remains resilient despite trade and AI risks” to “the Fed may be falling behind.” On inflation, CPI data suggested consumer prices remain contained, but PPI reflected tariff-driven cost pressures. US retail earnings added nuance: consumers are shifting toward discount stores and smaller-ticket purchases. While overall demand appears intact, Walmart noted tariff-related pricing effects, restocking with higher-priced goods — a trend that could soon filter into CPI.
This leaves the Fed balancing competing priorities. On one side, the administration — including President Trump — has been pushing for lower rates to cushion the jobs impact of trade tensions. On the other, policymakers remain wary of stoking inflation amid tariff pass-throughs. In theory, inflation should take precedence, yet cracks in the jobs data complicate the picture.
That’s why attention now turns to Powell’s speech at Jackson Hole. While he may stick to a “data dependent” message, the venue has historically hosted major policy shifts. Markets are alert to any surprise, and there is a greater chance that we will see a hawkish surprise than the contrary.
A cautiously hawkish tone from Powell could further unwind the market’s extra-dovish positioning. That could mean a rebound in US 2-year yields, pressure on the S&P 500, a stalling of the small-cap rally, and renewed strength in the US dollar. Rising global yields — notably in long-maturity JGBs — add to the risk of a broader selloff if Powell strikes a firmer line.
For now, USDJPY is stable, the dollar has firmed ahead of Powell’s remarks, and EURUSD has slipped below its 50-day moving average. The pair looks heavy after this week’s decline. Meanwhile, euro area manufacturing PMI printed above 50 for the first time in more than three years, driven by new orders — possibly reflecting easing trade uncertainty and tariff clarity. Progress in US–EU trade discussions and the expected boost from military spending also brighten Europe’s growth outlook. That said, stronger activity could complicate the European Central Bank’s (ECB) ability to justify further cuts. For now, the ECB is likely to sit out September, and possibly drop the idea of another cut, if tariff impacts prove less severe than feared.
The Stoxx 600 has erased tariff-led losses and is advancing toward new highs, making it a favoured vehicle for investors diversifying away from US tech. But the euro, which has gained on military spending narratives and broad dollar weakness, may be nearing a peak if US dollar demand revives this fall on a hawkish Fed turn. Powell’s speech at Jackson Hole will be decisive — and markets will be listening closely.
Markets Eye Powell’s Speech in the Afternoon
In focus today
The Fed's Jackson Hole Symposium continues today and tomorrow. Today's highlight will be Fed Chair Powell's speech. Last year, Powell provided strong guidance that rate cuts were set to begin soon. This time, markets are again expecting the Fed to cut rates in September, but the direction of travel is arguably less clear, not least given the two-sided tariff risks and Trump's attempts to influence the decision-making.
In the euro area, focus turns to the negotiated wage growth indicator released by the ECB. Declining wage growth is the biggest downside risk to our call for the ECB holding rates steady for the rest of the year. The negotiated wages indicator will show how the collective bargaining part of wages fared in Q2.
The Swedish labour market statistics for July, including Statistics Sweden's official estimate of the unemployment rate, will be released today. We expect the unemployment rate to print at 8.6%, up from 8.3% in June. The weekly labour market statistics have been weak for a while and especially so in July. The stubbornly weak Swedish labour market remains one of the Riksbank's cyclical concerns and today's figure is at least of some importance for the Board.
Economic and market news
What happened overnight
In Japan, core inflation slowed modestly in July to 3.1% y/y (cons: 3.0%) from 3.3% in June. Inflation continues to be above the Bank of Japan's 2% target, although primarily driven by rising food prices and new energy subsidies. Excluding food, alcoholic beverages and energy, inflation remained steady at 1.6% y/y.
What happened yesterday
In the trade war, the EU and US have now formally made a trade deal. The deal is very similar to what has been communicated previously, with a 15% tariff rate for the vast majority of EU exports, applying across most sectors, including cars, semiconductors and pharmaceuticals. Zero-for-zero tariffs on a number of strategic products, including all aircraft and component parts, certain chemicals, certain generics, semiconductor equipment, certain agricultural products, natural resources and critical raw materials. Additionally, EU companies are to invest USD 600bn in strategic sectors in the US through 2028 and to buy USD 750bn in energy products.
In the US, flash PMIs for August came in stronger than expected. Manufacturing rose to 53.3 (cons: 49.7) from 49.8 and services fell to 55.4 (cons: 54.2) from 55.7. The increase in manufacturing was due to higher new orders, employment, and output index. The output index is at the highest level in more than three years. Hence, the details are very strong.
In the euro area, August PMIs were also a positive surprise with the composite measure rising to 51.1. (cons: 50.6) from 50.9 due to a rise in manufacturing while services declined. This is a milestone for the euro area manufacturing sector as it recorded growth for the first time in more than three years with the PMI rising above the 50-mark to 50.5 (cons: 49.5) from 49.8. The rise was due to a rise in new orders and output. While services PMI declined to 50.7 (cons: 50.8) from 51.0, it is still a strong report overall.
We expect the ECB to have concluded its cutting cycle and leave the deposit rate unchanged at 2% while markets are still pricing a risk of a final cut from the ECB in the coming six months. With today's stronger data, the risk of a final "insurance cut" has declined. A continued weakening of the services sector in the coming months is the main risk factor for a final ECB rate cut in our view.
Consumer sentiment declined unexpectedly in August to -15.5 from -14.7 (cons: -14.7). Consumers are likely reacting negatively to higher food prices as food inflation has increased by one percentage point since January, even though food is only a minor part of private consumption. The weak confidence should dampen growth in private consumption despite a strong labour market and rising real incomes.
In Denmark, consumer sentiment continued to decline to -17.2 from -15.7. This development is driven by a worsening view of both the private and nationwide economies. Inflationary fears continue to plague consumers as food prices, in particular, have continued to increase over the summer. At the same time the Danish stock market has experienced multiple large downturns, which are not improving sentiment either.
In Norway, Q2 mainland GDP growth came in significantly stronger than expected at +0.6% q/q (cons: 0.3%). Looking at the details, the surprise was mostly driven by mainland exports at +4.2% q/q which is probably a one-off. Private consumption grew 0.2%, residential investments were the biggest domestic surprise climbing 4.0% and private investments up 2.2% after a drop in Q1. All in all, a stronger report than we had expected, but weaker than headlines suggest.
Norges Bank published the Expectations Survey for Q3. Both inflation expectations and wage expectations were slightly below the Expectations Survey for Q2 and below Norges Bank's projections in its June Monetary Policy Report. Overall, a report clearly to the soft side - especially given the GDP surprise in the morning.
In the UK, stronger than expected PMIs added to a hawkish data streak. Composite increased to 53.0 (cons: 51.6), based on much stronger-than-expected services PMI of 53.6 (cons: 51.8), while manufacturing PMI went lower to 47.3 (cons: 48.3). The case for an unchanged Bank of England rate decision in November has strengthened, although we have a lot of incoming data before then.
Equities: Equities took another small step lower yesterday, with Europe outperforming the US, volatility ticking up (VIX higher), and Tech lagging. At first glance, the picture resembled yet another day of rotation into defensives, but that would be an over-simplification. Yesterday's session was not just a sector rotation story. Macro data were abundant, and on balance they surprised to the stronger side. Hence, this should all else equal have led to cyclical outperformance. but energy and commodities led the outperformance. Across assets, yields moved higher, the dollar gained, gold eased, and oil rose - altogether resembling elements of a stagflationary rotation. Some growth indicators were soft, while price components came in firm. Hence, the inflationary/stagflationary trend somewhat justifiable but then again US small caps outperformed, with the Russell 2000 closing higher, underlining the unusual aggregation of market moves.
In the US yesterday, Dow -0.3%, S&P 500 -0.4%, Nasdaq -0.3% and Russell 2000 +0.2%.
This morning paints a similar picture: Asia trading is mixed, and both European and US futures are essentially flat - markets sitting in wait-and-see mode ahead of Jackson Hole and Chair Powell's speech later today.
FI and FX: Rates moved higher across regions as PMI data for US, UK and the euro area came in stronger than expected. EUR/USD slipped to the 1.16 mark, while EUR/GBP continued trading within a narrow range near 0.865. Yesterday's upside surprise in Norwegian GDP figures for Q2 added significant upward pressure on NOK swap rates, while EUR/NOK dropped 1% to 11.8. The PMI data added upward pressure on oil prices with Brent trading 1.75% higher at USD67.7/bbl. this morning.
USD/JPY Daily Outlook
Daily Pivots: (S1) 147.62; (P) 148.01; (R1) 148.78; More...
USD/JPY's break of 148.51 resistance suggests that correction from 150.90 has already completed at 146.20. Larger rebound from 139.87 should still be in progress. Intraday bias is back on the upside for 150.90 first. Firm break there will target 151.22 fibonacci level next.
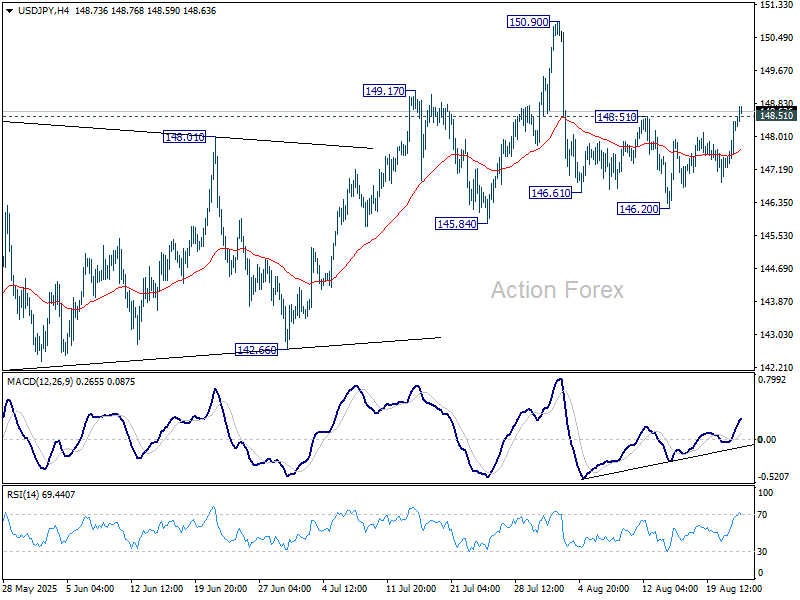
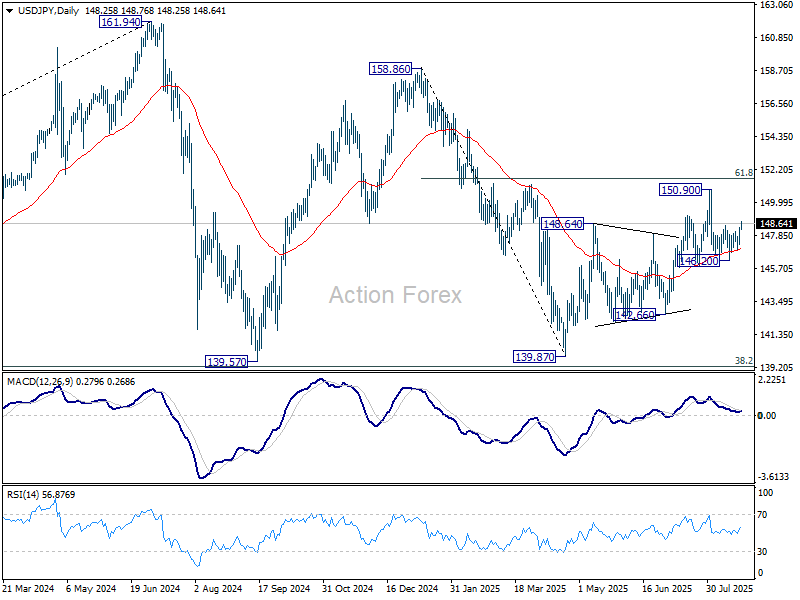
In the bigger picture, price actions from 161.94 (2024 high) are seen as a corrective pattern to rise from 102.58 (2021 low). Decisive break of 61.8% retracement of 158.86 to 139.87 at 151.22 will argue that it has already completed with three waves at 139.87. Larger up trend might then be ready to resume through 161.94 high. In case the corrective pattern extends with another fall, strong support is expected from 38.2% retracement of 102.58 to 161.94 at 139.26 to bring rebound.
Dollar Charges Higher as Fed Cut Odds Trimmed, Powell as Next Catalyst
Dollar is charging broadly higher as traders turn their focus to Fed Chair Jerome Powell’s upcoming remarks at the Jackson Hole Symposium later today. Scheduled for 1400GMT, the speech is seen as the key event of the week, particularly after recent data and Fed commentary trimmed expectations for near-term easing.
Markets have scaled back bets on a September rate cut, with odds dropping from over 90% last week to about 73% currently. Comments from Fed officials have struck a distinctly cautious tone, with most sounding dismissive of the need for an imminent cut. Notably, Boston Fed President Susan Collins has expressed openness to action but stopped short of pushing for it, leaving the dovish camp conspicuously thin.
This contrasts with prior market optimism that a dovish pivot was imminent. Instead, the lack of strong voices pushing for a September move highlights how the Fed remains unconvinced that conditions justify immediate action. Recent speeches suggest some policymakers are far more focused on inflation risks than on rushing to loosen policy.
The latest US PMI flash readings reinforced that stance. Manufacturing activity staged a sharp rebound in August while services growth held firm, putting the composite PMI at its highest in eight months. S&P Global estimates that the data aligns with a 2.5% annualized GDP growth rate, almost double the average pace from the first half of the year.
Importantly, the surveys showed inflationary pressures building again. Companies reported greater ability to pass tariff-related cost increases through to customers, with the price index reaching a three-year high. S&P Global argued that such conditions historically align more with a case for tightening, not easing.
Powell is unlikely to use today’s platform to signal any sudden shift. Known more for his moderate, consensus-driven tone than for taking a strong lead, he may simply emphasize Fed’s dual mandate while acknowledging both the risks of sticky inflation and signs of cooling in the labor market. Still, even subtle hints about which side of the mandate is taking precedence could meaningfully sway rate pricing.
In currency markets, Dollar leads the way as at this point of the week, followed by Swiss Franc and Loonie. At the other end, Kiwi remains pinned at the bottom, trailed by Aussie and Sterling. Euro and Yen are holding a middle ground.
In Asia, at the time of writing, Nikkei is down -0.13%. Hong Kong HSI is up 0.39%. China Shanghai SSE is up 0.84%. Singapore Strait Times is up 0.44%. Japan 10-year JGB yield is up 0.005 at 1.616. Overnight DOW fell -0.34%. S&P 500 fell -0.40%. NASDAQ fell -0.34%. 10-year yield rose 0.034 to 4.330.
Fed’s Hammack: No case for rate cuts as inflation trends wrong way
Cleveland Fed President Beth Hammack signaled little appetite for near-term easing, telling Yahoo Finance that if the FOMC were meeting tomorrow she “would not see a case for reducing interest rates.” She stressed that inflation has been “too high for the past four years” and it's been "trending in the wrong direction" currently, justifying a stance that remains “modestly restrictive.”
Hammack noted that the economy has so far shown resilience, with no significant signs of downturn that would warrant easier policy. Instead, she emphasized the Fed’s responsibility to ensure inflation expectations remain anchored, cautioning that premature cuts risk undermining that effort.
On tariffs, Hammack flagged that their effects are only beginning to filter through. Typically, it takes "three to four months" for the first signs to emerge, meaning the bulk of the impact will not be seen until 2026. She expects further pass-through of higher costs next year, adding another reason to proceed cautiously on easing.
Fed’s Goolsbee cautious on cuts, Collins open to September easing
Chicago Fed President Austan Goolsbee struck a cautious tone, telling Bloomberg TV that while next month’s FOMC meeting is “live,” the recent pickup in services inflation has made him hesitant about supporting a rate cut.
He pointed to the latest CPI report, where services costs accelerated in a way “probably not driven by tariffs,” calling it a “dangerous data point” for Fed’s inflation fight.
In contrast, Boston Fed President Susan Collins signaled a greater willingness to cut rates soon, telling the Wall Street Journal she could back easing as early as September. Collins emphasized that higher tariffs could weigh on consumer purchasing power and ultimately weaken spending, while also warning that labor market risks are becoming more visible.
Collins acknowledged that she expects inflation to keep rising through the end of 2025 before easing again in 2026, but still viewed the risks to growth and employment as important factors that justify keeping the option of cuts on the table.
Japan core CPI slows to 3.1% as rice inflation cools, but underying pressures persist
Japan’s inflation slowed again in July, with core CPI (ex-fresh food) easing to 3.1% yoy from 3.3% yoy, slightly above expectations of 3.0% yoy. Headline CPI also dipped to 3.1% yoy. The moderation was driven in part by cooling rice prices, which rose 90.7% yoy after surging 100.2% yoy in June, alongside the reintroduction of energy subsidies. Together, these helped bring core inflation down from May’s 3.7% peak.
However, price pressures remain entrenched. Food inflation excluding fresh items actually quickened to 8.3% yoy from 8.2% yoy. Core-core CPI (ex-food and energy) stayed unchanged, elevated at 3.4%. Energy prices provided some relief with a -0.3% yoy annual decline, the first drop since March 2024, but this was not enough to counter stubborn underlying strength.
For policymakers at BoJ, the data paints a mixed picture: rice and energy are finally easing their grip on consumer prices, but persistently high core inflation highlights why interest rate hikes remain on the table. While inflation is clearly off its May peak, the road back toward the 2% target looks slow and uneven.
USD/JPY Daily Outlook
Daily Pivots: (S1) 147.62; (P) 148.01; (R1) 148.78; More...
USD/JPY's break of 148.51 resistance suggests that correction from 150.90 has already completed at 146.20. Larger rebound from 139.87 should still be in progress. Intraday bias is back on the upside for 150.90 first. Firm break there will target 151.22 fibonacci level next.
In the bigger picture, price actions from 161.94 (2024 high) are seen as a corrective pattern to rise from 102.58 (2021 low). Decisive break of 61.8% retracement of 158.86 to 139.87 at 151.22 will argue that it has already completed with three waves at 139.87. Larger up trend might then be ready to resume through 161.94 high. In case the corrective pattern extends with another fall, strong support is expected from 38.2% retracement of 102.58 to 161.94 at 139.26 to bring rebound.
Elliott Wave Forecast: Oil (CL) Anticipating a Decline from $64.7 Level
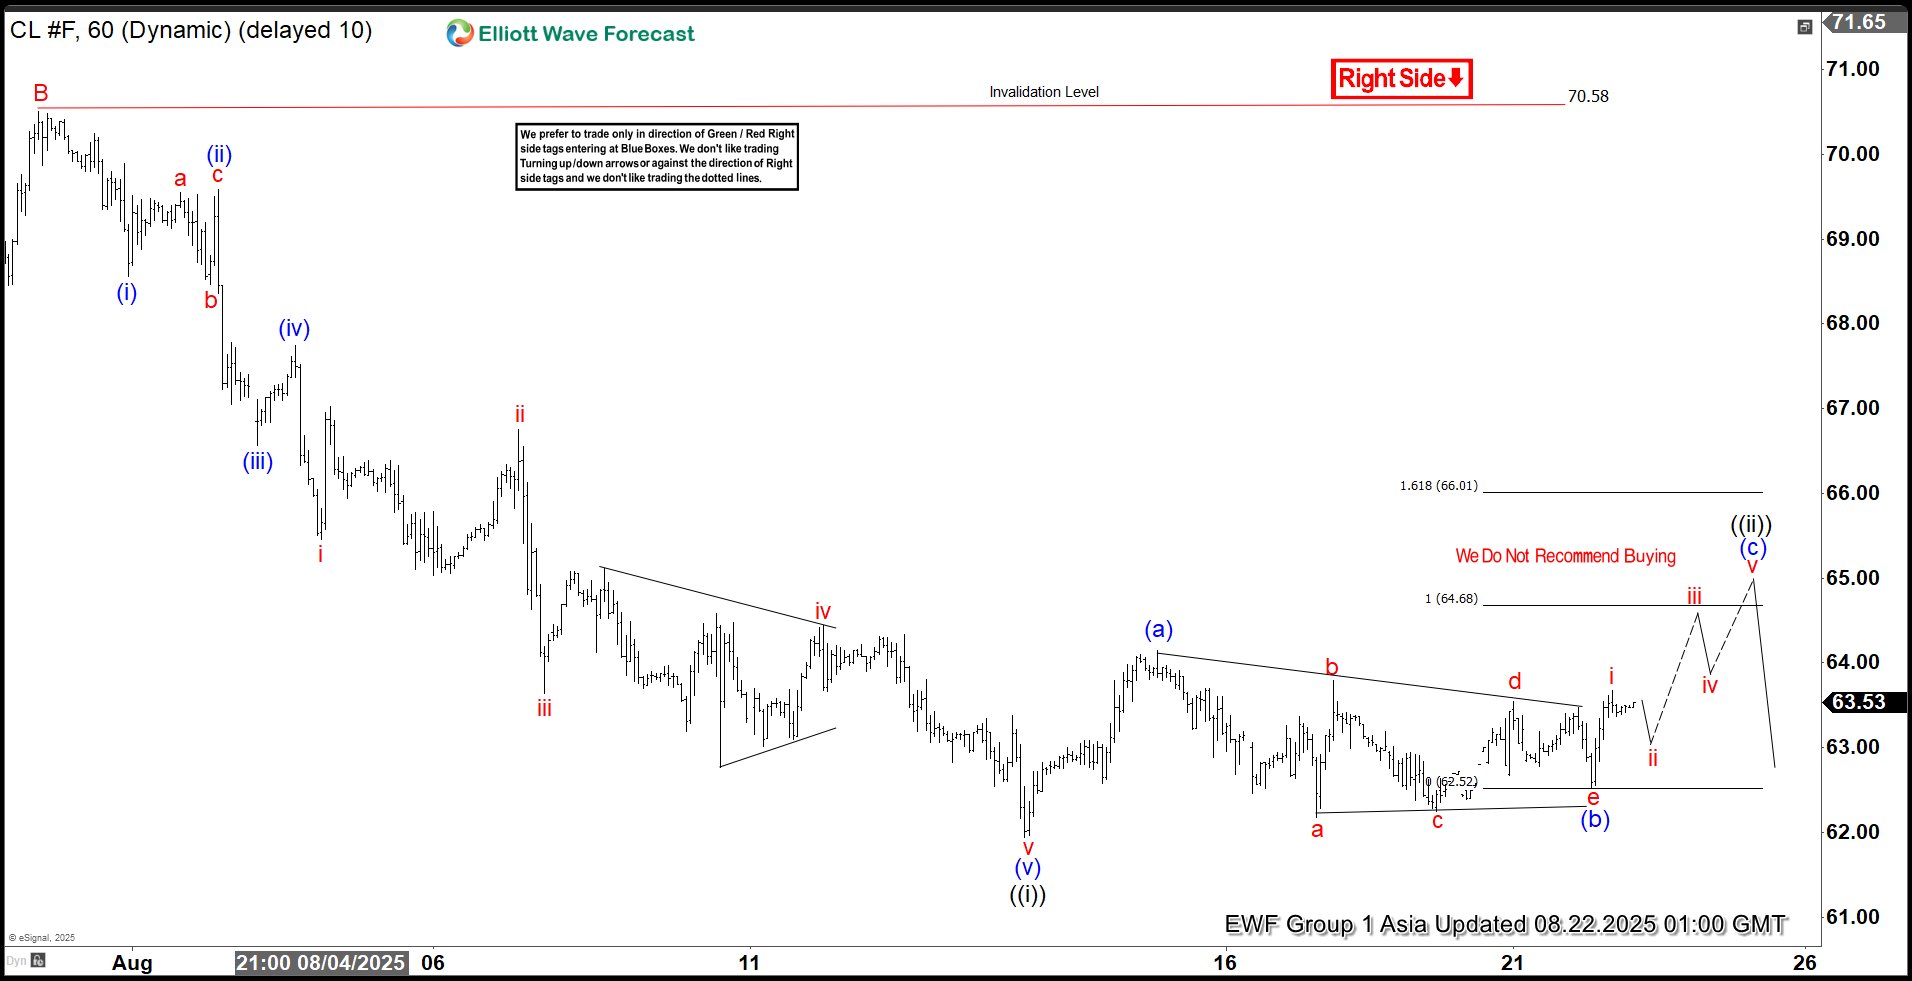
Crude oil (CL) exhibits a bearish trend following its June 23, 2025, peak, signaling further declines. The ongoing descent forms a zigzag Elliott Wave pattern. From the June high, wave A dropped to $64, while wave B rebounded to $70.58, as depicted in the accompanying one-hour chart. Wave C, now unfolding, breaks into a five-wave impulse structure. From wave B’s peak, wave (i) concluded at $68.56, followed by a wave (ii) rally to $69.58. The commodity then fell in wave (iii) to $66.56, with wave (iv) recovering to $67.74.
Currently, oil continues its decline in wave (v), reaching $61.94, completing wave ((i)) in a higher degree. A corrective rally in wave ((ii)) is underway, structured as a lesser-degree zigzag. From wave ((i)), wave (a) climbed to $64.15, followed by a wave (b) pullback forming a triangle, ending at $62.52. Wave (c) is now advancing toward the $64.68–$66.01 range, corresponding to a 100%–161.8% Fibonacci extension of wave (a), to complete wave ((ii)) before resuming the downtrend. In the near term, as long as the $70.58 pivot holds, expect corrective rallies to falter in a 3, 7, or 11-swing pattern, paving the way for further declines.
Oil (CL_F) – 60 Minute Elliott Wave Technical Chart:
CL_F – Elliott Wave Technical Video:
https://www.youtube.com/watch?v=YUbOWRARnzI
USD/JPY Holds Support Strong, Bulls Target Renewed Upside Action
Key Highlights
- USD/JPY formed a base above 146.20 and recovered some losses.
- It cleared a key contracting triangle with resistance at 147.50 on the 4-hour chart.
- EUR/USD could react to the downside if it stays below 1.1720 for a long time.
- Gold could eye a fresh upward move if it settles above $3,365.
USD/JPY Technical Analysis
The US Dollar remained supported above 146.50 against the Japanese Yen. USD/JPY formed a base and recovered above the 147.00 resistance zone.
Looking at the 4-hour chart, the pair cleared a key contracting triangle with resistance at 147.50. The pair even climbed above the 23.6% Fib retracement level of the last main decline from the 150.91 swing high to the 146.21 low.
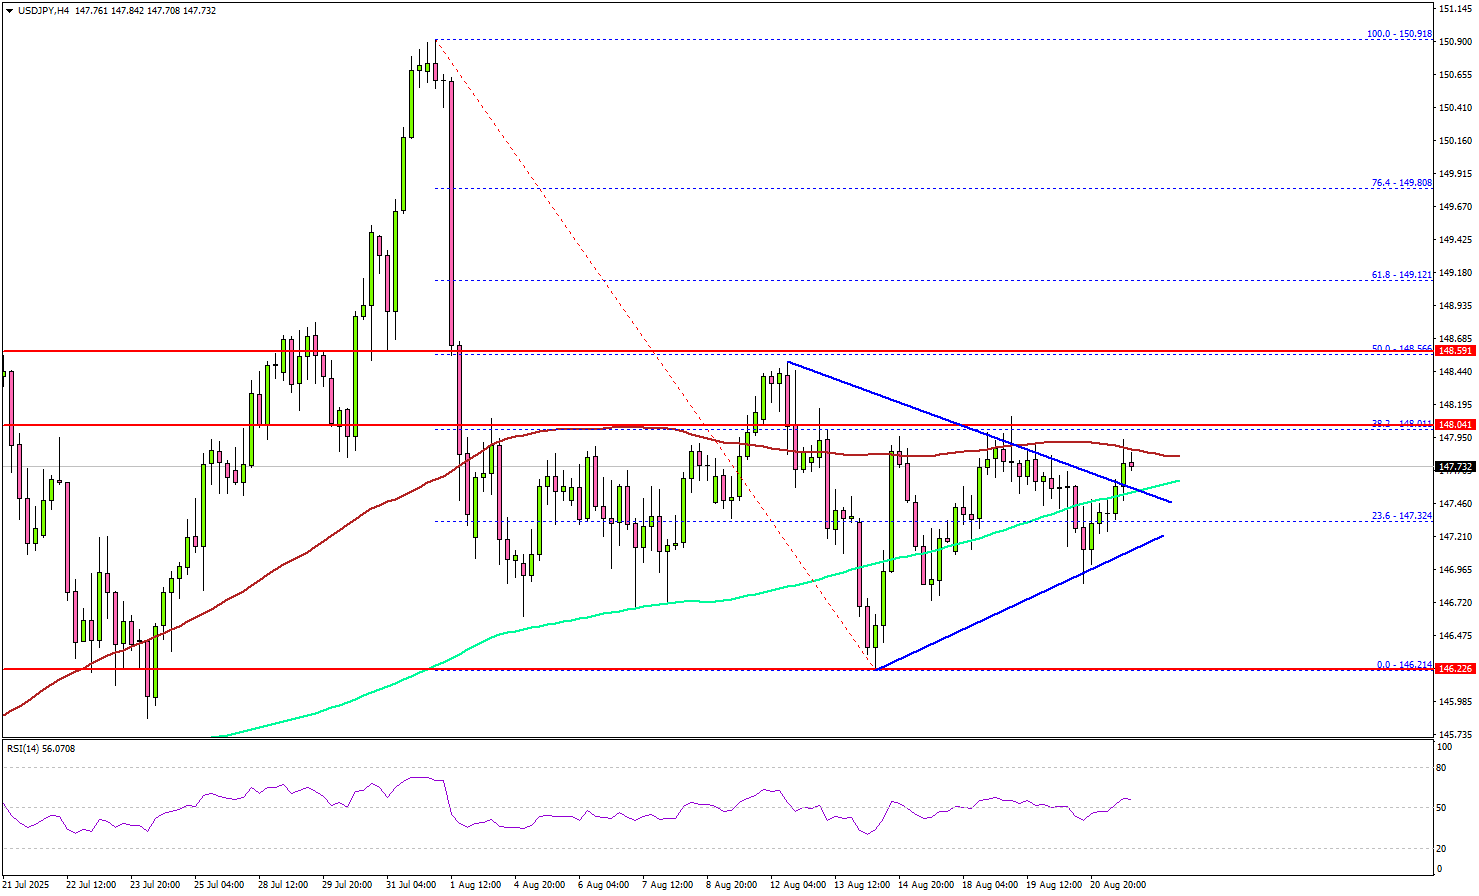
The pair is now consolidating near the 100 simple moving average (red, 4-hour) and the 200 simple moving average (green, 4-hour). On the upside, the pair now faces resistance near 148.00.
The next key resistance sits at 148.50 and the 50% Fib retracement level of the last main decline from the 150.91 swing high to the 146.21 low. A close above 148.50 could set the pace for another increase. In the stated case, the pair could rise toward 149.20, above which the bulls could aim for a move toward 150.00.
On the downside, immediate support is 147.20. The next key support sits at 146.80. Any more losses could send the pair toward the 146.20 support zone.
Looking at EUR/USD, the pair started a consolidating phase and remains below the key barrier at 1.1720.
Upcoming Key Economic Events:
- Fed's Chair Powell speech.
Cliff Notes: A Promising Trend
Key insights from the week that was.
For Australia, the only data release of note this week was the August Westpac-MI Consumer Sentiment Survey. It did not disappoint though, the headline index surging 5.7% to 98.5, the closest it has been to outright ‘optimism’ in 3½ years. This bounce in confidence follows the RBA’s 3rd rate cut of the year and the sustainable return of inflation to the middle of the target range. In the underlying detail, assessments of current family finances vs last year rose a solid 6.2%, while the analogous measure for the year ahead increased 5.4%. Consumers’ spending intentions – which are a consequence not only of current conditions but also the cumulative change in cost-of-living since the pandemic – are steadily improving but still a long way from ‘normal’ levels, ‘time to buy a major household item’ 22pts below its long-run average despite a 4.2% gain in August.
While official and Westpac estimates of consumer spending firmed through Q2, the sustainability of these gains are yet to be tested beyond the end-of-financial-year sales. Typically though, persistent improvements in sentiment and a robust labour market boost spending over time. Such an expectation is incorporated into our forecast recovery in GDP growth to 1.7%yr by end-2025 and 2.2%yr at end-2026. Our latest Quarterly Business Snapshot provides an assessment of how Australian firms are faring currently. Looking out to the medium and long term, this week’s essay by Westpac Chief Economist Luci Ellis considers the path dependency of long-run activity and productivity growth.
Turning to New Zealand, the RBNZ delivered a 25bp rate cut at their August meeting as expected, but the accompanying communications were very dovish. Near-term growth prospects have been revised down, the RBNZ’s 2025 view now 1.6%yr compared to Westpac’s 2.4%yr. However, an additional 1.5 rate cuts into year-end are, along with policy easing to date, still expected to support a robust recovery from 2026. As a consequence, the unemployment rate is expected to peak near the current level and then decline through 2026 and 2027. Our NZ economics team now expect another 2 cuts this year, while remaining of the view that higher interest rates will ultimately prove necessary to manage inflation risks from late-2026.
In the northern hemisphere, the event of the week is still to come – Chair Powell’s address the Kansas City Federal Reserve’s Jackson Hole Symposium. Market participants will put considerable effort into parsing his remarks for any guide on the path ahead for US monetary policy. That said, Chair Powell is unlikely to stray too far from the consensus opinion of the FOMC as outlined in the July FOMC minutes, particularly with a number of key data points due between now and the September meeting.
The July meeting minutes had a clear focus on inflation. "Participants judged that considerable uncertainty remained about the timing, magnitude, and persistence of the effects of this year's increase in tariffs". Though, members were clear on who is paying the price, with "a few participants [describing] a mix of strategies as being undertaken to avoid fully passing on tariff costs to customers… [including] negotiating with or switching suppliers, changing production processes, lowering profit margins, exerting more wage discipline, or exploiting cost-saving efficiency measures such as automation and new technologies.” "Regarding inflation persistence, a few participants emphasized that they expected higher tariffs to lead only to a one-time increase.... [but a] few [other] participants remarked that tariff-related factors, including supply chain disruptions, could lead to stubbornly elevated inflation and that it may be difficult to disentangle tariff-related price increases from changes in underlying trend inflation."
On the labour market, the Committee remains sanguine, "participants observ[ing] that the unemployment rate remained low and that employment was at or near estimates of maximum employment". "Several participants noted that the low and stable unemployment rate reflected a combination of low hiring and low layoffs."
On the policy outlook then, a "majority of participants judged the upside risk to inflation as the greater of these two risks". "Almost all participants agreed that, with the labor market still solid and current monetary policy moderately or modestly restrictive, the Committee was well positioned to respond in a timely way to potential economic developments."
Japan core CPI slows to 3.1% as rice inflation cools, but underlying pressures persist
Japan’s inflation slowed again in July, with core CPI (ex-fresh food) easing to 3.1% yoy from 3.3% yoy, slightly above expectations of 3.0% yoy. Headline CPI also dipped to 3.1% yoy. The moderation was driven in part by cooling rice prices, which rose 90.7% yoy after surging 100.2% yoy in June, alongside the reintroduction of energy subsidies. Together, these helped bring core inflation down from May’s 3.7% peak.
However, price pressures remain entrenched. Food inflation excluding fresh items actually quickened to 8.3% yoy from 8.2% yoy. Core-core CPI (ex-food and energy) stayed unchanged, elevated at 3.4%. Energy prices provided some relief with a -0.3% yoy annual decline, the first drop since March 2024, but this was not enough to counter stubborn underlying strength.
For policymakers at BoJ, the data paints a mixed picture: rice and energy are finally easing their grip on consumer prices, but persistently high core inflation highlights why interest rate hikes remain on the table. While inflation is clearly off its May peak, the road back toward the 2% target looks slow and uneven.
Fed’s Goolsbee cautious on cuts, Collins open to September easing
Chicago Fed President Austan Goolsbee struck a cautious tone, telling Bloomberg TV that while next month’s FOMC meeting is “live,” the recent pickup in services inflation has made him hesitant about supporting a rate cut.
He pointed to the latest CPI report, where services costs accelerated in a way “probably not driven by tariffs,” calling it a “dangerous data point” for Fed’s inflation fight.
In contrast, Boston Fed President Susan Collins signaled a greater willingness to cut rates soon, telling the Wall Street Journal she could back easing as early as September. Collins emphasized that higher tariffs could weigh on consumer purchasing power and ultimately weaken spending, while also warning that labor market risks are becoming more visible.
Collins acknowledged that she expects inflation to keep rising through the end of 2025 before easing again in 2026, but still viewed the risks to growth and employment as important factors that justify keeping the option of cuts on the table.
Fed’s Hammack: No case for rate cuts as inflation trends wrong way
Cleveland Fed President Beth Hammack signaled little appetite for near-term easing, telling Yahoo Finance that if the FOMC were meeting tomorrow she “would not see a case for reducing interest rates.” She stressed that inflation has been “too high for the past four years” and it's been "trending in the wrong direction" currently, justifying a stance that remains “modestly restrictive.”
Hammack noted that the economy has so far shown resilience, with no significant signs of downturn that would warrant easier policy. Instead, she emphasized the Fed’s responsibility to ensure inflation expectations remain anchored, cautioning that premature cuts risk undermining that effort.
On tariffs, Hammack flagged that their effects are only beginning to filter through. Typically, it takes "three to four months" for the first signs to emerge, meaning the bulk of the impact will not be seen until 2026. She expects further pass-through of higher costs next year, adding another reason to proceed cautiously on easing.