
Global markets have shifted from ceasefire euphoria to cautious consolidation, with Brent oil recovering from initial selloff and stabilizing at around $100, as traders await clarity from high-stakes talks in Islamabad. The initial relief rally in stocks has also stalled quickly, highlighting skepticism that the current truce can deliver a lasting de-escalation.
At the center of the current setup is a clear binary outcome. The Islamabad talks mark the first real transition from a “handshake ceasefire” to a potential “verified accord”, and markets are now waiting for concrete terms rather than political signaling.
If negotiations deliver a credible framework—particularly unconditional reopening of the Strait of Hormuz and a defined timeline for clearing maritime mines—the war premium embedded in oil prices could unwind rapidly. In that scenario, Brent could slide back toward the $80 region as supply normalization becomes credible.
On the other hand, if the U.S. delegation (led by JD Vance) and the Iranian delegation fail to agree on the “Red Line”—which the White House has defined as the total end of uranium enrichment—the ceasefire will be viewed as a 14-day window for Iran to refortify the Strait. In this case, Brent will likely slingshot back to $110+ immediately.
For now, the market is treating the ceasefire as “fragile by design”, and underlying developments suggest that caution is warranted.. Continued Israeli strikes in Lebanon and reports of Iran reasserting control over Hormuz transit highlight how quickly tensions can resurface, even within the ceasefire window.
Operational realities in the Strait of Hormuz remain a major constraint. Despite reopening narratives, transit is far from normalized. Additionally, the IRGC intermediaries are demanding lump-sum “transit fees” of up to $2 million per passage, often settled in yuan or tether (USDT), for passage through the Strait effectively bakes a permanent cost increase into every barrel of Middle Eastern crude.
Meanwhile, regional oil facilities remain under threat, with Iran striking sites in nearby countries after the ceasefire, including the East-West Pipeline in Saudi Arabia that has been used to bypass the blockaded Strait of Hormuz. Supply disruptions could still persist regardless of diplomatic progress.
Against this backdrop, traders are reluctant to take directional bets. With talks scheduled for Friday, positioning has turned defensive, as market participants reduce exposure to avoid being caught on the wrong side of a potential weekend gap.
For now, oil remains anchored near $100 as markets await confirmation. Islamabad is the immediate catalyst, but the broader question is whether the ceasefire evolves into a durable framework—or simply marks a brief pause before the next escalation.
In the currency markets, selling pressure has shifted to Yen today, as markets react to the lack of any signal from Kazuo Ueda on the possibility of a rate hike this month. Beyond that, trading remains largely range-bound as participants stay cautious ahead of the geopolitical catalyst.
For the week so far, Dollar remains the worst performer, followed by Yen and Loonie. Kiwi leads gains, with Aussie and Sterling also firm, while Euro and Swiss Franc continue to trade in the middle of the pack.
In Europe, at the time of writing, FTSE is down -0.41%. DAX is down -1.39%. CAC is down -0.71%. UK 10-year yield is up 0.101 at 4.752. Germany 10-year yield is up 0.06 at 3.011. Earlier in Asia, Nikkei fell -0.73%. Hong Kong HSI fell -0.54%. China Shanghai SSE fell -0.72%. Singapore Strait Times fell -0.38%. Japan 10-year JGB yield rose 0.025 to 2.397.
US Core PCE Inflation Eases Slightly to 3% in February
US February data showed a clear split: income declined, but consumer spending remained strong. At the same time, core PCE inflation eased only slightly, highlighting that underlying price pressures are still sticky. Read More.
US Initial Jobless Claims Rise but Continuing Claims Signal Labor Market Resilience
US jobless claims data sent mixed signals. Initial claims rose above expectations, hinting at a gradual cooling in labor demand. But continuing claims dropped to their lowest levels since mid-2024, showing that unemployed workers are still finding jobs quickly. Read More.
BoJ’s Ueda: Negative Real Rates Sustain Investment, Warns of Fiscal Crowding-Out Risks
BoJ’s Ueda highlights negative real rates supporting investment but warns rising fiscal spending could lift yields and risk crowding out private sector activity. Read More.
RBNZ’s Breman: Ready to Act Decisively with Rate Hikes if Inflation Jumps
RBNZ Governor Anna Breman delivered a clear hawkish signal: if inflation starts rising again, the central bank is ready to act decisively with rate hikes. With risks now tilted to the upside, easing is off the table as policymakers focus on preventing a renewed inflation surge. Geopolitical tensions and supply disruptions are adding uncertainty, but the policy bias is clear—RBNZ is prepared to tighten again if price pressures build. Read More.
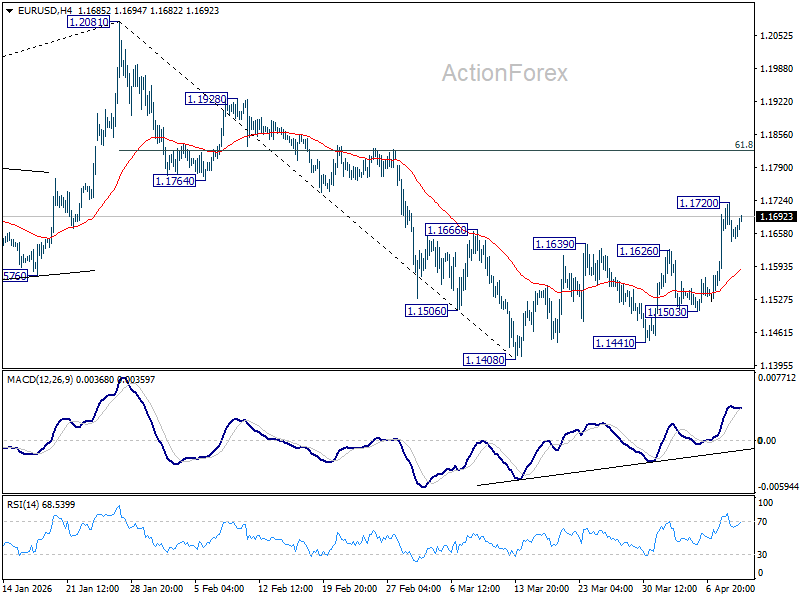
EUR/USD Mid-Day Outlook
Daily Pivots: (S1) 1.1593; (P) 1.1658; (R1) 1.1727; More….
Intraday bias in EUR/USD is turned neutral first with current retreat. Some consolidations could be seen but further rise is expected as long as 55 4H EMA (now at 1.1584) holds. Fall from 1.2081 could have completed as a correction at 1.1408. Above 1.1720 will resume the rise from 1.1408 to 1.8% retracement of 1.2081 to 1.1408 at 1.1824. However, sustained break of 55 4H EMA will suggest that the rebound has completed, and bring retest of 1.1408 low instead.
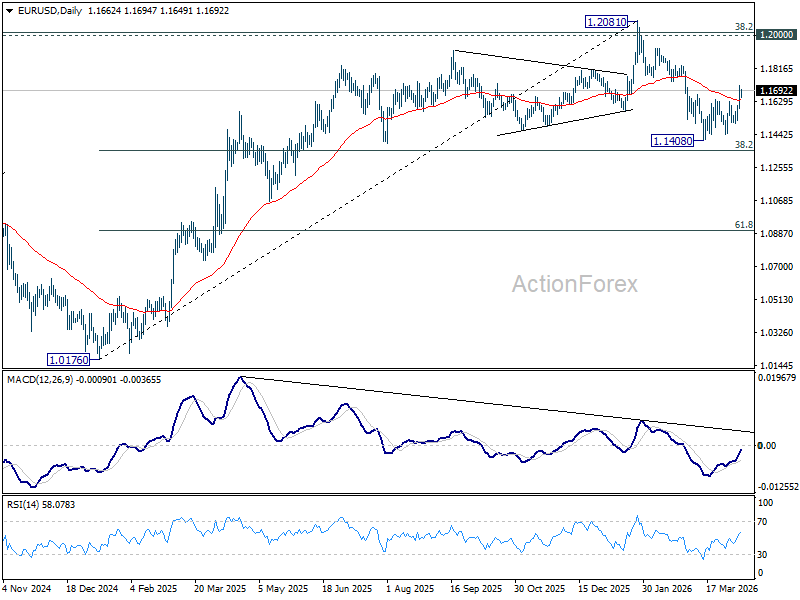
In the bigger picture, the strong support from 38.2% retracement of 1.0176 to 1.2081 at 1.1353 suggests that the pullback from 1.2081 is more likely a corrective move. Strong support was also found in 55 W EMA (now at 1.1505). Focus is back on 1.2 key cluster resistance level. Decisive break there will carry long term bullish implications. Nevertheless, break of 1.1408 support will revive the case of medium term bearish trend reversal.


