
Australian Dollar tumbles broadly today after poor employment data, which suggests RBA is still on track for more easing. Additionally, the Aussie and Kiwi are weighed down by risk aversion in Asian markets. Hong Kong stocks lead others lower again on poor Chinese economic data, and continued unrest in the city. Investors are getting increasingly frustrated by the inability of the Chinese government to solve the deadlock. Yen is currently the strongest one, followed by Dollar and then Swiss Franc.
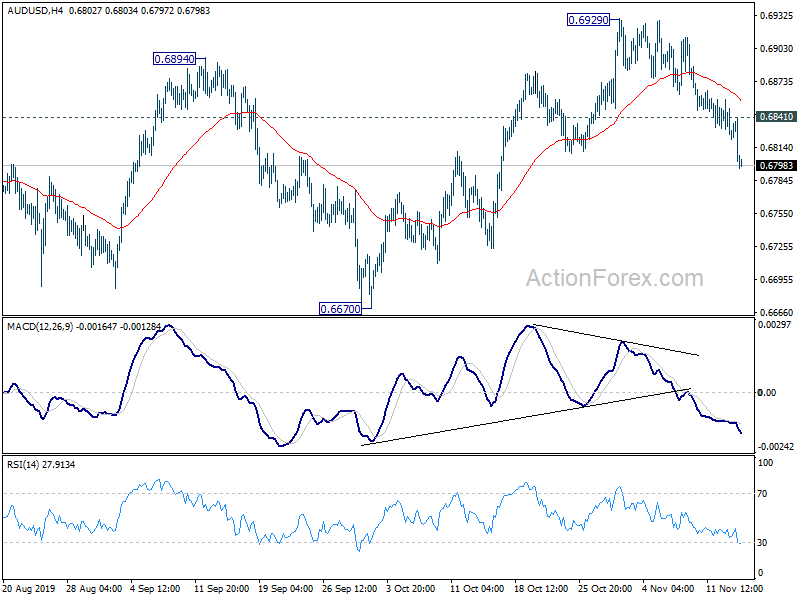
Technically, AUD/USD’s break of 0.6809 support suggests completion of rebound from 0.6670 at 0.6929. Further fall should be seen back to retest 0.6670 low. EUR/AUD’s breach of 1.6181 minor support also suggests bottoming at 1.5976. Further rise is now likely for 1.6432 resistance. USD/JPY is pressing 108.64 support. Firm break there will be an early sign of completion of rebound from 104.45. Deeper fall would then be seen to 107.88 support for confirmation. Such development could prompt deeper selloff in other Yen crosses.
In Asia, currently, Nikkei is down -0.62%. Hong Kong HSI is down -0.77%. China Shanghai SSE is up 0.42%. Singapore Strait Times is down -0.21%. Japan 10-year JGB yield is down -0.0257 at -0.073. Overnight, DOW rose 0.33%. S&P 500 rose 0.07%. NASDAQ dropped -0.05%. 10-year yield dropped -0.039 to 1.870, lost 1.9 handle.
Australia employment contracted, unemployment rate edged up
In seasonally adjusted terms, Australia employment contracted by -19k to 12.9m in October, way below expectation of 16.2k growth. That’s also the largest monthly drop in three years since late 2016. Full-time jobs dropped -10.3k while part time jobs dropped -8.7k. Unemployment rate rose 0.1% to 5.3%, above expectation of 5.2%. At the same time, participation rate dropped -0.1% to 66.0.
Looking at some details, unemployment rate increased by 0.3 pts in New South Wales (4.8%), and by 0.1 pts in Victoria (4.8%). The seasonally adjusted unemployment rate decreased by 0.2 pts in Tasmania (5.9%), and by 0.1 pts in Queensland (6.5%), with Western Australia and South Australia recording no change.
The set of data suggests that Australia remains a long way from RBA’s full employment estimation, i.e., unemployment rate at around 4.5%. More monetary and fiscal stimulus is still needed to support the job and wage markets, and drive up inflation. RBA is still on track for more rate cuts or even QE next year.
RBNZ Bascand: The economy is somewhere near a turning point
RBNZ Deputy Governor Geoff Bascand said in an interview that “we actually think the economy is somewhere near a turning point.” He admitted the economy is “definitely going through a weaker stage” and “near-term risks “are probably more on the downside, but it’s a question of how long they persist,”
However, he added, “we’ve put a lot of stimulus in. We’ve got a bit longer to see how it’s transmitting. There’s time to see how that plays out and make a call in February if needed.”
The central bank surprised the markets by keeping the OCR unchanged at 1.00% yesterday. Governor Adrian Orr described the decision as a “tough one”, and the monetary policy committee had debated whether to “take one more insurance cut.”
Japan GDP grow slowed to just 0.2% annualized in Q3
Japan GDP grew 0.1% qoq in Q3, slowed from Q2’s 0.3% qoq and missed expectation of 0.2% qoq. Annualized rate slowed sharply from 1.8% to just 0.2%, way below expectation of 0.9%. GDP deflator accelerated to 0.6% yoy, up from 0.4% yoy and beat expectation of 0.5% yoy. Private consumption growth slowed to 0.4%, down from 0.6%, despite pre-tax hike purchases. Capital spending, though, accelerated to 0.9%, up from 0.7%.
Economy Minister Yasutoshi Nishimura blamed the weak GDP growth on worsening relations with South Korea. He said that had a “big impact” on exports, while dropped -0.7% from the prior quarter. Also, declines in in-bound tourists from South Korea was a drag, along with some impact form the prolonged trade war between US and China.
China production, retail sales, investment all missed expectations
The batch of October economic data released from China today is way below expectations. Industrial production growth slowed to 4.7% yoy, below expectation of 5.5% yoy. Fixed asset investment slowed to 5.2% ytd yoy, below expectation of 5.4%. That’s also the worst January-October growth since record began in 1996. Retail sales grew 7.2% yoy, missed expectation of 7.8% yoy, matching the more than 16 year low hit in April.
The chance of a recovery in growth momentum hinges on the results of the trade negotiations with US. Tariff rollbacks would be the key for the “easier” phase one deal. Without removing some of the imposed tariffs, in particular the September ones, the deal would be rather meaningless to the real Chinese economy. Of course, the biggest challenges come in the second phase of negotiations when core and fundamental issues, like subsidies to state-owned enterprises, would be addressed.
Suggested reading on China: China Data Reveal Further Downside Risks in Economy.
Looking ahead
UK retail sales will be a feature in European session. Germany will release Q3 GDP. Eurozone will also release GDP and employment change. Swiss will release PPI. Later in the day, Canada new housing price index, US PPI, initial jobless claims will be featured.
AUD/USD Daily Report
Daily Pivots: (S1) 0.6820; (P) 0.6839; (R1) 0.6856; More…
AUD/USD’s break of 0.6809 support suggests that corrective recovery from 0.6670 has completed at 0.6929 already. Intraday bias is turned back to the downside for retesting 0.6670 first. Break will resume larger down trend. On the upside, above 0.6841 minor resistance will turn intraday bias neutral and bring recovery. But risk will stay on the downside as long as 0.6929 resistance holds.
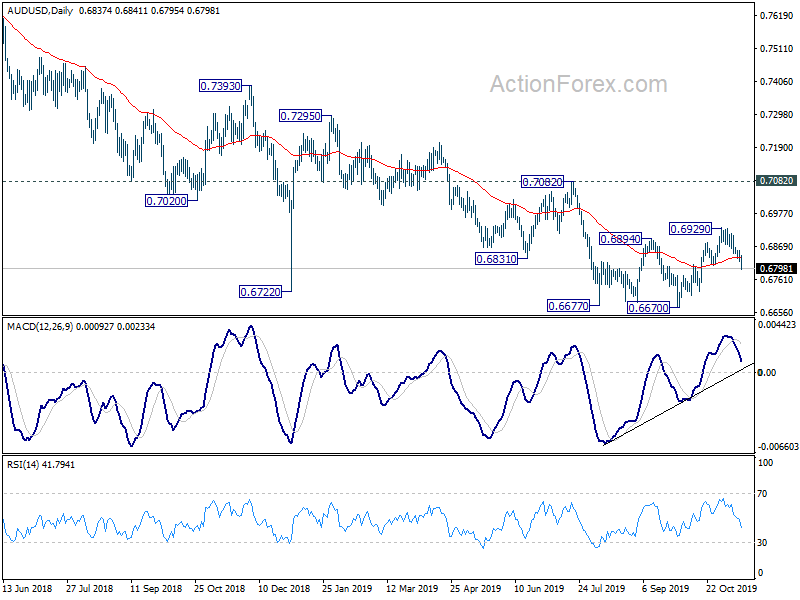
In the bigger picture, the case of medium term bullish reversal is building up with bullish convergence condition in weekly MACD. But there is no clear confirmation yet. As long as 0.7082 resistance holds, larger down trend from 0.8135 (2018 high) is still expect to continue to 0.6008 (2008 low). However, decisive break of 0.7082 will confirm medium term bottoming and bring stronger rally back to 55 month EMA (now at 0.7529).
Economic Indicators Update
| GMT | Ccy | Events | Actual | Forecast | Previous | Revised |
|---|---|---|---|---|---|---|
| 23:50 | JPY | GDP Q/Q Q3 P | 0.10% | 0.20% | 0.30% | |
| 23:50 | JPY | GDP Deflator Y/Y Q3 P | 0.60% | 0.50% | 0.40% | |
| 0:00 | AUD | Consumer Inflation Expectations Nov | 3.60% | |||
| 0:01 | GBP | RICS Housing Price Balance Oct | -5% | -3% | -2% | -3% |
| 0:30 | AUD | Employment Change Oct | -19.0K | 16.2K | 14.7K | 12.5K |
| 0:30 | AUD | Unemployment Rate Oct | 5.30% | 5.20% | 5.20% | |
| 2:00 | CNY | Retail Sales Y/Y Oct | 7.20% | 7.80% | 7.80% | |
| 2:00 | CNY | Industrial Production Y/Y Oct | 4.70% | 5.50% | 5.80% | |
| 2:00 | CNY | Fixed Asset Investment YTD Y/Y Oct | 5.20% | 5.40% | 5.40% | |
| 4:30 | JPY | Tertiary Industry Index M/M Sep | 1.80% | 0.20% | 0.40% | 0.30% |
| 7:00 | EUR | Germany GDP Q/Q Q3 P | -0.10% | -0.10% | ||
| 7:30 | CHF | Producer and Import Prices M/M Oct | 0.00% | -0.30% | ||
| 7:30 | CHF | Producer and Import Prices Y/Y Oct | -2.10% | -2.00% | ||
| 9:30 | GBP | Retail Sales M/M Oct | 0.20% | 0.00% | ||
| 9:30 | GBP | Retail Sales Y/Y Oct | 3.70% | 3.10% | ||
| 9:30 | GBP | Retail Sales ex-Fuel M/M Oct | 0.30% | 0.20% | ||
| 9:30 | GBP | Retail Sales ex-Fuel Y/Y Oct | 3.50% | 3.00% | ||
| 10:00 | EUR | Eurozone GDP Q/Q Q3 P | 0.20% | 0.20% | ||
| 10:00 | EUR | Employment Change Q/Q Q3 P | 0.20% | 0.20% | ||
| 13:30 | USD | PPI M/M Oct | 0.20% | -0.30% | ||
| 13:30 | USD | PPI Y/Y Oct | 0.90% | 1.40% | ||
| 13:30 | USD | PPI Core M/M Oct | 0.20% | -0.30% | ||
| 13:30 | USD | PPI Core Y/Y Oct | 1.60% | 2.00% | ||
| 13:30 | USD | Initial Jobless Claims (Nov 8) | 215K | 211K | ||
| 13:30 | CAD | New Housing Price Index M/M Sep | 0.20% | 0.10% | ||
| 15:30 | USD | Natural Gas Storage | 34B | |||
| 16:00 | USD | Crude Oil Inventories | 7.9M |


