Live Comments
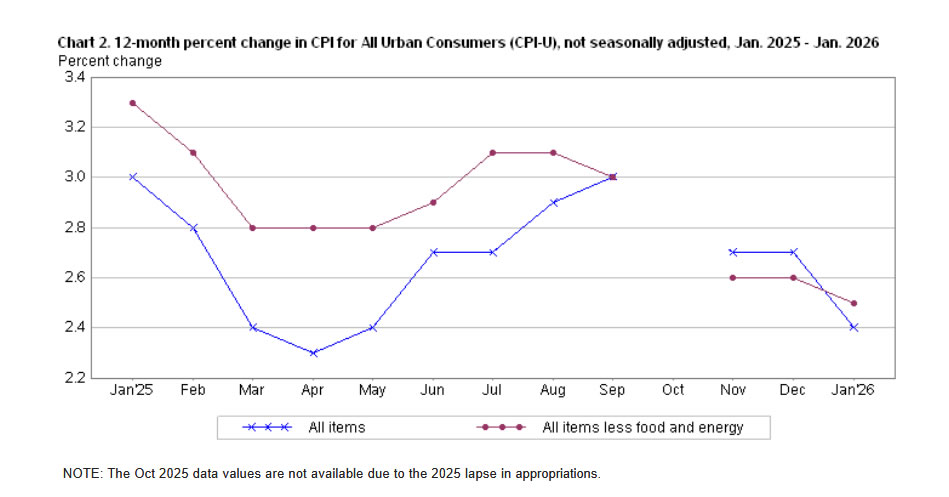
US CPI Cools to 2.4% as energy drag offsets shelter gains
US headline CPI eased from 2.7% yoy to 2.4% in January, slightly below expectations of 2.5% and marking the lowest reading since May.
Core CPI also moderated, slipping from 2.6% to 2.5%, matching forecasts and reaching its lowest level since early 2021. Over the past 12 months, the energy index fell -0.1%, while food prices rose 2.9%.
On a monthly basis, CPI rose 0.2%, while core CPI increased 0.3%. Shelter remained the largest contributor to the monthly gain, rising 0.2%, alongside a 0.2% increase in food prices. These advances were partially offset by a -1.5% decline in energy prices, which helped cap overall inflation momentum.
The data reinforce the view that inflation pressures are gradually easing, though core components — particularly shelter — continue to keep underlying price growth above the Fed’s 2% target.
BoE’s Pill warns disinflation incomplete despite projected CPI drop
BoE Chief Economist Huw Pill said UK underlying inflation remains around 2.5%. He emphasized that policy must continue to bear down on price pressures to ensure disinflation is sustained.
While headline inflation is projected to fall toward 2% in April or May, Pill noted that much of the expected decline reflects temporary effects from measures announced in Chancellor Rachel Reeves’ November budget. Stripping out that half-percentage-point impact, underlying price pressures remain firmer than the 2% target.
"In order to complete that (disinflation) process, monetary policy has a part of play and that means we do need to retain some restrictiveness in the stance of monetary policy until that process of disinflation is complete," Pill said.
Pill said monetary policy still carries a degree of restrictiveness, even if its exact magnitude has become "more ambiguous now". "Perhaps there’s more ambiguity about the extent of restriction than there is ambiguity about the incompleteness of the disinflation process to target," he added.
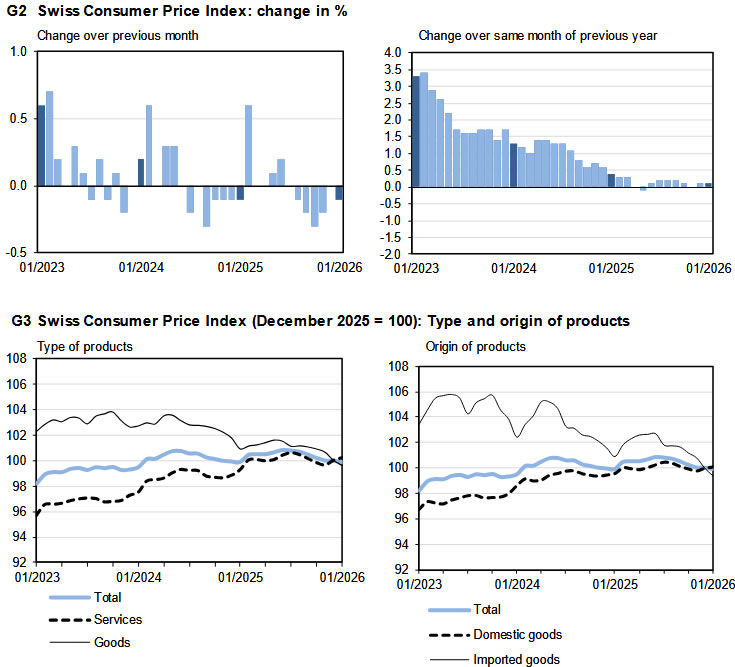
Swiss CPI flat as imported prices drag
Switzerland’s consumer prices slipped -0.1% mom in January, undershooting expectations for a flat reading. The decline was largely driven by a -0.6% drop in imported product prices, while domestic prices edged up 0.1% on the month. Core CPI, which excludes fresh and seasonal products, energy and fuel, rose 0.1%, suggesting limited underlying pressure.
On an annual basis, headline inflation held steady at 0.1% yoy, in line with expectations. Core inflation was unchanged at 0.5%, with domestic product prices also steady at 0.5% from a year earlier. The data point to a subdued price environment, with limited momentum building in domestic costs.
Imported prices remained a key drag, falling -1.5% year-on-year compared with a -1.6% decline previously. The stronger Swiss Franc and softer external price dynamics continue to suppress imported inflation, keeping overall price growth well below levels seen elsewhere in Europe.