Week beginning 19 March 2018
- Near term positives set to fade for commodities.
- Australia: RBA minutes, Westpac-MI leading index, labour force.
- NZ: RBNZ policy decision and targets review, Westpac-MM consumer confidence.
- China: property prices.
- Euro Area: EU Summit.
- US: FOMC policy decision.
- UK: BoE policy decision.
- Markit flash PMIs.
- Key economic & financial forecasts.
Information contained in this report current as at 16 March 2018.
Near Term Positives Set to Fade for Commodities
Westpac has revised its near term forecasts for iron ore and met coal, holding them around current levels to the September quarter before they correct into 2019 and hit a low in late 2019 or early 2020. Driving these revisions have been the changes to our economic growth forecasts, the impact of Chinese industrial/environmental policies and the supply response of commodity producers.
Firstly, global activity currently is currently much stronger than our earlier expectations. The broad global demand indictors (global PMIs, industrial production and trade) ended 2017 on a very strong note and continued to strengthen through early 2018. Added to this are the upwards revisions we have made to our US and global growth forecasts. Since the start of the year there has been a significant shift in the stance of US fiscal policy just as the economy was gaining momentum. With the unemployment rate of 4.1% comfortably below the estimates of full employment (4.5%), it arguably raises some concerns about the possibility of the economy overheating sometime soon. Arguably, we have not seen a comparable policy “mix” since the 1960’s. As a result Westpac has lifted its forecasts for US growth from 2.5% in 2018 and 2.2% in 2019 to 3.0% and 2.5% respectively and revised our forecast for global growth from 3.8% in 2018 to 3.9%.
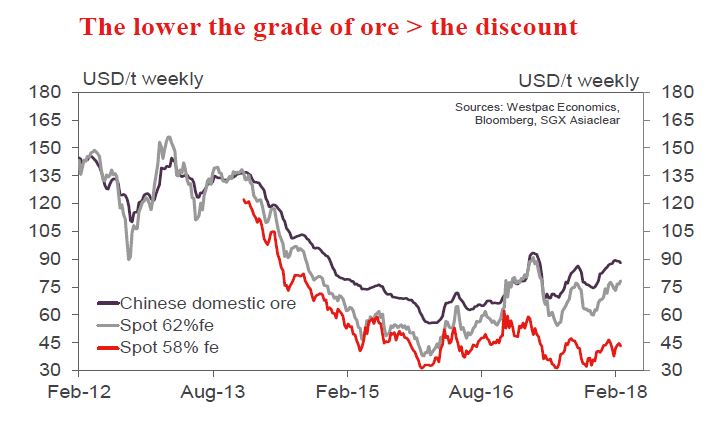
Secondly, we now have a better understanding of how the environmental policies to improve air quality, combined with those aimed at restructuring the Chinese steel industry, are impacting demand for iron ore and coal. The controls put in place to reduce air pollution resulted in the closure of smaller, less efficient furnaces diverting steel production to larger more efficient furnaces. An important note here is that larger furnaces tend to use more imported ore as they are often located closer to the coast. And these larger furnaces are also under pressure to reduce emissions, as well as improve overall efficiencies, so they have increasingly turned to the higher grades of imported ore. As such, this focus on environmental outcomes and efficiency has directly led to an increase in demand for imported ore and, in particular, higher grades of ore. This explains why the discount for 58%fe compared to 62%fe) has widened to 44% in February compared to an average of 22% in 2016. President Xi Jinping has delivered blue skies to the middle classes, something that is not going to be easy to take away.
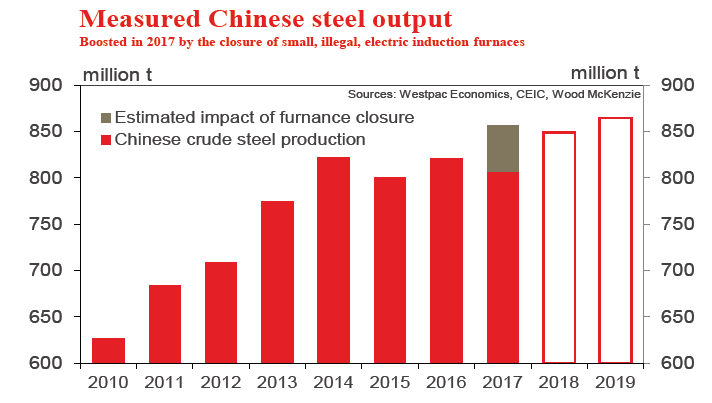
 Thirdly, through 2017 there was a concentrated clampdown on illegal Electric Induction Furnaces (EIF) which, by some estimates, took as much as 49.4mt out of Chinese steel production in the year. This illegal steel production is not measured in the official data, whereas the lift in production from furnaces taking up the slack is measured. Compared to the official steel output, 49.4mt loss in EIF production represents around 6% of 2016 output which is more than the 4% increase in official steel production reported in 2017. That is, the measured rise in official steel production in 2017 was due to the closure of EIFs and not new output. EIFs use a lot more scrap steel that blast furnaces so not only did diverting production to blast furnaces increase the demand for imported ore but it also lifted the demand for iron ore overall.
 And finally, as smaller blast furnaces were being closed, local Chinese iron ore mines were also reducing output despite the strong support of higher domestic ore prices. Through the year to December 2017, Chinese ore production contracted around 9% and we suspect this has continued into early 2018. Therefore, even as demand for domestic ore declined with the closure of smaller furnaces, ore supply also contracted leaving the price of domestic ore well supported. Furthermore, the adjustment in both legal and illegal steel capacity, at the timeof very low steel inventories, helps explain why steel prices, and thus margins at steel mills, remained well supported through 2017. These strong margins at steel mills enabled purchasers to bid up the price of higher grades of iron ore.
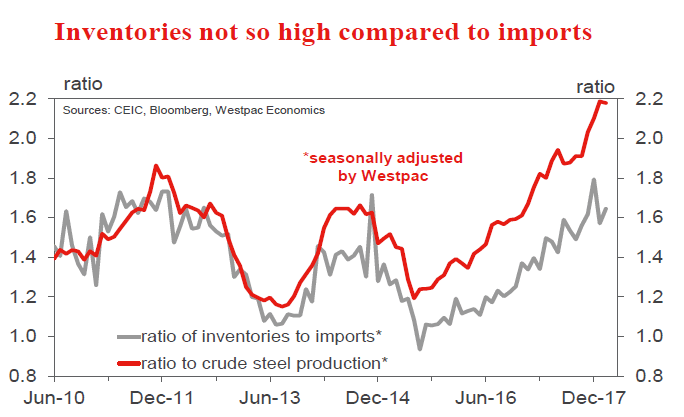 Even the rise in Chinese port inventories to new record highs has to be considered in the light of this increase in demand for imported ore. It is true that inventories are at record highs compared to steel production but this doesn’t take into account that; a) demand for imported ore has risen significantly this year, and b) most of the ore in inventories is reported to be of lower grade ores. If you compare inventories to the current level of imports, they are high but do not appear to be excessive so part of the build may be a deliberate lift to maintain import coverage.
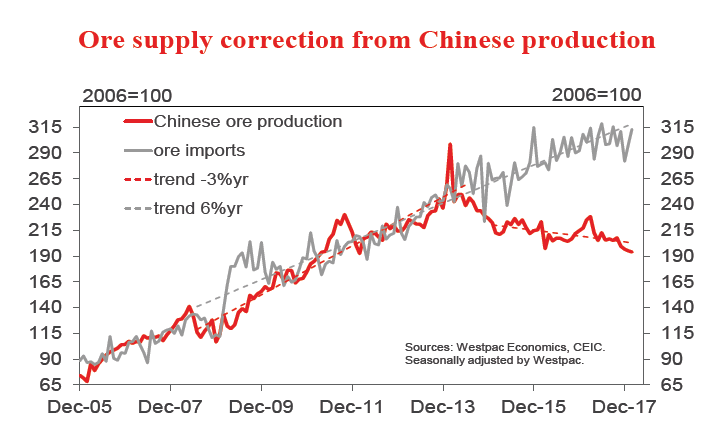 At the same time, a lift in the supply of ore, particularly for the higher grades, does not appear to have fully met this increase in demand. Total imports are almost 5% higher in 2017 but output from Australian and Brazil lagged expectations with no perceivable lift from the more marginal suppliers despite the higher than expected prices. Total imports, which are best described as flat since 2017Q1, are currently just holding trend.
So 2018 started with a very positive environment for iron ore even as steel output eased in the second half of 2017. Going forward, steel output should correct modestly in line with a further moderation in Chinese construction activity. Construction activity already slowed at end 2017, falling back to 5%yr in December, with little chance of a recovery from here as the Chinese economy slows and credit conditions tighten. Ore supply should also lift from the dominant exporters as margins remain extremely attractive further pressuring prices later in the forecast horizon. We see the 62%fe (cfr) falling to US$60/t be end 2018 and a low of US$52/t in late 2019.
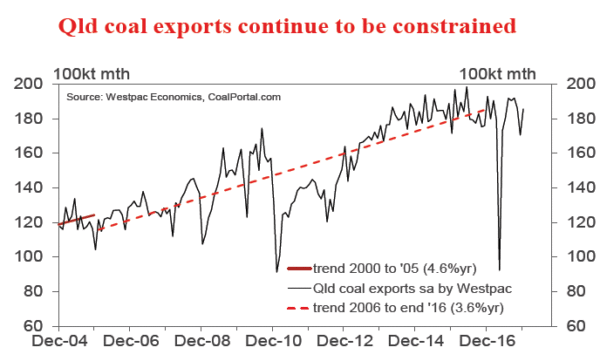
 With met coal, Australian production has suffered ongoing disruptions from cyclones, floods, industrial disputes and infrastructure delays. Exports from Queensland, which is the largest supplier of met coal, have broadly gone sideways since early 2014 except for the brief but significant disruption caused by cyclone Debbie in April 2017. Given that Australia is the main supplier of met coal in the seaborne market, and thus overall supply is lagging behind demand, it is only natural that prices have been well supported. We are looking for Qld coking coal to hold around US$230/t to the September quarter before easing back to US$220/t in the December quarter and then hitting a low of US$130/t at the end of 2019.
 The week that was
In the past week, surging business confidence and a sense of positivity amongst consumers has been reported for Australia; at the same time however, political and economic confidence in the US has taken a hit.
Business conditions, as reported by the NAB business survey, hit a record high in Feb back to 1994. Confidence edged back in the month, but remains at an above-average level. The strength in conditions has broadened by state, with strong conditions now being reported in NSW, Victoria and Queensland. However, by industry, there remains a material divergence. Momentum is most apparent in the goods producing industries of construction, manufacturing and mining. Of these industries, the construction and manufacturing sectors are benefiting from elevated levels of residential construction activity as well as the strong uptrend in public and private non-residential construction and infrastructure investment. Meanwhile, mining is profiting from the elevated level of commodity prices and Australian producers’ low cost structure. Conditions in the business and consumer sectors are more subdued, but still much improved. Abstracting from monthly volatility, the Feb survey points to continued robust demand for labour and a desire to invest. However, evident in official ABS releases, this investment is lopsided, with strength in construction, but not in non-mining equipment spending.
The Australian Chamber Westpac Survey of Industrial Trends offers a deeper investigation of the state of Australian manufacturing. Though overall activity and new orders have pulled back from their late-2017 highs, they remain at elevated levels versus history. Further, export orders continue to track higher. Looking ahead, expectations for the coming six months are very positive. While investment intentions have turned down, they are still indicative of solid growth in equipment and construction spending. The need to invest is structural as well as cyclical: the survey detail highlights that capacity is a key impediment to growth.
Turning then to consumer sentiment, the Westpac-MI survey printed at 103, a touch higher than February and the fourth consecutive reading above the 100 optimist/ pessimist divide. Family finances versus a year ago and expectations for the year ahead both improved in the month, as did year-ahead expectations for the economy. In contrast, the five-year view on the economy deteriorated in the month, perhaps in response to rising trade frictions following President Trump’s tariff announcement. Supporting this view, ‘international conditions’ had the highest news recall in 2 ½ years and was regarded unfavourably. Taking a longer-term view, economic conditions are above average; along with continued strength in employment growth, this is resulting in households having strong confidence in their job prospects. That said, family finances remain sub-par and this is affecting spending decisions. ‘Time to buy a dwelling’ remains well below average on affordability concerns. Notably, the ‘time to buy’ index for Sydney and Melbourne is much lower than elsewhere and house price expectations in NSW are materially lower than elsewhere.
Moving offshore, the first stop is New Zealand. There, Q4 GDP came in line with our New Zealand team’s expectation of 0.6%. That was however below the market’s expectation of 0.8%. As discussed by Westpac NZ economics, the pace of growth has slowed over the last year, and this softer momentum is expected to continue in the near term given building industry growth constraints and poor dairying conditions as well as uncertainty over the impact of the new Government’s policies. Regarding the RBNZ’s response, our team does not believe that this result will prompt a change in their tone, but it does reinforce (as Westpac has held for some time) that rate hikes are further off than many in the market expect.
Now to the US, another disappointing retail sales print was received this week, February seeing a third consecutive decline in sales. The January outcome was revised up, but only to -0.1%. Weather was certainly a factor in February in two ways: auto sales continue to come back to a more normal level after their hurricane-induced spike in late 2017; also abnormally cold weather in February weighed on gasoline and store sales as consumers stayed home. While we expect consumer spending to strengthen in coming months as weather effects abate, our core expectations remains that consumption growth will be weaker in 2018 than 2016 and 2017. Despite the benefit of tax cuts, real income growth remains weak and the savings rate is low; further, wealth is highly skewed towards the top of the income distribution. Hence, support for additional discretionary spending is limited. Going forward, higher interest rates are also likely to weigh on durables spending, particularly autos. This result has put a dent in expectations for Q1 GDP, but for now markets remain positive on the 2018 view, principally because of the scale of support offered by legislated government spending and belief in stronger business investment.
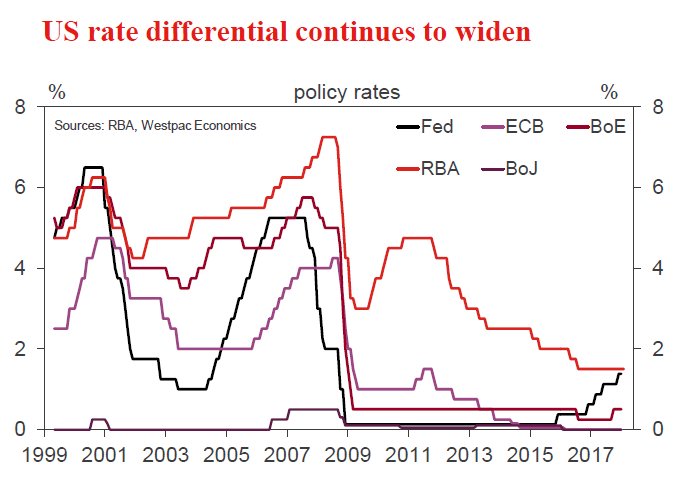
The key source of uncertainty for the US remains the administration of President Trump. Following Gary Cohn’s resignation as Chief Economic Advisor, Secretary of State Tillerson has since been fired. And, as we noted last week, murmurs of trade actions against China are surfacing. Equities have been little affected given the market’s optimism over growth. But the US dollar is under pressure. A material interest rate differential has opened up between the US and the rest of the developed world. Yet the US dollar index (DXY) is almost 13% below its December 2016 peak. The impact of fiscal uncertainty and rising deficits is clear for all to see. It is not surprising then that the first point of business for President Trump’s new Chief Economic Advisor Larry Kudlow has been to stand in support of the currency and the outlook for the US economy.
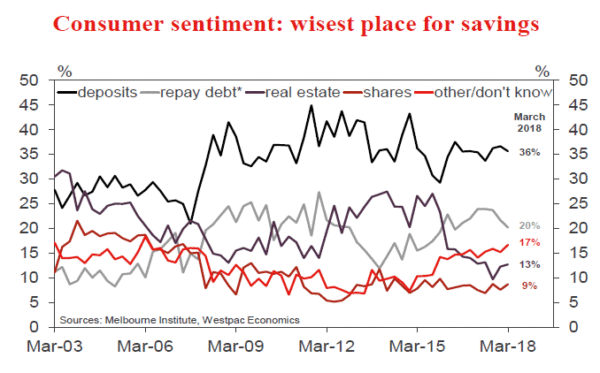
Chart of the week: Aus consumers ‘wisest place for savings’
The latest Westpac-MI Consumer Sentiment survey included a quarterly update of questions on the ‘wisest place for savings’ that offer additional insights around attitudes towards risk, debt, and different asset classes. The March results continue to show high levels of risk aversion. Nearly two thirds of consumers still favour safe options – deposits, superannuation or paying down debt – with only 11% nominating real estate and 8% nominating shares. Indeed, more consumers favour ‘pay down debt’ (22%) than those favouring real estate and shares combined.
The mix suggests consumers will continue to take a conservative approach to their finances, restraining spending, focussing on savings and shying away from risk with their balance sheet decisions. There are also some hints of frustration in recent responses with a notably high proportion of consumers (17%) nominating ‘other assets’, ‘spend it’ or not offering a response. That likely comes from the low returns available on ‘safe’ assets and unpalatably high perceived risks surrounding ‘risk’ assets.
 New Zealand: week ahead & data wrap
Few surprises
Slower GDP growth was confirmed by this week’s data as the economy shifted down a gear. We expect this more subdued growth backdrop will persist in 2018 as the new Government’s policies weigh on growth in the near term. And with few surprises on the data front in recent weeks, outgoing Reserve Bank Governor Grant Spencer is unlikely to make many waves with his final OCR decision on Thursday. We expect the OCR to remain unchanged at 1.75%. Once that’s out of the way, we will await the announcement of the new PTA, signed by the Minister of Finance and incoming Governor Adrian Orr.
Thursday’s GDP data confirmed that the pace of growth slowed over the last year. GDP increased 0.6% in the quarter, bringing the annual pace of growth to 2.9%. This was bang on our expectations, though softer than the market had anticipated. A 2.9% growth rate is a respectable outturn, but some way off the 3.5-4% pace we observed in 2015 and 2016. We expect the annual rate of growth will slow further this year as targeted policy changes cool the housing market, which in turn will impact on household spending, and as firms are more cautious around investment and hiring decisions.
Beneath the headline, the details for the quarter were also consistent with expectations. The agriculture sector was the biggest drag on growth – largely reflecting the hit to milk production on the back of the hot and dry weather the country experienced late last year. Weaker agricultural production flowed through to manufacturing activity via softer food processing.
In contrast, activity in the service sectors was a bit more lively. There were strong gains in retail, wholesaling, transport and business services. However, personal services such as healthcare and recreation were soft. Overall, services were up by 1.1%.
Firm growth in the domestic economy was also reflected in current account data released earlier in the week. The current account deficit widened from 2.5% to 2.7%, which was a little larger than expected. However, much of the surprise was due to a widening investment income deficit on the back of a surge in earnings of overseas-owned firms. This is an encouraging story to the extent that it reflects strong trading conditions in the local economy, and is consistent with the corporate tax take running well ahead of Treasury forecasts.
More generally at 2.7% of GDP, the current account deficit remains well within a ‘sustainable’ range. The run of modest deficits in recent years has helped New Zealand’s external imbalances to improve markedly. New Zealand’s net international liabilities position has narrowed from -84% of GDP in 2009 to -55% in the December quarter. This improvement has helped to shrink the risk premium that markets demand when lending to New Zealand.
This week’s GDP and current account data were the final data releases ahead of next week’s RBNZ OCR review. With the GDP data printing only a touch below the RBNZ’s expectations, there was certainly nothing to prompt a change of tone from the RBNZ. Indeed, even looking more broadly at the new information available since the February Monetary Policy Statement there has been little to change the RBNZ’s outlook. Q4 labour market data was released after the forecasts were finalised, but before publication, and were covered off in the press conference. The RBNZ probably had the results of its own inflation expectations survey (which showed that expectations were unaffected by the surprisingly weak Q4 CPI print) prior to publication.
Releases more recently have been monthly data that, while timely, can be a bit more volatile. Card spending was strong in January but soft in February, business confidence has improved a little but remains well below its post-election levels, and net migration was surprisingly strong in January, though we continue to expect annual migration numbers to moderate from here.
Even the NZ dollar, so often a source of surprise for the RBNZ, has tracked in line with expectations. The TWI is currently sitting at 75, bang on the RBNZ’s assumption. And despite widespread concern about the potential for a trade war to erupt on the back of President Trump’s tariff threats, for now these concerns simply remain threatening clouds on the horizon while global growth remains firm.
Consequently, we expect Thursday’s OCR review to contain few surprises. The OCR is expected to remain on hold at 1.75%, with the bottom line likely to remain unchanged: “Monetary policy will remain accommodative for a considerable period”. Similarly, our own take on the outlook has changed little in recent weeks. We still expect that the OCR will need to remain on hold for longer than the market currently anticipates – we don’t have a rate hike pencilled in until late 2019.
Next week’s OCR review will be Governor Spencer’s last after his short stint in the top job. Incoming Governor Adrian Orr will take office on 27 March, and before then a new Policy Targets Agreement (PTA) will need to be signed (likely at some point in the two working days after the OCR review so as not to complicate matters).
Yet the PTA that is signed this month may not be the final word on the matter. The Government’s two-phase review of the Reserve Bank Act is ongoing. While advice on phase one of the review was due to be provided to the Government ahead of the signing of the new PTA, the timeline for phase two of the review, which is much more wide ranging, has an even longer timeframe.
So although we could see the new PTA nudge the Governor toward giving greater consideration to maximising employment, for example, it’s unlikely to fully incorporate proposed changes to the decision making structure at the RBNZ, and it’s unlikely to be the final word on the matter. Indeed, a new PTA will probably need to be agreed between the Governor and the Minister of Finance when changes to the Reserve Bank Act are eventually finalised.
Data Previews
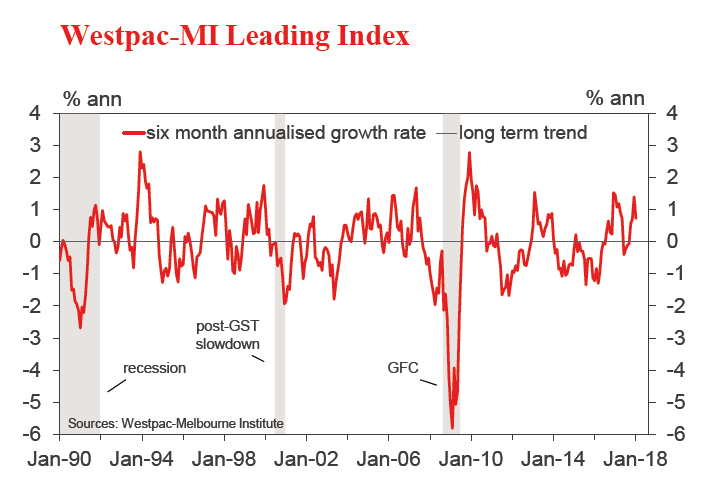
Aus Feb Westpac-MI Leading Index
Mar 21, Last: +0.73%
- The six month annualised growth rate in the Leading Index fell from +1.39% in Dec to +0.73% in Jan, fully reversing a 0.7ppt jump in the previous month. The swings mainly reflect extreme volatility in monthly dwelling approvals. Overall, the Index is still pointing to above trend growth momentum in the early part of 2018.
- The Feb read will include another volatile read on dwelling approvals which surged 17% in Jan. Commodity prices also firmed, up 3.8% (in AUD terms) vs 5.2% last month, and the yield spread widened a further 13bps. Other components look to have been softer, the ASX200 down -0.4%; the Westpac-MI Consumer Expectations Index down -0.1%; US industrial production down -0.1%; and the Westpac-MI Unemployment Expectations Index a touch weaker.
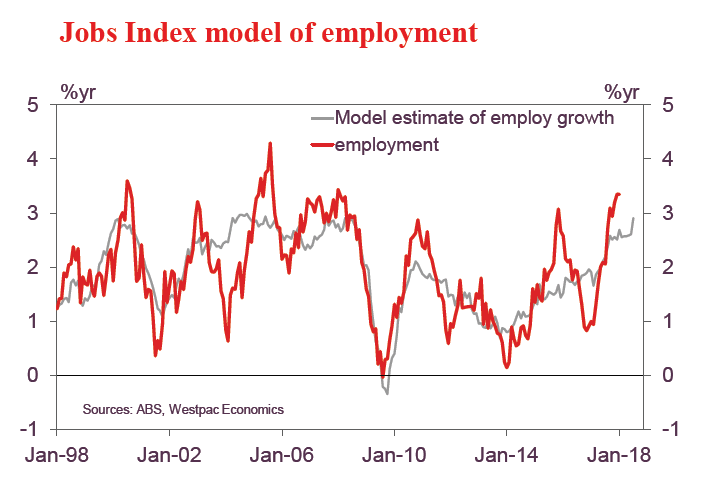
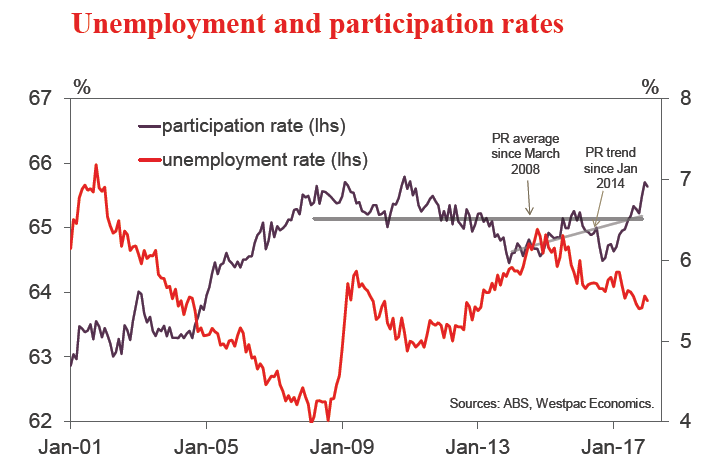
 Aus Labour Force Survey – total employment ‘000
Mar 22, Last: 16k, WBC f/c: 25k
Mkt f/c: 20k, Range: 8k to 30k
- Australia posted a 16k increase in employment in January 2018 which records the longest streak of job gains with a 16th consecutive positive print. The month’s increase was very close to the market and Westpac’s expectation for a 15k rise.
- However, the composition of employment changes was quite stark with full-time employment down 49.8k and parttime employment up 65.9k. That comes after a strong 2017 for full-time employment growth and the annual growth rate is still an elevated 3.6%.
- The leading indicators, both from business and household surveys, have strengthened so far in 2018. Westpac’s Jobs Index is suggesting that while employment growth maybe stronger than you would expect, there is no reason to be looking for a fundamental correction anytime soon.
 Aus Labour Force Survey – unemployment %
Mar 22, Last: 5.5%, WBC f/c: 5.5%
Mkt f/c: 5.5%, Range: 5.3% to 5.6%
- In January, the unemployment rate fell to 5.5% from 5.6% in December (revised up from 5.5%) with participation declining to 65.6% from 65.7%. Over the past year, while the unemployment rate did fall from a peak of 5.9% in February 2017 to the current 5.5%, the drop was more muted than the gain in employment due to rising participation.
- The uplift in participation has been driven mainly by females joining, re-joining, or remaining for longer in the labour force. However, this spike occurred alongside a rising male participation rate which had otherwise been in a downtrend.
- Given there appears to be a strong cyclical lift in participation, corresponding to the rise in employment, we are forecasting participation to rise modestly to 65.7% and this will be enough to see the unemployment rate hold flat at 5.5%.
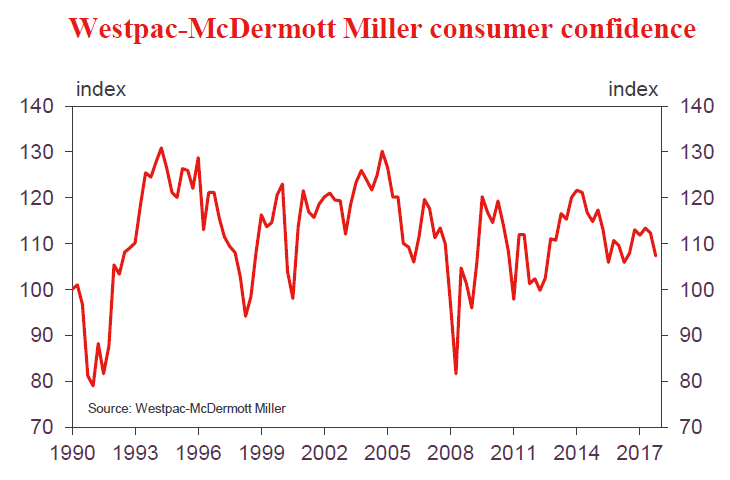
 NZ Westpac McDermott Miller Consumer confidence
Mar 20, Last: 107.4
- Consumer confidence dropped to below average levels late in 2017. However, underneath the aggregate figures was a noticeable skew across households: Confidence among those households earning less than $70,000 per annum actually rose modestly, while confidence among those households earning more than $70,000 per annum fell sharply. In both cases, it’s likely that sentient was affected by the change of government at the end of last year.
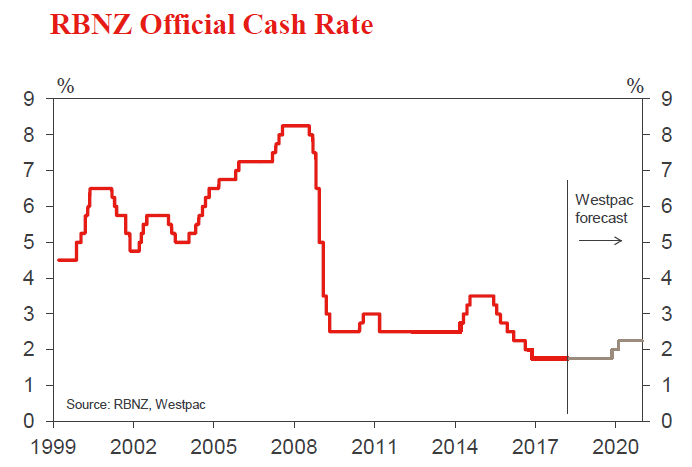
 NZ RBNZ OCR review
Mar 22, Last: 1.75%, Westpac f/c: 1.75%, Mkt f/c: 1.75%
- We expect the OCR to remain on hold at 1.75% until late 2019.
- Recent developments will have given the Reserve Bank little cause to change its stance. Low inflation and a period of more subdued growth mean that interest rates will need to remain low for a considerable time.
- This is the last OCR review for Acting Governor Spencer. The incoming Governor is due to sign a new Policy Targets Agreement shortly. Employment will be a consideration in future OCR decisions, but the details have yet to be resolved.
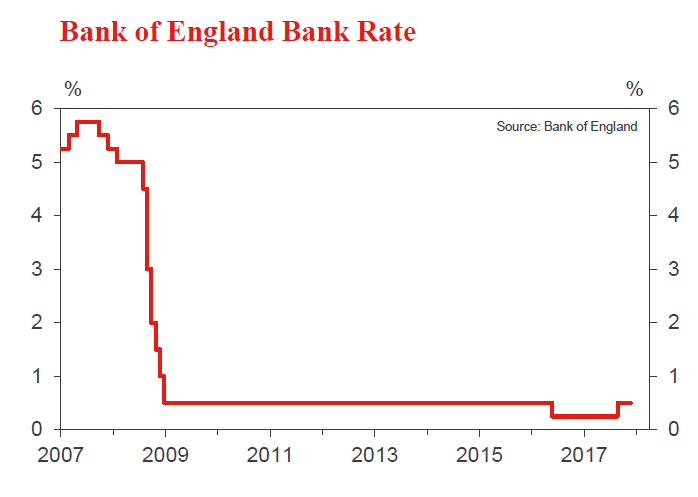
 UK Bank of England Bank Rate decision
Mar 22, Last: 0.5%, Mkt: 0.5%, WBC f/c: 0.5%
- While the Bank of England left the Bank Rate on hold in February, there was a hawkish tilt in the accompanying statement. The MPC noted that policy “would need to be tightened somewhat earlier and by a somewhat greater extent over the forecast period than anticipated at the time of the November Report”.
- We expect that the Bank Rate will again be left hold at the March meeting and that the BOE’s earlier tightening bias will remain. Since February, we haven’t seen major surprises in terms of economic conditions. Inflation is sitting at the top of the BOE’s target band and while growth remains sluggish, there are positive signs in parts of the economy. Developments on the external front (including Brexit negotiations) continue to signal some headwinds.
- We have pencilled in a hike from the BOE in June. Markets have priced in a 50% chance of a hike in May.
 US Mar FOMC meeting
Mar 22, last 1.375%, WBC 1.625%
- The March FOMC fed funds rate decision is as certain a prospect as markets get. From recent communications, it is evident that the Committee is in agrement of the appropriateness of a further rate increase, and the market knows this to be the case. That will see the fed funds rate rise to 1.625%. As planned, quantitative tightening will also remain on auto pilot.
- Market participants will therefore immediately focus their attention on the new set of Committee forecasts and followup comments from Chair Powell in the press conference.
- Expected is a confident FOMC Chair, both with respect to the economy’s strength and the FOMC’s approach to policy. While growth forecasts and the distribution of rate projections are likely to drift up, the median fed funds forecast should remain unchanged at three in 2018 and three more in 2019. Gradual and timely are the operative words for policy.