
Sample Category Title
EUR/CHF Weekly Outlook
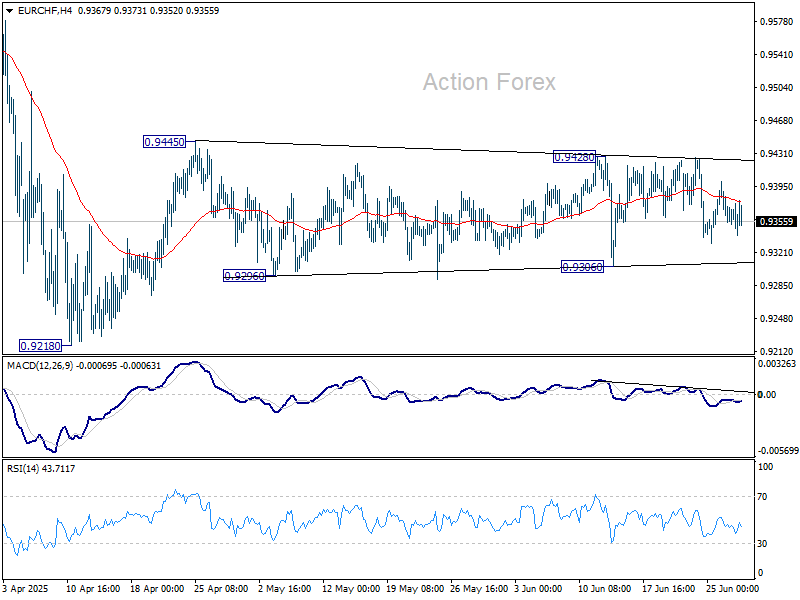
Sideway trading continued in EUR/CHF last week and outlook is unchanged. Initial bias stays neutral this week first, and further rally is mildly in favor as long as 0.9306 support holds. On the upside, break of 0.9428/45 resistance zone will resume the rebound from 0.9218. On the downside, break of 0.9306 will bring retest of 0.9218 low instead.
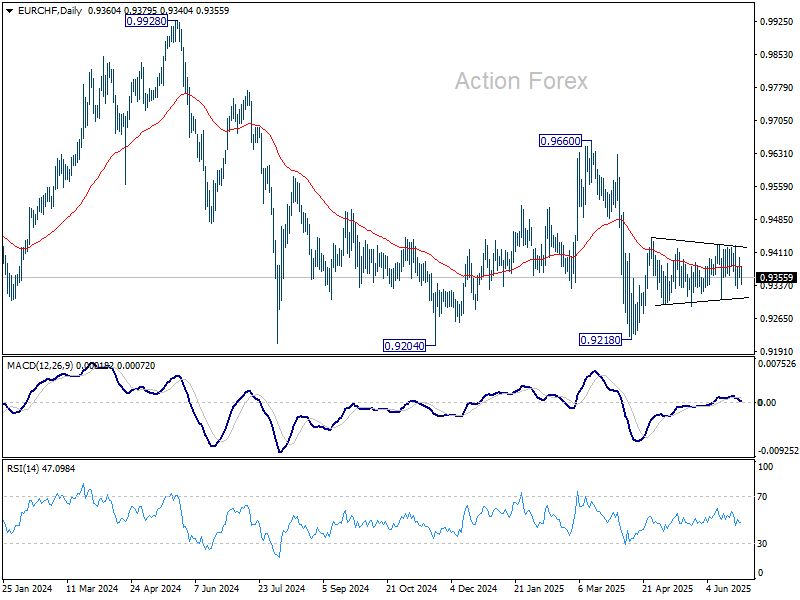
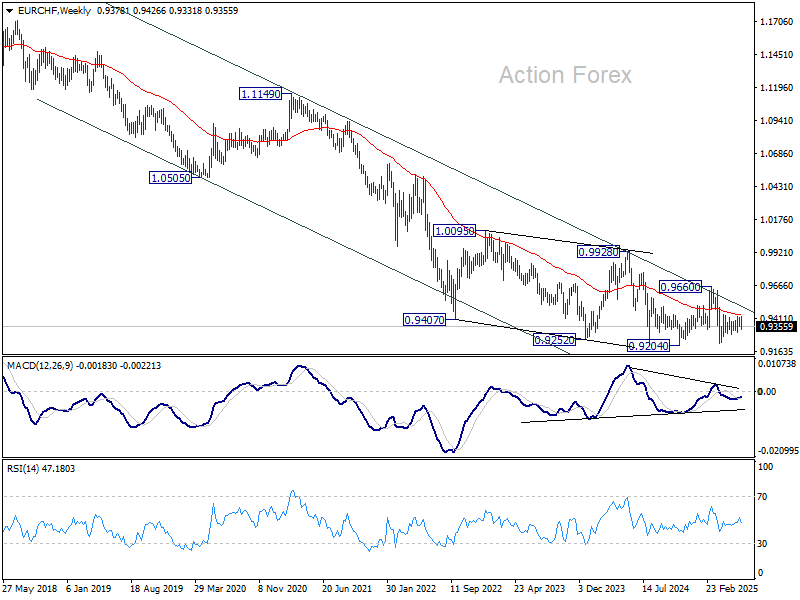
In the bigger picture, while downside momentum has been diminishing as seen in W MACD, there is no sign of bottoming yet. EUR/CHF is still staying below 55 W EMA and well inside long term falling channel. Outlook will stay bearish as long as 0.9660 resistance holds. Break of 0.9204 (2024 low) will confirm resumption of down trend from 1.2004 (2018 high).
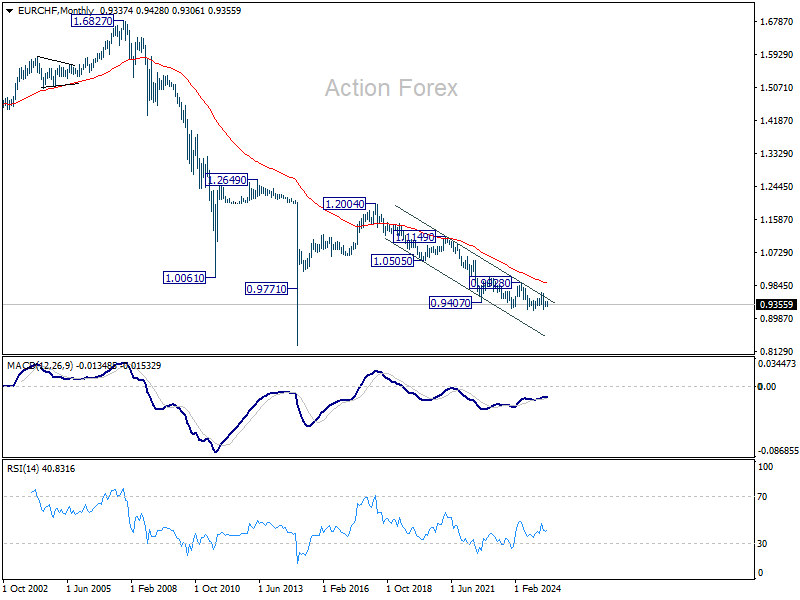
In the long term picture, overall long term down trend is still in progress in EUR/CHF. Outlook will continue to stay bearish as long as 55 M EMA (now at 0.9901) holds.
Summary 6/30 – 7/4
Monday, Jun 30, 2025
| GMT | Ccy | Events | Consensus | Previous |
|---|---|---|---|---|
| 23:50 | JPY | Industrial Production M/M May P | 3.40% | -1.10% |
| 01:00 | AUD | TD-MI Inflation Gauge M/M Jun | -0.40% | |
| 01:00 | NZD | ANZ Business Confidence Jun | 36.6 | |
| 01:30 | AUD | Private Sector Credit M/M May | 0.70% | 0.70% |
| 01:30 | CNY | NBS Manufacturing PMI Jun | 49.7 | 49.5 |
| 01:30 | CNY | NBS Non-Manufacturing PMI Jun | 50.3 | 50.3 |
| 05:00 | JPY | Housing Starts Y/Y May | -14.80% | -26.60% |
| 06:00 | EUR | Germany Import Price Index M/M May | -0.30% | -1.70% |
| 06:00 | EUR | Germany Retail Sales M/M May | 0.50% | -1.10% |
| 06:00 | GBP | GDP Q/Q Q1 | 0.70% | 0.70% |
| 06:00 | GBP | Current Account (GBP) Q1 | -19.7B | -21.0B |
| 07:00 | CHF | KOF Economic Barometer Jun | 99.3 | 98.5 |
| 08:00 | EUR | Eurozone M3 Money Supply Y/Y May | 4.00% | 3.90% |
| 08:30 | GBP | M4 Money Supply M/M May | 0.20% | 0% |
| 08:30 | GBP | Mortgage Approvals May | 61K | 60K |
| 12:00 | EUR | Germany CPI M/M Jun P | 0.20% | 0.10% |
| 12:00 | EUR | Germany CPI Y/Y Jun P | 2.10% | |
| 13:45 | USD | Chicago PMI Jun | 42.7 | 40.5 |
| 22:00 | NZD | NZIER Business Confidence Q2 | 19 | |
| 22:45 | NZD | Building Permits M/M May | -15.60% | |
| 23:01 | GBP | BRC Shop Price Index Y/Y Jun | -0.10% | |
| 23:50 | JPY | Tankan Large Manufacturing Index Q2 | 10 | 12 |
| 23:50 | JPY | Tankan Large Manufacturing Outlook Q2 | 9 | 12 |
| 23:50 | JPY | Tankan Non - Manufacturing Index Q2 | 34 | 35 |
| 23:50 | JPY | Tankan Non - Manufacturing Outlook Q2 | 29 | 28 |
| 23:50 | JPY | Tankan Large All Industry capex Q2 | 3.10% |
| GMT | Ccy | Events | |
|---|---|---|---|
| 23:50 | JPY | Industrial Production M/M May P | |
| Forecast: 3.40% | Previous: -1.10% | ||
| 01:00 | AUD | TD-MI Inflation Gauge M/M Jun | |
| Forecast: | Previous: -0.40% | ||
| 01:00 | NZD | ANZ Business Confidence Jun | |
| Forecast: | Previous: 36.6 | ||
| 01:30 | AUD | Private Sector Credit M/M May | |
| Forecast: 0.70% | Previous: 0.70% | ||
| 01:30 | CNY | NBS Manufacturing PMI Jun | |
| Forecast: 49.7 | Previous: 49.5 | ||
| 01:30 | CNY | NBS Non-Manufacturing PMI Jun | |
| Forecast: 50.3 | Previous: 50.3 | ||
| 05:00 | JPY | Housing Starts Y/Y May | |
| Forecast: -14.80% | Previous: -26.60% | ||
| 06:00 | EUR | Germany Import Price Index M/M May | |
| Forecast: -0.30% | Previous: -1.70% | ||
| 06:00 | EUR | Germany Retail Sales M/M May | |
| Forecast: 0.50% | Previous: -1.10% | ||
| 06:00 | GBP | GDP Q/Q Q1 | |
| Forecast: 0.70% | Previous: 0.70% | ||
| 06:00 | GBP | Current Account (GBP) Q1 | |
| Forecast: -19.7B | Previous: -21.0B | ||
| 07:00 | CHF | KOF Economic Barometer Jun | |
| Forecast: 99.3 | Previous: 98.5 | ||
| 08:00 | EUR | Eurozone M3 Money Supply Y/Y May | |
| Forecast: 4.00% | Previous: 3.90% | ||
| 08:30 | GBP | M4 Money Supply M/M May | |
| Forecast: 0.20% | Previous: 0% | ||
| 08:30 | GBP | Mortgage Approvals May | |
| Forecast: 61K | Previous: 60K | ||
| 12:00 | EUR | Germany CPI M/M Jun P | |
| Forecast: 0.20% | Previous: 0.10% | ||
| 12:00 | EUR | Germany CPI Y/Y Jun P | |
| Forecast: | Previous: 2.10% | ||
| 13:45 | USD | Chicago PMI Jun | |
| Forecast: 42.7 | Previous: 40.5 | ||
| 22:00 | NZD | NZIER Business Confidence Q2 | |
| Forecast: | Previous: 19 | ||
| 22:45 | NZD | Building Permits M/M May | |
| Forecast: | Previous: -15.60% | ||
| 23:01 | GBP | BRC Shop Price Index Y/Y Jun | |
| Forecast: | Previous: -0.10% | ||
| 23:50 | JPY | Tankan Large Manufacturing Index Q2 | |
| Forecast: 10 | Previous: 12 | ||
| 23:50 | JPY | Tankan Large Manufacturing Outlook Q2 | |
| Forecast: 9 | Previous: 12 | ||
| 23:50 | JPY | Tankan Non - Manufacturing Index Q2 | |
| Forecast: 34 | Previous: 35 | ||
| 23:50 | JPY | Tankan Non - Manufacturing Outlook Q2 | |
| Forecast: 29 | Previous: 28 | ||
| 23:50 | JPY | Tankan Large All Industry capex Q2 | |
| Forecast: | Previous: 3.10% | ||
Tuesday, Jul 1, 2025
| GMT | Ccy | Events | Consensus | Previous |
|---|---|---|---|---|
| 00:30 | JPY | Manufacturing PMI Jun F | 50.4 | 50.4 |
| 01:45 | CNY | Caixin Manufacturing PMI Jun | 49 | 48.3 |
| 05:00 | JPY | Consumer Confidence Index Jun | 33.6 | 32.8 |
| 06:30 | CHF | Real Retail Sales Y/Y May | 0.80% | 1.30% |
| 07:30 | CHF | Manufacturing PMI Jun | 44.2 | 42.1 |
| 07:50 | EUR | France Manufacturing PMI Jun F | 47.8 | 47.8 |
| 07:55 | EUR | Germany Manufacturing PMI Jun F | 49 | 49 |
| 07:55 | EUR | Germany Unemployment Change May | 18K | 34K |
| 07:55 | EUR | Germany Unemployment Rate May | 6.30% | |
| 08:00 | EUR | Eurozone Manufacturing PMI Jun F | 49.4 | 49.4 |
| 08:30 | GBP | Manufacturing PMI Jun F | 47.7 | 47.7 |
| 09:00 | EUR | Eurozone CPI Y/Y Jun P | 2.00% | 1.90% |
| 09:00 | EUR | Eurozone CPI Core Y/Y Jun P | 2.30% | 2.30% |
| 13:45 | USD | Manufacturing PMI Jun F | 52 | 52 |
| 14:00 | USD | ISM Manufacturing PMI Jun | 48.8 | 48.5 |
| 14:00 | USD | ISM Manufacturing Prices Paid Jun | 70.2 | 69.4 |
| 14:00 | USD | ISM Manufacturing Employment Index Jun | 46.8 | |
| 14:00 | USD | Construction Spending M/M May | -0.10% | -0.40% |
| 23:50 | JPY | Monetary Base Y/Y Jun | -3.50% | -3.40% |
| GMT | Ccy | Events | |
|---|---|---|---|
| 00:30 | JPY | Manufacturing PMI Jun F | |
| Forecast: 50.4 | Previous: 50.4 | ||
| 01:45 | CNY | Caixin Manufacturing PMI Jun | |
| Forecast: 49 | Previous: 48.3 | ||
| 05:00 | JPY | Consumer Confidence Index Jun | |
| Forecast: 33.6 | Previous: 32.8 | ||
| 06:30 | CHF | Real Retail Sales Y/Y May | |
| Forecast: 0.80% | Previous: 1.30% | ||
| 07:30 | CHF | Manufacturing PMI Jun | |
| Forecast: 44.2 | Previous: 42.1 | ||
| 07:50 | EUR | France Manufacturing PMI Jun F | |
| Forecast: 47.8 | Previous: 47.8 | ||
| 07:55 | EUR | Germany Manufacturing PMI Jun F | |
| Forecast: 49 | Previous: 49 | ||
| 07:55 | EUR | Germany Unemployment Change May | |
| Forecast: 18K | Previous: 34K | ||
| 07:55 | EUR | Germany Unemployment Rate May | |
| Forecast: | Previous: 6.30% | ||
| 08:00 | EUR | Eurozone Manufacturing PMI Jun F | |
| Forecast: 49.4 | Previous: 49.4 | ||
| 08:30 | GBP | Manufacturing PMI Jun F | |
| Forecast: 47.7 | Previous: 47.7 | ||
| 09:00 | EUR | Eurozone CPI Y/Y Jun P | |
| Forecast: 2.00% | Previous: 1.90% | ||
| 09:00 | EUR | Eurozone CPI Core Y/Y Jun P | |
| Forecast: 2.30% | Previous: 2.30% | ||
| 13:45 | USD | Manufacturing PMI Jun F | |
| Forecast: 52 | Previous: 52 | ||
| 14:00 | USD | ISM Manufacturing PMI Jun | |
| Forecast: 48.8 | Previous: 48.5 | ||
| 14:00 | USD | ISM Manufacturing Prices Paid Jun | |
| Forecast: 70.2 | Previous: 69.4 | ||
| 14:00 | USD | ISM Manufacturing Employment Index Jun | |
| Forecast: | Previous: 46.8 | ||
| 14:00 | USD | Construction Spending M/M May | |
| Forecast: -0.10% | Previous: -0.40% | ||
| 23:50 | JPY | Monetary Base Y/Y Jun | |
| Forecast: -3.50% | Previous: -3.40% | ||
Wednesday, Jul 2, 2025
| GMT | Ccy | Events | Consensus | Previous |
|---|---|---|---|---|
| 01:30 | AUD | Retail Sales M/M May | 0.30% | -0.10% |
| 01:30 | AUD | Building Permits M/M May | 5.00% | -5.70% |
| 09:00 | EUR | Eurozone Unemployment Rate May | 6.20% | 6.20% |
| 11:30 | USD | Challenger Job Cuts Y/Y Jun | 47.00% | |
| 12:15 | USD | ADP Employment Change Jun | 105K | 37K |
| 13:30 | CAD | Manufacturing PMI Jun | 46.1 | |
| 14:30 | USD | Crude Oil Inventories | -5.8M |
| GMT | Ccy | Events | |
|---|---|---|---|
| 01:30 | AUD | Retail Sales M/M May | |
| Forecast: 0.30% | Previous: -0.10% | ||
| 01:30 | AUD | Building Permits M/M May | |
| Forecast: 5.00% | Previous: -5.70% | ||
| 09:00 | EUR | Eurozone Unemployment Rate May | |
| Forecast: 6.20% | Previous: 6.20% | ||
| 11:30 | USD | Challenger Job Cuts Y/Y Jun | |
| Forecast: | Previous: 47.00% | ||
| 12:15 | USD | ADP Employment Change Jun | |
| Forecast: 105K | Previous: 37K | ||
| 13:30 | CAD | Manufacturing PMI Jun | |
| Forecast: | Previous: 46.1 | ||
| 14:30 | USD | Crude Oil Inventories | |
| Forecast: | Previous: -5.8M | ||
Thursday, Jul 3, 2025
| GMT | Ccy | Events | Consensus | Previous |
|---|---|---|---|---|
| 00:30 | JPY | Services PMI Jun F | 51.5 | 51.5 |
| 01:30 | AUD | Trade Balance (AUD) May | 5.08B | 5.41B |
| 01:45 | CNY | Caixin Services PMI Jun | 51 | 51.1 |
| 06:30 | CHF | CPI M/M Jun | 0.10% | 0.10% |
| 06:30 | CHF | CPI Y/Y Jun | -0.10% | |
| 07:50 | EUR | France Services PMI Jun F | 48.7 | 48.7 |
| 07:55 | EUR | Germany Services PMI Jun F | 49.4 | 49.4 |
| 08:00 | EUR | Eurozone Services PMI Jun F | 50 | 50 |
| 08:30 | GBP | Services PMI Jun F | 51.3 | 51.3 |
| 11:30 | EUR | ECB Meeting Accounts | ||
| 12:30 | CAD | Trade Balance (CAD) May | -6.0B | -7.1B |
| 12:30 | USD | Initial Jobless Claims (Jun 27) | 239K | 236K |
| 12:30 | USD | Nonfarm Payrolls Jun | 129K | 139K |
| 12:30 | USD | Unemployment Rate Jun | 4.30% | 4.20% |
| 12:30 | USD | Average Hourly Earnings M/M Jun | 0.30% | 0.40% |
| 12:30 | USD | Trade Balance (USD) May | -69.9B | -61.6B |
| 12:30 | USD | Initial Jobless Claims 4-week average (Jun 27) | 245K | |
| 12:30 | USD | Goods Trade Balance May | $-96.6B | |
| 13:45 | USD | Services PMI Jun F | 53.1 | 53.1 |
| 14:00 | USD | ISM Services PMI Jun | 50.3 | 49.9 |
| 14:00 | USD | Factory Orders M/M May | 7.90% | -3.70% |
| 14:30 | USD | Natural Gas Storage | 96B | |
| 23:30 | JPY | Household Spending Y/Y May | 1.20% | -0.10% |
| GMT | Ccy | Events | |
|---|---|---|---|
| 00:30 | JPY | Services PMI Jun F | |
| Forecast: 51.5 | Previous: 51.5 | ||
| 01:30 | AUD | Trade Balance (AUD) May | |
| Forecast: 5.08B | Previous: 5.41B | ||
| 01:45 | CNY | Caixin Services PMI Jun | |
| Forecast: 51 | Previous: 51.1 | ||
| 06:30 | CHF | CPI M/M Jun | |
| Forecast: 0.10% | Previous: 0.10% | ||
| 06:30 | CHF | CPI Y/Y Jun | |
| Forecast: | Previous: -0.10% | ||
| 07:50 | EUR | France Services PMI Jun F | |
| Forecast: 48.7 | Previous: 48.7 | ||
| 07:55 | EUR | Germany Services PMI Jun F | |
| Forecast: 49.4 | Previous: 49.4 | ||
| 08:00 | EUR | Eurozone Services PMI Jun F | |
| Forecast: 50 | Previous: 50 | ||
| 08:30 | GBP | Services PMI Jun F | |
| Forecast: 51.3 | Previous: 51.3 | ||
| 11:30 | EUR | ECB Meeting Accounts | |
| Forecast: | Previous: | ||
| 12:30 | CAD | Trade Balance (CAD) May | |
| Forecast: -6.0B | Previous: -7.1B | ||
| 12:30 | USD | Initial Jobless Claims (Jun 27) | |
| Forecast: 239K | Previous: 236K | ||
| 12:30 | USD | Nonfarm Payrolls Jun | |
| Forecast: 129K | Previous: 139K | ||
| 12:30 | USD | Unemployment Rate Jun | |
| Forecast: 4.30% | Previous: 4.20% | ||
| 12:30 | USD | Average Hourly Earnings M/M Jun | |
| Forecast: 0.30% | Previous: 0.40% | ||
| 12:30 | USD | Trade Balance (USD) May | |
| Forecast: -69.9B | Previous: -61.6B | ||
| 12:30 | USD | Initial Jobless Claims 4-week average (Jun 27) | |
| Forecast: | Previous: 245K | ||
| 12:30 | USD | Goods Trade Balance May | |
| Forecast: | Previous: $-96.6B | ||
| 13:45 | USD | Services PMI Jun F | |
| Forecast: 53.1 | Previous: 53.1 | ||
| 14:00 | USD | ISM Services PMI Jun | |
| Forecast: 50.3 | Previous: 49.9 | ||
| 14:00 | USD | Factory Orders M/M May | |
| Forecast: 7.90% | Previous: -3.70% | ||
| 14:30 | USD | Natural Gas Storage | |
| Forecast: | Previous: 96B | ||
| 23:30 | JPY | Household Spending Y/Y May | |
| Forecast: 1.20% | Previous: -0.10% | ||
Friday, Jul 4, 2025
| GMT | Ccy | Events | Consensus | Previous |
|---|---|---|---|---|
| 05:45 | CHF | Unemployment Rate Jun | 2.90% | 2.90% |
| 06:00 | EUR | Germany Factory Orders M/M May | -0.20% | 0.60% |
| 06:45 | EUR | France Industrial Output M/M May | 0.40% | -1.40% |
| 08:30 | GBP | Construction PMI Jun | 48.6 | 47.9 |
| 09:00 | EUR | Eurozone PPI M/M May | -0.60% | -2.20% |
| 09:00 | EUR | Eurozone PPI Y/Y May | 0.70% |
| GMT | Ccy | Events | |
|---|---|---|---|
| 05:45 | CHF | Unemployment Rate Jun | |
| Forecast: 2.90% | Previous: 2.90% | ||
| 06:00 | EUR | Germany Factory Orders M/M May | |
| Forecast: -0.20% | Previous: 0.60% | ||
| 06:45 | EUR | France Industrial Output M/M May | |
| Forecast: 0.40% | Previous: -1.40% | ||
| 08:30 | GBP | Construction PMI Jun | |
| Forecast: 48.6 | Previous: 47.9 | ||
| 09:00 | EUR | Eurozone PPI M/M May | |
| Forecast: -0.60% | Previous: -2.20% | ||
| 09:00 | EUR | Eurozone PPI Y/Y May | |
| Forecast: | Previous: 0.70% | ||
Markets Weekly Outlook – June US NFP, Global PMIs and German Employment
Week in review: Israel-Iran Ceasefire and upbeat market sentiment (but?)
Markets had been enjoying from renewed positive sentiment after the US intervened in the Israel-Iran conflict which led to the reaching of a ceasefire agreement. The news sent Equities booming higher after a choppy past two weeks.
The Nasdaq reached new all-time highs on Wednesday and the S&P 500 joined its tech-focused brother just yesterday – Both indices had been pursuing their bullish impulses before this early afternoon's change in mood.
Donald Trump just announced that he is cancelling trade talks with Canada and the resumption of trade sanctions on Iran, sending stock markets back down to re-test their previous all-time highs.
Local highs for the Nasdaq (CFD) are at 22,632 and for the S&P 500 (CFD) 6,195.
For the rest, the week had been fairly calm despite the release of a fall in the US GDP and higher Core PCE this morning, putting stagflation talks back on the table.
Markets are also waiting for the release of the US Bank Stress Test results, releasing at 4:30 PM which may be a major market mover in the case of a bad surprise – A good moment to remind that March 2023 had seen major market turmoil as the Silicon Valley Bank failed, which led to the Federal Reserve imposing new regulations.
The Week ahead: June NFP, Global PMIs, German Employment and National Holidays
Next week could bring renewed surprises to financial markets, with traders closely eyeing Thursday’s highly anticipated Non-Farm Payrolls (NFP) report.
Typically released on the last Friday of each month, this month’s data will come a day early due to the U.S. Independence Day holiday on July 4th, when markets will be closed.
Canada will also be observing its national holiday on July 1st, adding to what could be a week of lighter liquidity and potentially sharper moves around key data.
Asia Pacific Markets
Next week is going to be fairly light in terms of economic data release for Asia-Pacific countries.
China will see the release of its monthly PMI releases on Sunday evening, with the most important datapoint being China's Manufacturing PMI, with the previous data releasing in the contraction territory (below 50)
For the rest, Japan will see the most action on Tuesday with Japanese Consumer Confidence with a consensus of 33.6 at 1:00 A.M. ET and later, BoJ Governor Ueda will later appear in the annual Central Bank conference in Sintra, Portugal – Speech expected at 9:30 A.M the same day.
Australia will see the release of its Balance of Trade on Wednesday 21:30 ET, which tends to move the AUD.
Economic Data from Europe, UK and North America – US NFP, PMIs and NA Holidays
The beginning of this week's release will focus on individual Inflation monthly data for Italy and Germany on Monday June 30, followed by the Flash CPI release for the Eurozone the following day at 5:00 A.M.
For Euro traders, also monitor the Unemployment Rate on Tuesday at 3:55 A.M. (Eastern Time).
In North America, markets await for the US Manufacturing PMI on Tuesday at 8:30 (exp at 48.8), and JOLTS at 10:00 A.M. which only moves markets on major surprises.
However, most traders will be on the sidelines to prepare for Thursday, largely the most consequential day of the upcoming week.
Non-Farm Payrolls data for June, expected at 129K releases at 8:30 on the July 3rd, followed by the more market-moving Services PMI at 10:00 (exp at 50.3)
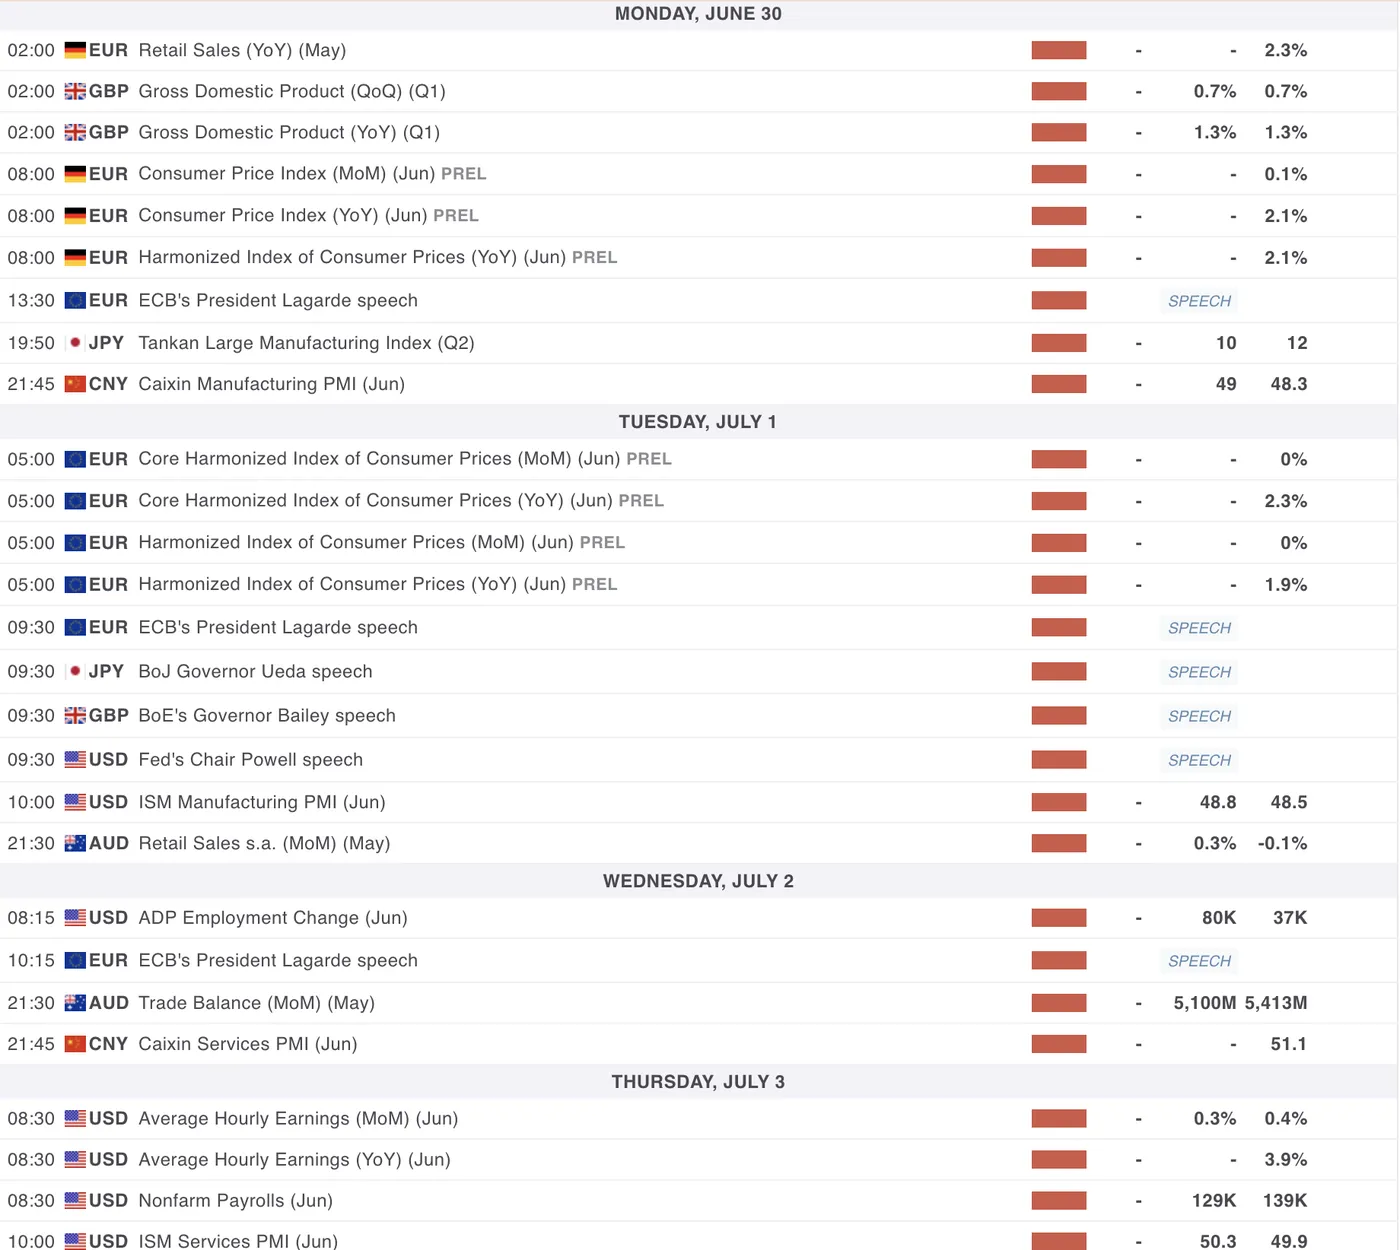
Key Events coming up next week (Hier-Tier Data only) – MarketPulse Economic Calendar
US Dollar performance versus other Forex Major counterparts
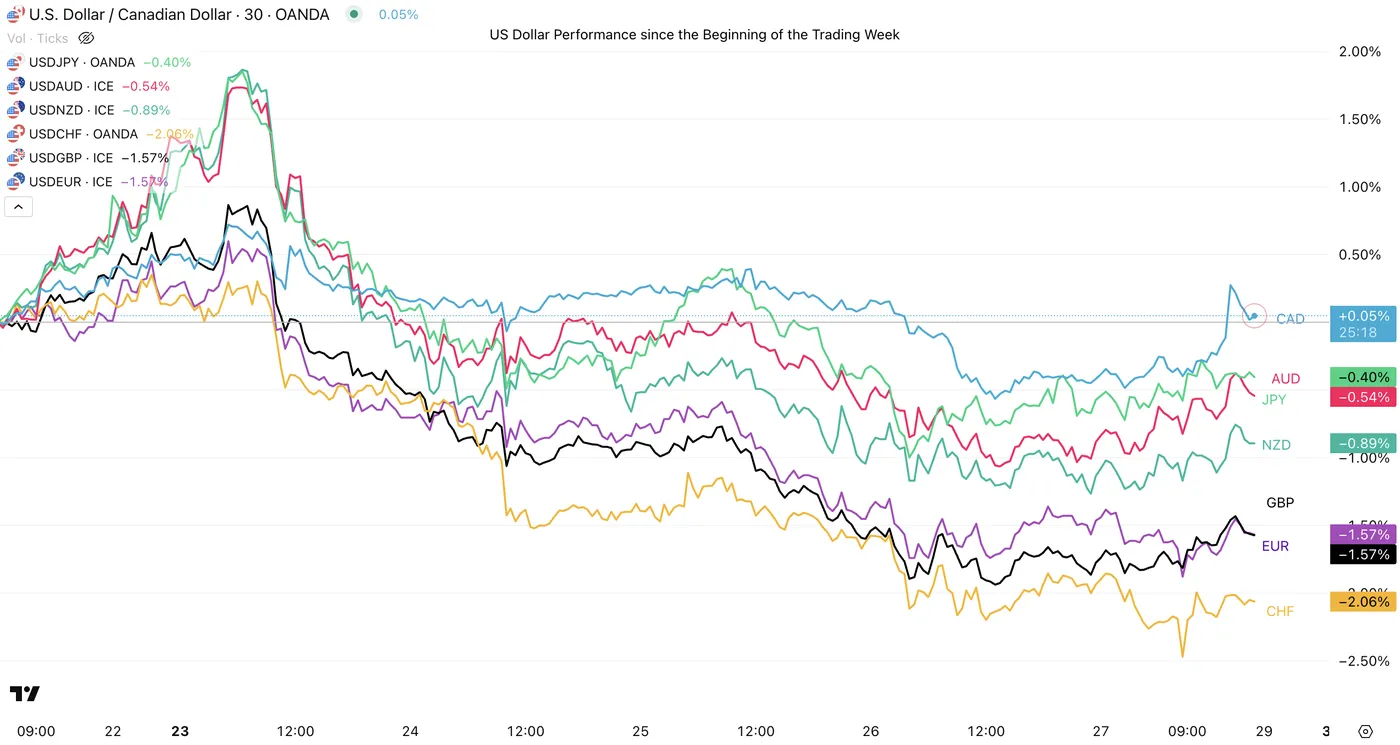
US Dollar Performance since the Beginning of the Trading Week, June 27, 2025 – Source: TradingView
The US Dollar had started the week on a higher note as markets gapped all around with the US Intervention in the news, before giving back all its strength as sentiment got much better after the Ceasefire agreement.
Since, the Dollar has been on a flash sale. The DXY is closing below its previous swing lows.
Weekly Asset Performance
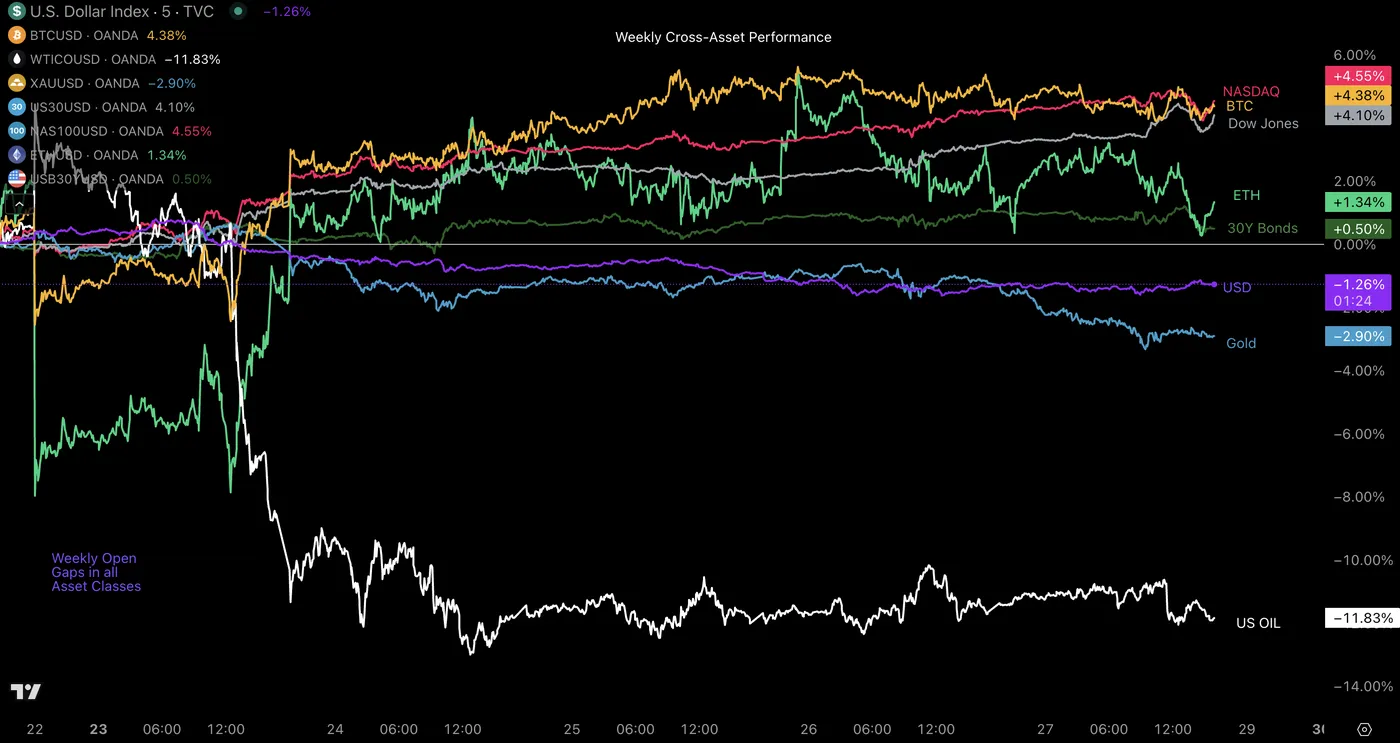
Cross-Asset Weekly Performance, June 27, 2025 – Source: TradingView
Oil is by far the worst performer, giving up most of its war premium, giving back above 11%. You can access our latest analysis on the energy commodity here.
The best performers on the week however are US Stocks, which finish the week off their highs as Donald Trump shook markets again – They are still on an impressive run.
The Weekly Bottom Line: Canada – Inflation, GDP Confirm Economic Slowdown
Canadian Highlights
- Headline inflation for the month of May landed in line with expectations of a soft print. Core measures, while still elevated, showed signs of cooling.
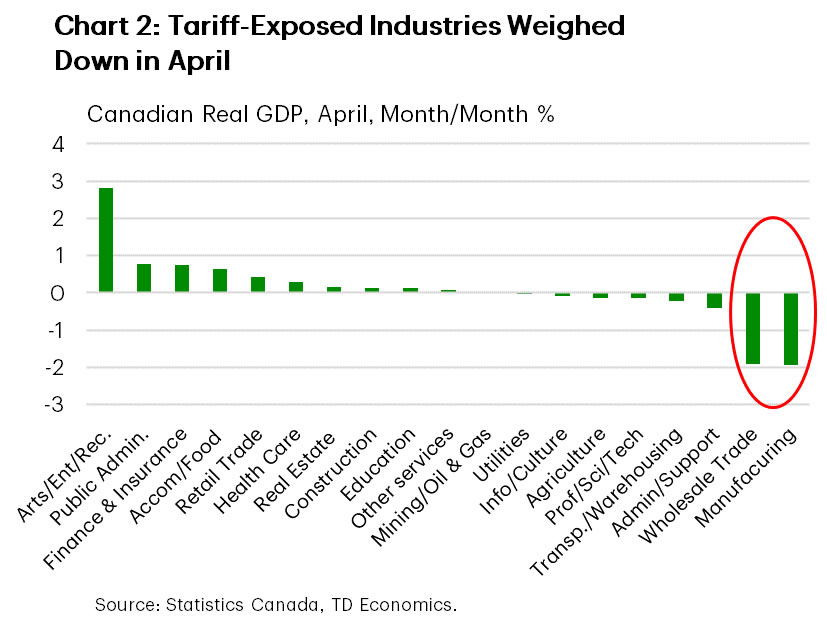
- Industry-based GDP contracted in April, with a similar fate expected in May. Tariff-exposed industries are bearing the brunt of the blow.
- Canada committed to the new NATO pledge to spend 5% of GDP on defence by 2035.
U.S. Highlights
- An abrupt ceasefire between Israel and Iran sent oil prices tumbling, while stock markets rejoiced on the news, with the S&P 500 up roughly 3% on the week at the time of writing.
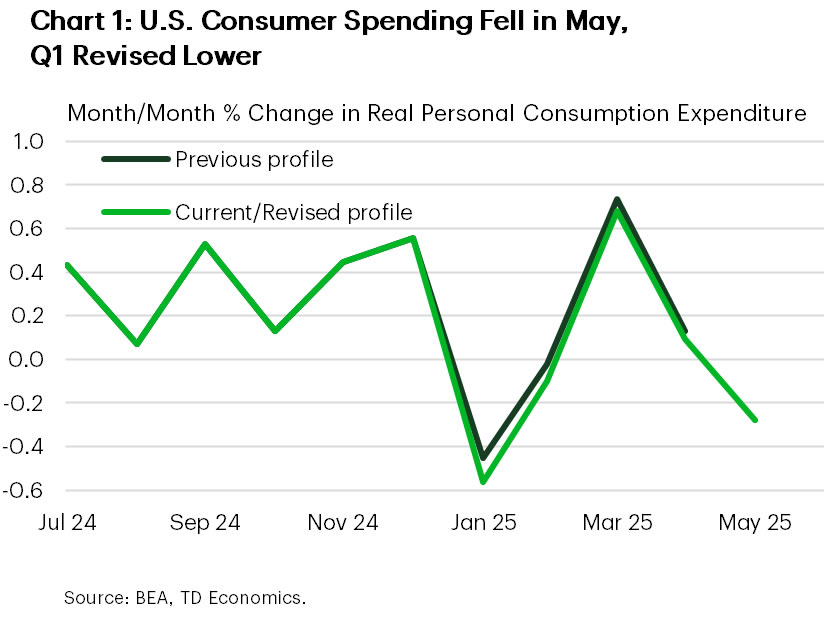
- The U.S. consumer is showing signs of fatigue with real spending falling 0.3% in May.
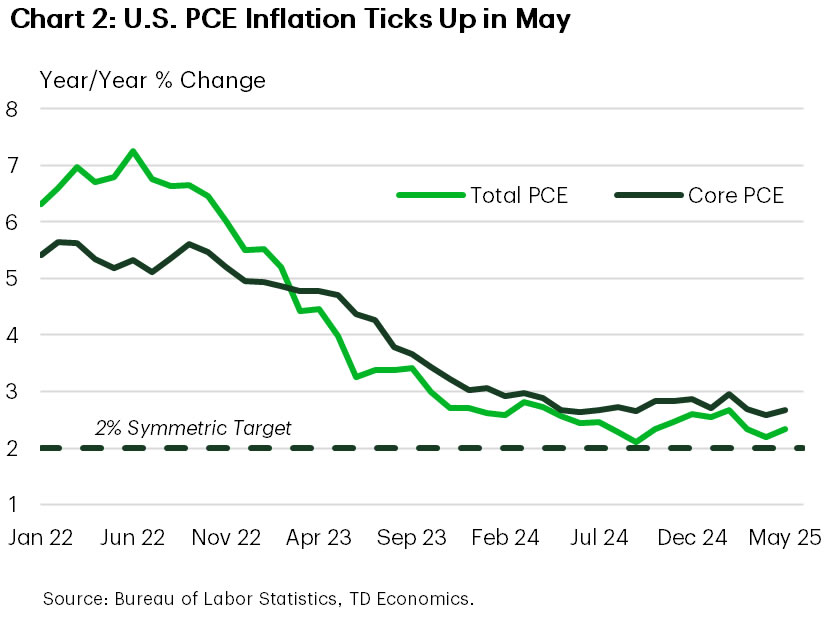
- The Fed’s preferred inflation gauge, core PCE, ticked up modestly from 2.6% to 2.7% (y/y) in May.
Canada – Inflation, GDP Confirm Economic Slowdown
This week we received the first of two inflation updates that the Bank of Canada (BoC) will use to guide their policy decision on July 30. May’s headline inflation came in at a 1.7% year-on-year (y/y), meeting consensus expectations. Recent soft readings have been tamped down by the end of the consumer carbon tax, something we expect to linger for the coming months. Total inflation has averaged right at the BoC’s 2% target for the better part of the last year, with areas like shelter inflation starting to see some reprieve.
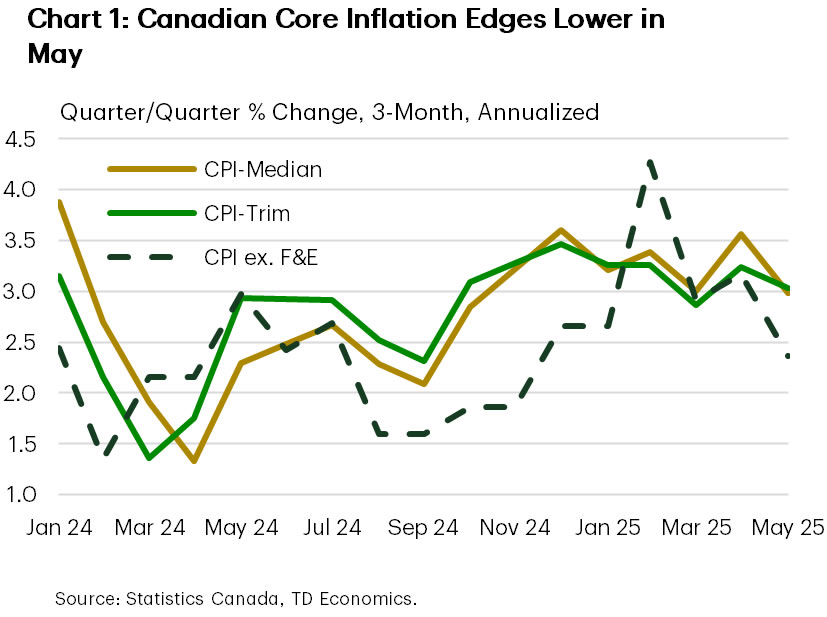
Core inflation on the other hand has run warmer, though underlying price pressures eased up a bit in May. Case in point, the BoC’s preferred core (CPI-trim and CPI-median) and the traditional core (ex-food and energy) measures all moved lower on a three-month annualized basis (Chart 1). One data point doesn’t make a trend, but it helps the narrative that inflation is showing some containment. Our view remains that a softening economic growth backdrop over the next two quarters should help keep a lid on inflationary pressures.
This view was reinforced after April’s GDP report showed the impact of tariffs on the economy becoming increasing clear. Canadian real GDP fell short of Statistics Canada’s advance guidance, falling by -0.1% month-on-month versus an expected uptick in activity. Tariff-exposed sectors disproportionately felt the pinch (Chart 2), with industries like manufacturing and wholesale trade registering their largest monthly declines in roughly four years and two years, respectively. Advanced estimates for May signal another contraction in economic growth. May’s trade data are due next week and will be under heavy scrutiny after exports cratered by almost 20% the month prior. A further contraction in shipments would all but confirm a weak second quarter of growth.
Now it’s about how the BoC views the balance of risks around growth and inflation. Markets expect the BoC to keep rates steady next month, though data over the past two weeks has the probability of a cut creeping closer to a coinflip. Based on the Bank’s recent messaging around inflation risk, they’ll likely need to see core prices ease further next month to entertain a rate cut at the next meeting. With Canada’s labour market showing cracks, consumers reigning in spending, and the housing market visibly strained, we think the BoC has headroom to cut the policy rate two more times this year.
Elsewhere, Canada’s defense spending is expected to ratchet higher as Prime Minister Carney signed the country on to NATO’s 5% of GDP spending commitment by 2035. The target is split into a 3.5% goal on “hard” defense outlays and 1.5% on defense-related infrastructure. On the latter, PM Carney noted that planned infrastructure and emergency preparedness spending will count towards the 1.5% goal. Nonetheless, a gap of $40-50 billion on annual spending exists – even after the additional ~$9 billion announced to reach the prior 2% target by end of the fiscal year.
U.S. – Some Calm After the Storm
Geopolitical developments continued to grab headlines this week. However, the world breathed a sigh of relief when Pres. Trump announced a ceasefire between Israel and Iran on Monday. Oil prices fell sharply on the news, while equity markets rallied. This was followed by what appeared to be a successful NATO summit, where most members agreed to increase defense spending targets to 5% of GDP by 2035. Some good news also trickled in on the trade front, with China pledging to approve applications for rare-earth exports to the U.S. – a development that could pave the way for more fruitful trade negotiations. These developments appeared to overshadow more muted developments on the home front.
The passage of the ‘One, Big, Beautiful Bill Act’ hit a snag in the Senate, ahead of Thursday’s vote. The Senate parliamentarian reportedly ruled out several major measures in the legislation, most notably provisions related to Medicaid cuts – complicating the GOP’s math on spending cuts. It remains unclear if the bill will pass by the Republican’s self-imposed deadline of July 4th.
On the data front, the highlight of the week was the May release of personal income and spending. Personal income fell by 0.4% month-on-month (m/m), owing to a sharp pullback in transfer payments. Importantly, compensation to employees – nearly two-third of income – rose by a healthy 0.4% m/m. However, there were definite signs of waning consumer resilience. Goods spending fell 0.8% m/m, while services were flat on the month, with total spending down 0.3% on the month (Chart 1). Part of the softening in services spending was telegraphed earlier in the week in the third release of Q1 GDP, where it was revised to just a 0.6% gain (previously 1.7%), implying less momentum heading into Q2.
So far, the tariff impacts on inflation have remained relatively contained. While core PCE inflation – the Fed’s preferred gauge – heated up a touch in May, the monthly gain was due to relatively equal contributions from goods and services prices, pushing the year-on-year to 2.7% (Chart 2). Over the coming months, tariff impacts are expected to intensify, though the extent of price passthrough remains uncertain. Driving this point home, Chair Powell maintained a cautionary stance during his semiannual testimony to Congress this week, stating that he expects policymakers to stay on hold until they have a better handle on the impact tariffs will have on prices. This came in contrast to other Fed speakers, including Governor Waller and Bowman, who both noted that they support a July rate cut.
The growing divide among policymakers’ is shaped by differences in the expected passthrough from tariffs and underlying labor market conditions. Waller is of the view that the tariffs wont significantly boost inflation and that because of monetary policy’s long and variable lags, the Fed should proactively cut rates to head off potential downside risks to the labor market. However, Powell and others are of the view that the labor market remains in a good spot and need to see more definitive signs of softening before pushing ahead with rate cuts. This puts next week’s employment report in the spotlight.
Weekly Economic & Financial Commentary: Stag Before Flation
Summary
United States: Stag Before Flation
- Data are beginning to point toward more of the growth-dampening effects of tariffs (i.e., the "stag") hitting before the price effects (i.e., the "flation"). This week's data dump suggests a weaker first half of the year for U.S. growth, and the narrative of an unshakable consumer is in question.
- Next week: ISM Manufacturing (Tue.), ISM Services (Thu.), Employment (Thu.)
International: Tentative Growth and Tempered Inflation: Global Economic Signals Remain Mixed
- This week, June composite PMI figures for the Eurozone and United Kingdom signaled a tentative but ongoing recovery, although growth remains fragile. On the price front, Canada's underlying inflation held broadly steady, while Australia’s inflation figures surprised to the downside. Turning to emerging markets, in an expected move, Mexico’s central bank Banxico cut its policy rate to 8.00%, though it signaled a more cautious approach toward further easing.
- Next week: China PMIs (Mon.), Japan Tankan Survey (Tue.), Eurozone CPI (Tue.)
Interest Rate Watch: "Well Positioned to Wait"
- During testimony before Congress this week, Fed Chair Powell defended his wait-and-see approach to monetary policy despite mounting pressure to do so. We look at the difference between comments by the Fed Chair and those made by various members of the Board of Governors in this week's Interest Rate Watch.
Topic of the Week: Everything Was Not As It Seemed
- The first two prints of GDP showed an economy that was slowing but not yet collapsing. While growth in consumer spending was weaker than the previous quarter, personal consumption was still expanding. Prospects looked better for Q2 growth, as a drop in good imports of roughly $60 billion in April looked to set up trade to be a boost to growth. However, data printed this past week have changed the story.
Week Ahead – Markets Eye Nonfarm Payrolls as Trump’s Pressure on Fed Mounts
- Middle East ceasefire and Fed shenanigans weigh on the Dollar.
- ISM PMIs and Nonfarm payrolls to impact Fed rate cut bets.
- Eurozone inflation and ECB forum to be closely monitored by euro traders.
- China PMIs, Japan’s Tankan Survey and Swiss CPI also in focus.
Israel-Iran ceasefire and Fed independence risks
The US dollar underperformed all its major peers this week, initially coming under pressure after US President Donald Trump announced a ceasefire between Israel and Iran. Although there were some violations of the ceasefire a few hours after the announcement, the accord was respected the last couple of days, allowing a risk-on market response. Equities on Wall Street rebounded strongly, oil collapsed as supply concerns eased, and the US dollar, which acted as the safe haven of choice for this conflict, pulled back.
What may have also weighed on the US dollar were new attacks by President Trump on Fed Chair Powell about not lowering interest rates, with a Wall Street Journal report noting that the President is considering announcing Powell’s successor by September or October. This has raised concerns about the credibility and independence of the Federal Reserve and prompted investors to add to their rate cut bets.
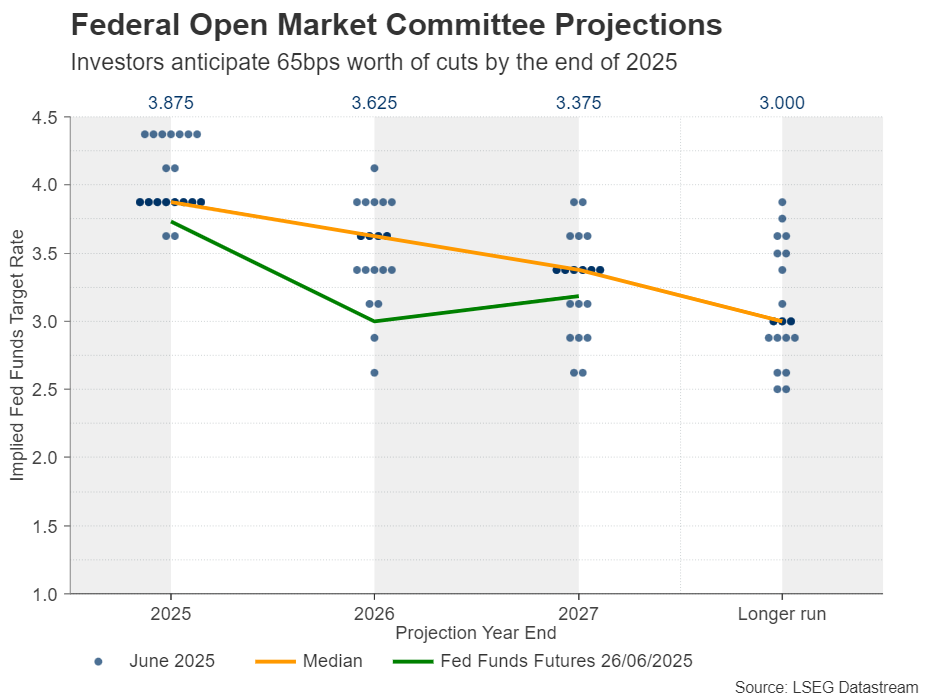
According to Fed funds futures, market participants are now penciling in almost 65bps worth of rate cuts by the end of the year, which means that they agree with the two quarter-point reductions indicated by the Fed’s latest dot plot, but they are also seeing a more-than-50% chance for a third one. The first reduction is more than fully priced in for September, while the probability of acting as soon as in July has risen to 25%.
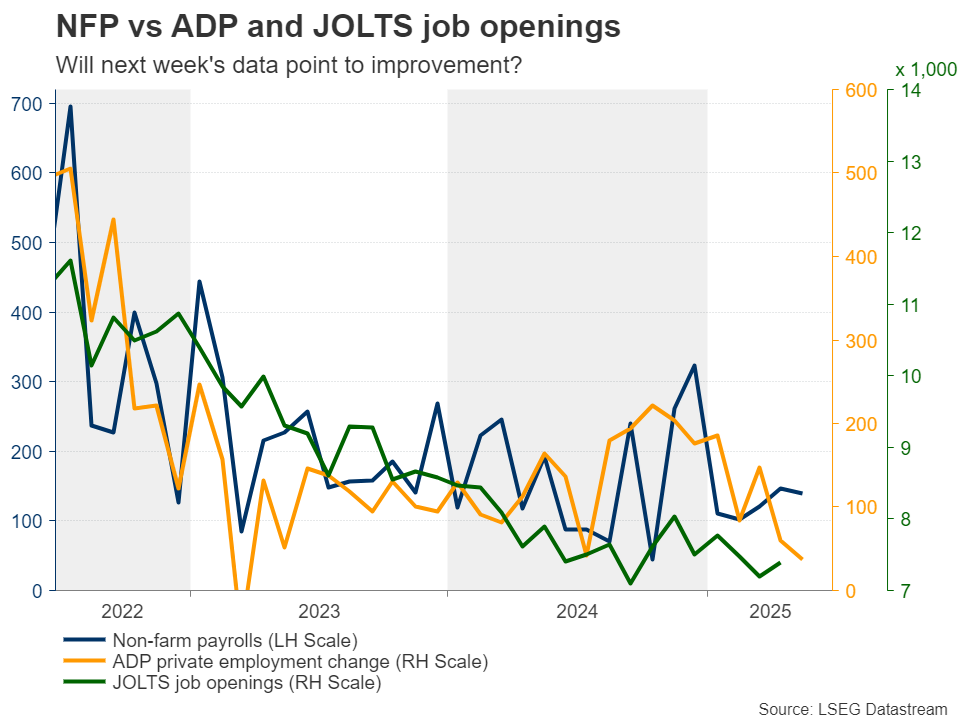
ISM PMIs and Nonfarm Payrolls enter the spotlight
With all that in mind, as they try to better assess how the Fed may navigate monetary policy, investors are likely to pay extra attention to the ISM manufacturing and non-manufacturing PMIs for June, due out on Tuesday and Thursday, respectively, but the spotlight is likely to fall on the NFP report for the same month, scheduled to be released on Thursday, as on Friday, the US will be celebrating its Independence. The JOLTs job openings for May will come out on Tuesday and the ADP private employment report for June on Wednesday.
This week, the preliminary S&P Global PMIs came in higher than expected. Although the composite index pulled back somewhat to 52.8 from 53.0, it was decently higher than the 52.2 forecast. Price pressures rose sharply in both the manufacturing and service sectors, with the former sector reporting an especially steep increase due to tariffs. What’s more, companies increased their employment at a rate not seen for just over a year, largely in response to higher workloads.
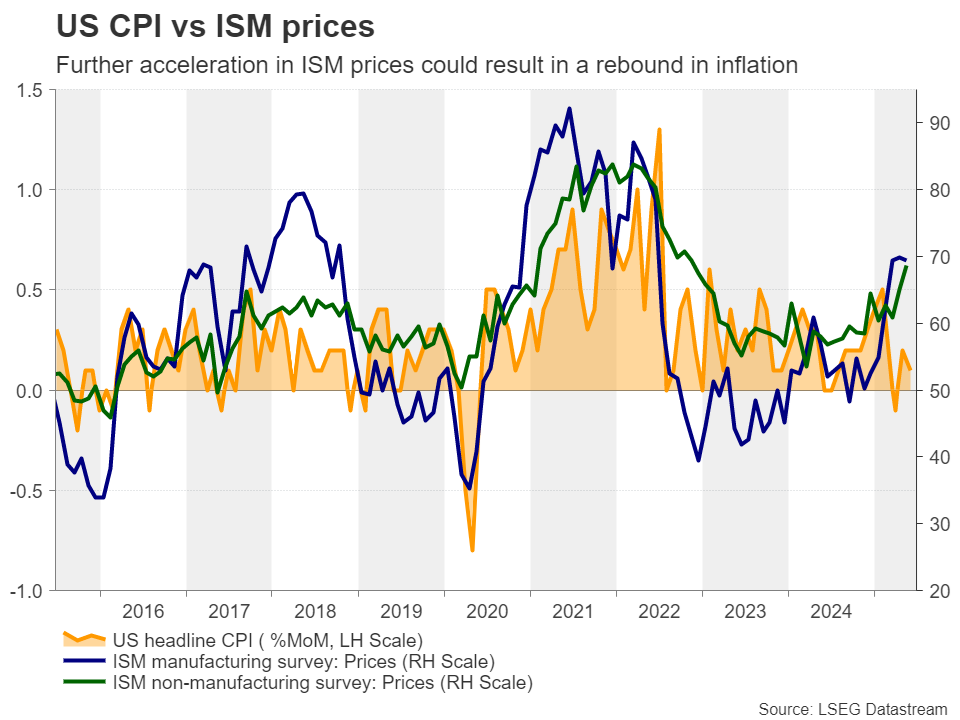
Should the ISM figures paint a similar picture, investors are likely to scale back their rate cut bets, especially if non-farm payrolls continue to indicate that the labor market is faring well. The US dollar is likely to rebound as the market becomes accustomed to the idea that the Fed could remain patient before resuming its rate cut process.
However, with a couple of members already shifting to dovish and supporting a July cut, like Fed Governors Waller and Bowman, and the US President putting more pressure on Powell and his colleagues to lower borrowing cost, any recovery is likely to remain limited and short-lived. At this point, it is worth mentioning that Waller is rumoured to be among the candidates President Trump is considering for replacing Powell, which adds to concerns about the Fed’s independence.
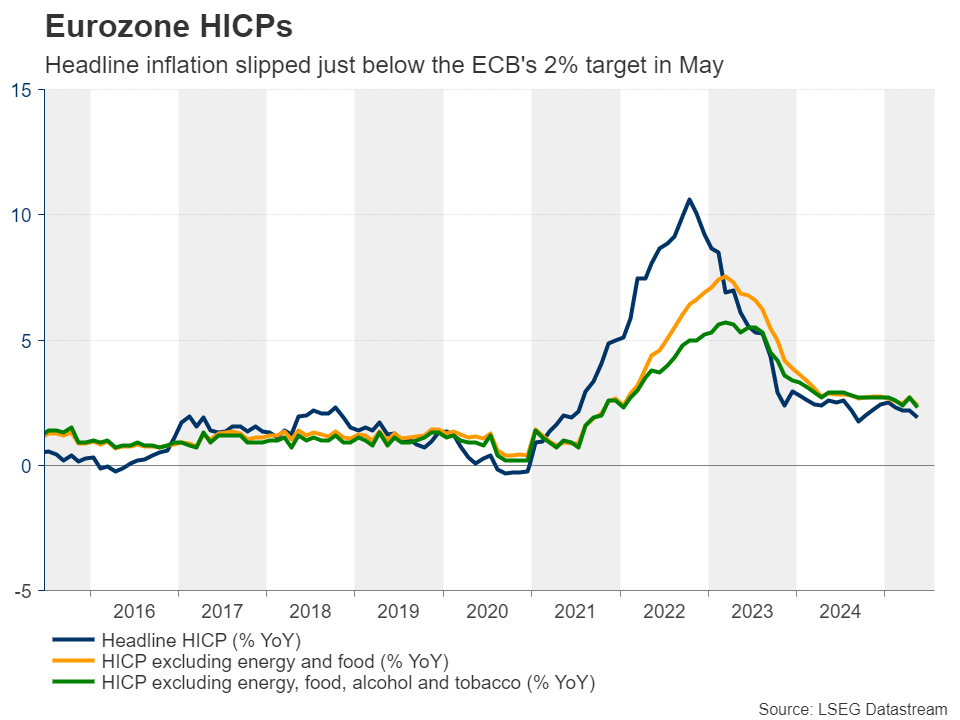
Will the Eurozone CPI data corroborate ECB rate cut bets?
Flying to Europe, with the dollar slipping and the market foreseeing only one quarter-point reduction in the ECB’s arsenal before this easing cycle ends, euro/dollar climbed to a nearly-four-year high.
Next week, euro traders will have to assess the Eurozone’s preliminary CPI data for June, due out on Tuesday. At its latest gathering, the ECB decided to lower interest rates by 25bps, bringing the deposit rate to 2.0%, with President Lagarde noting at the press conference that the decision was not unanimous as one member did not support the decision to cut interest rates. She also said that they are in “good position” with the current rate path, with investors impterpreting the statement as increasing likelihood for a break in rate cuts. What’s more, citing four sources with direct knowledge of the discussion, Reuters noted that there was broad agreement at that meeting about taking the sidelines in July.
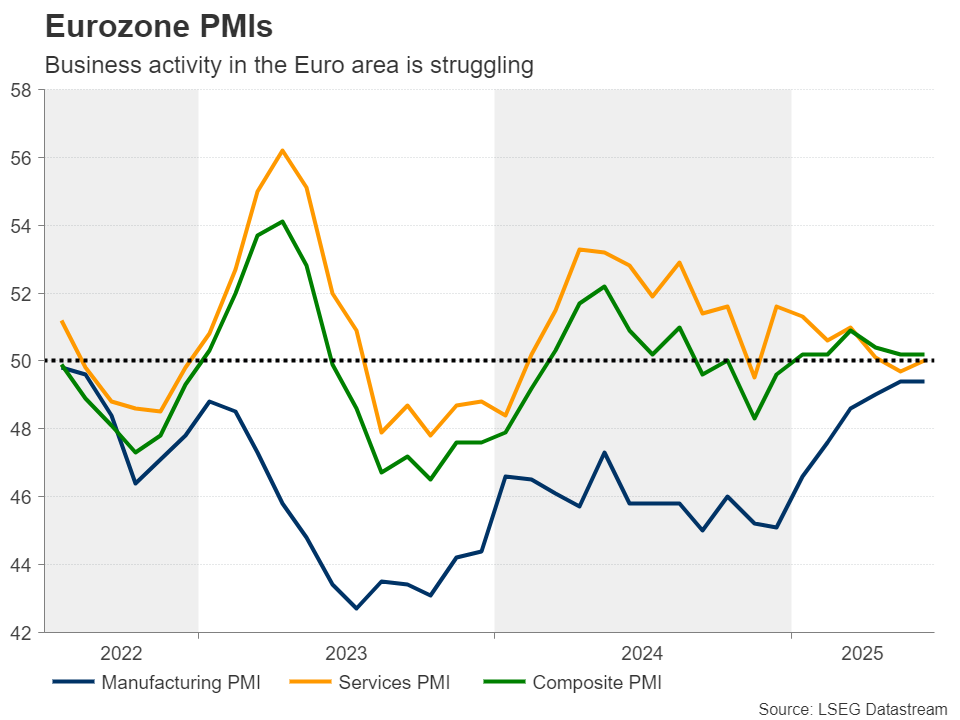
Since then, GDP data revealed higher than expected growth for Q1, while retail sales for April accelerated to 2.3% y/y from 1.9%, instead of slowing to 1.4% as the forecast suggested. This corroborates the idea that the ECB could be a bit patient for now. However, the tumble in industrial production and the weaker-than expected PMIs for June keep the door wide open for at least one more rate cut, even if it is not delivered in July.
With President Lagarde noting again a few days ago that, at the current interest rate levels, they could navigate uncertain circumstances, and that they will follow a data-dependent approach, investors are unlikely to alter significantly their view, even if inflation accelerates somewhat. After all, the Euro area’s headline CPI slipped to 1.9% y/y in May, a tick below the ECB’s objective of 2%.
Instead of expecting the next rate cut to be delivered in December, traders may just push that timing into the beginning of 2026, something that could support the euro somewhat. The preliminary inflation data of the Eurozone’s economic powerhouse, Germany, will be released on Monday, while the ECB forum on central banking begins the same day in Sintra, Portugal. ECB President Lagarde and other policymakers will hold speeches, while among the guests to participate in a policy panel is Fed Chair Jerome Powell.
China PMIs, Japan’s Tankan survey and Swiss deflation
Elsewhere, China’s official manufacturing and non-manufacturing PMIs for June, as well as Japan’s Tankan survey for Q1 are due to be released during the Asian sessions on Tuesday and Wednesday, respectively. Although the deadline of the 90-day tariff-delay Trump imposed to reach deals with the US’s main trading partners is fast approaching, China has a tentative accord that extends into mid-August, which allows time for a more concrete agreement.
The PMIs will reveal how the Chinese economy has been performing during this grace period and upbeat numbers could well benefit the currencies of Australia and New Zealand, which have close trading ties with the world’s second largest economy. As for the Tankan survey, with investors assigning a 50-50 chance of a BoJ rate hike at the end of this year or the start of the next, the outcome could tilt the scale accordingly.
Switzerland’s CPI data for June, due out on Thursday, could also attack special attention. With inflation in Switzerland falling in negative territory, there was speculation that the SNB would cut by 50bps at its prior meeting, taking interest rates into negative territory. This did not happen as the SNB cut by only 25bps to zero.
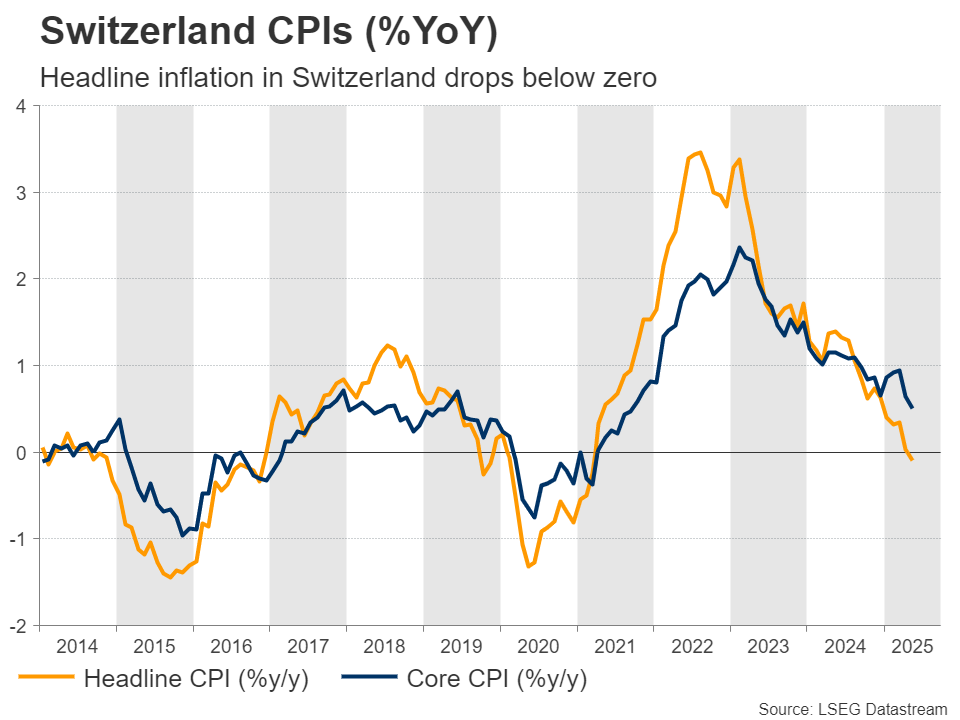
Now, there is a 30% chance of another rate cut at the September gathering and should Thursday’s data suggest that the nation remained in deflation in June, that probability could go higher, thereby weighing on the Swiss franc, which remains very strong despite the latest wave of risk appetite.
Weekly Focus – Budget Risks Replace War Concerns, for Now
The conflict between Israel and Iran has deescalated and a truce seems to hold. This has calmed market fears that Iran might disrupt global energy supplies by hindering traffic through the Strait of Hormuz, and the oil price has declined around 15% since last week's peak, taking it down to levels similar to before Israel's surprise airstrike. Financial markets in general responded relatively calmly to escalation of the conflict, and hence the reaction to the de-escalation has also not been large. Most notably, the USD has come under renewed pressure, also driven by a media story that President Trump might consider replacing Jerome Powell as head of the Federal Reserve before his term ends next year. Trump has very clearly stated his wish for lower interest rates, while Powell this week repeated his view that it is better to wait and see what effect tariffs will have on inflation.
NATO member countries agreed to target defence spending of 3.5% of GDP in 2035, with an additional 1.5% of GDP for defence-and-security related spending. It is unclear how much of the latter will mean higher spending than what already spent, but the former target alone will - if reached - means an additional 1.5% of GDP in spending in the euro area. If a large part of this is financed with new borrowing, as seems likely, it should have a modestly positive effect on European GDP growth in the short term. Over the 10-year implementation period, we expect the impact on GDP to be minimal and the increased demand for defence instead to result in higher interest rates, all else equal. Together with the outlook for easier fiscal policy also in the US, we believe that risks are tilted to the upside for longer bond yields.
In economic data, euro area PMI was slightly to the weak side. It looks like GDP growth declined but remained positive in Q2. The first June inflation data, for Spain and France, was if anything a little higher than expected. US PMI remains somewhat above European, indicating that GDP rebounded in Q2 after the decline in Q1. Consumer confidence disappointed in June and the share of Americans who think jobs are plentiful continues to decline, which has historically been a fairly good indicator of a weakening labour market. As inflation expectations are also easing, sentiment supports the outlook for lower interest rates from the Fed.
In the coming weeks, attention is likely to turn back to US tariffs, as the various postponements of tariff hikes are set to expire, creating deadlines for negotiations. Also, the US budget process for 2026 should be finalised including tax cuts. Economic data, especially for the labour market, should be key in terms of the timing of coming US rate cuts. We will also monitor the ECB's upcoming Sintra Forum (with our colleague Piet Christiansen speaking) for signs of cracks in the internal consensus that rates are at an appropriate level now, although it will take a lot to make a cut at the July monetary policy meeting likely. In China, we expect to see a lift to the economy as US exports rebound, and domestic stimulus increases.
Weekly Focus will be on summer break until 8 August. We wish all readers a happy summer.
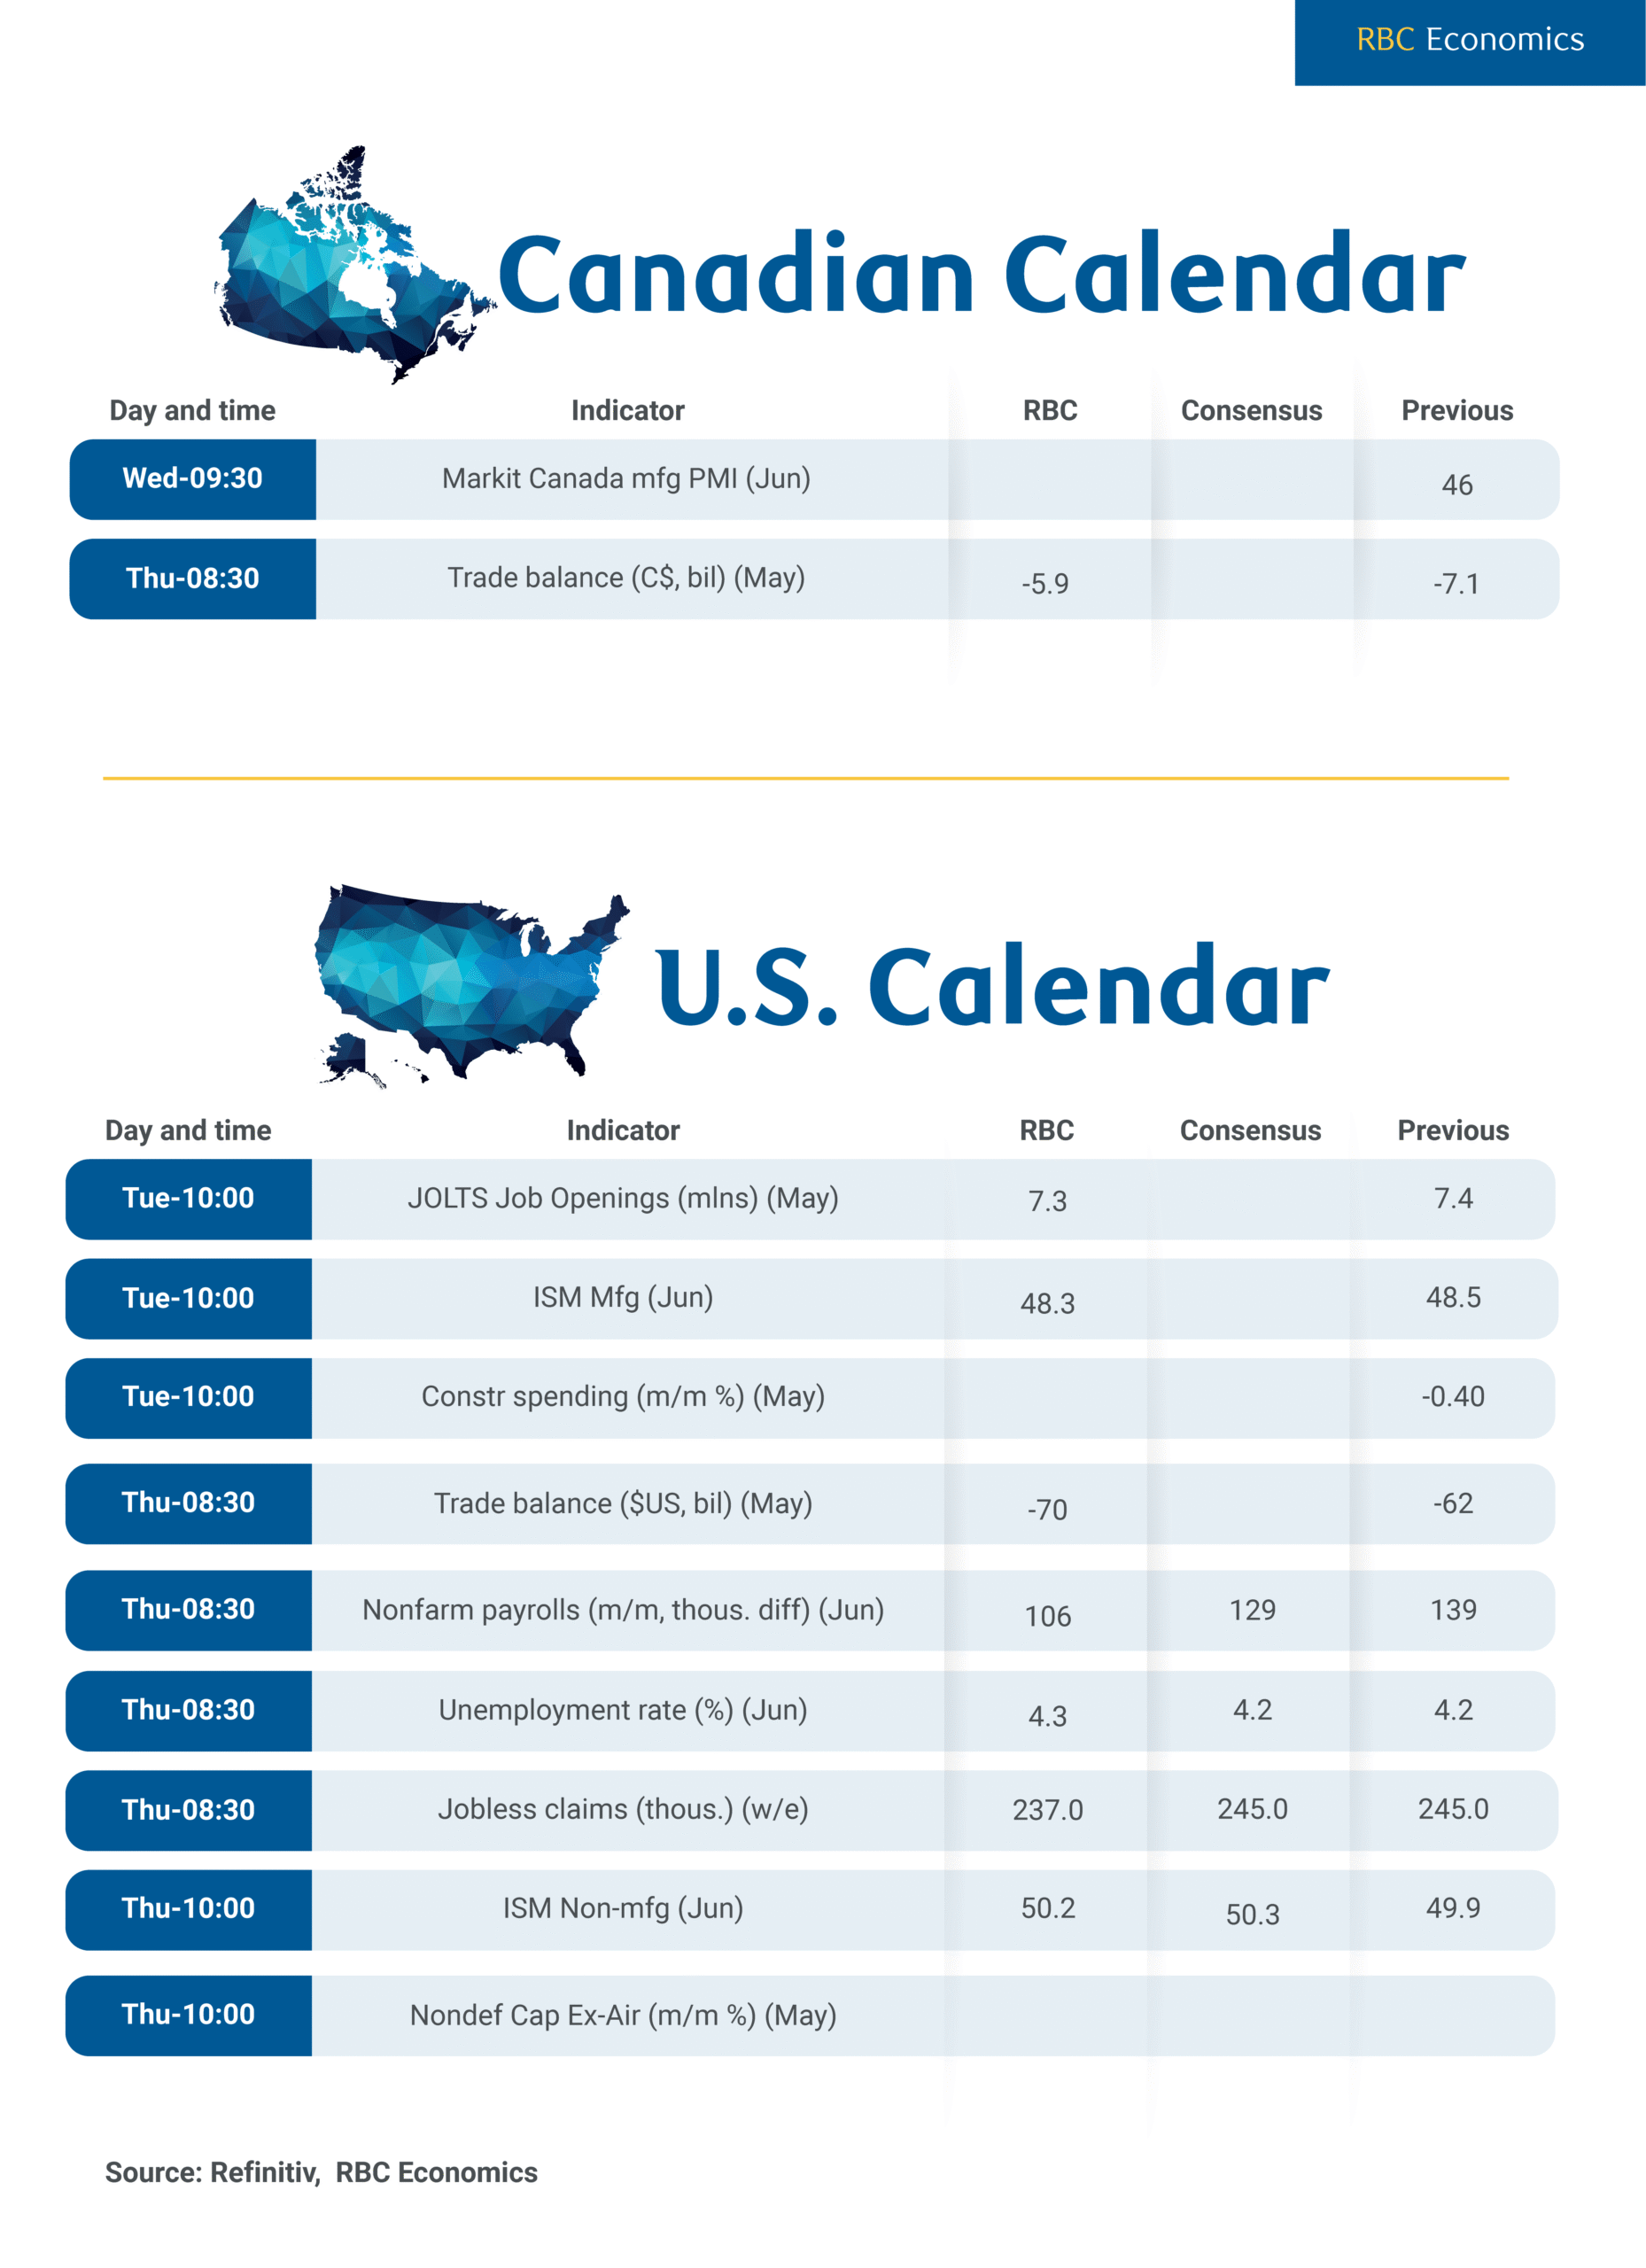
North American Trade Data for May to Add Clarity on Tariff Impacts
North American trade data on Thursday will be closely monitored for further insight into the effects of tariffs. Trade flows between Canada and the United States have been exceptionally volatile. Canadian exports plunged 10.8% in April, caught up in an almost 20% broader decline in U.S. imports as a surge in pre-tariff purchases to boost inventories in Q1 unwound.
The U.S. trade deficit widened in May, according to advance estimates, and we expect the Canadian trade deficit narrowed from the record $7.1 billion shortfall in April, supported by a 1.4% increase in exports and 0.6% reduction in imports. Lower oil prices likely weighed on the Canadian energy trade balance in May, but a bounce-back in U.S. auto imports is consistent with higher Canadian exports during the month.
International trade data is likely to remain volatile with tariff threats from the U.S. administration still looming—including the end of the 90-day pause on the most extreme reciprocal tariffs from April expiring in early July.
Looking beyond the boom-bust inventory stocking cycle around trade announcements, Canada's international trade outlook continues to depend critically on the extent to which the CUSMA/USMCA free trade agreement safeguards duty-free access to the U.S. market. Early results have been encouraging. Nearly 90% of U.S. imports from Canada entered the country duty-free in April, according to U.S. census bureau data, and the average effective tariff rate on U.S. imports from Canada was only 2.3%.
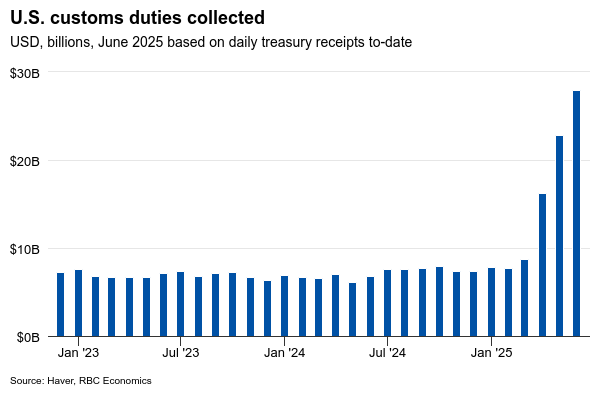
We expect U.S. tariff costs will continue to rise in May with a lag. U.S. custom duty revenues (from all countries) increased another 40% in May and are tracking 20% higher in June. However, we continue to expect the bulk of Canadian exports to the U.S. (86% by our count) should maintain duty-free under current tariff rules. We think Canada will maintain one of the lowest effective tariff rates among all major U.S. trade partners.
Nevertheless, Canada's close economic ties to the U.S. mean it will be negatively impacted if broader trade disruptions weaken U.S. growth. Thursday's U.S. payroll report will provide an updated gauge on the health of its labour markets. There have already been signs of a slowdown in employment in trade-sensitive sectors of the U.S. economy. About 95,000 worth of downward revisions to employment counts in March and April took the shine off of the 139,000 increase in May. For June, we expect the U.S. labour market added 106,000 jobs with the unemployment rate ticking up to 4.3%.
As we move further into the year, we anticipate lingering trade uncertainty will lead to additional job losses. This could drive the unemployment rate higher, which we project will reach 4.5% by year end.
XAU/USD: Gold Loses Ground on Fading Safe Haven Demand
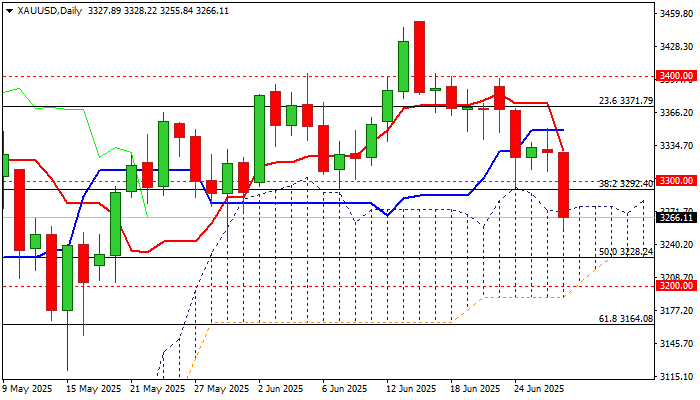
Gold accelerated lower (down almost 2%) on Friday after losing solid supports at $3300 zone, which previously contained several attacks.
The metal lost ground on sharply fading geopolitical tensions, as well as growing positive signs of final US-China trade deal that significantly deflated safe haven demand.
Gold is on track for the second consecutive weekly loss with formation of inverted hammer candle on monthly chart adding to concerns that larger bulls may be running out of steam.
The notion is supported by still strongly overbought monthly RSI and stochastic already out of overbought territory, with weekly indicators being in steep decline and significantly weaker daily studies (14-d momentum is diving deeper into negative territory / daily Tenkan/Kijun-sen created bear cross / price penetrated through the top of daily Ichimoku cloud).
Gold hit one-month low on Friday, with close within the cloud today, to confirm signal and keep the downside exposed, as the latest fall pushed the price into lower zone of larger consolidation range ($3500/$3120)
Bears eye targets at $3228 (50% retracement of $2956/$3500 rally) and $3203/00 (daily cloud base / psychological).
Meanwhile, corrective upticks (Friday partial profit taking) are likely to be limited, with cloud top ($3276) offering immediate resistance and $3000 to ideally cap and keep fresh bears intact.
Only return and weekly close above $3300 would question bears (scenario of false break lower and bear-trap formation).
Res: 3276; 3300; 3329; 3350.
Sup: 3250; 3228; 3200; 3164.
Sunset Market Commentary
Markets
Positive headlines from US Commerce Secretary Lutnick on negotiations with China and other trading partners eased risks related to trade and supported a broad risk-on sentiment. The US has finalized the trade framework with China agreed in Geneva last month and indicated that it is nearing agreements with 10 other trading partners. This good news of course remains quite vague and the devil is in the final details. The potential ‘temporary’ framework that trading partners like the EU will have to cope with as they extend negotiations beyond July 09, remains a source of uncertainty/potential unrest. Whatever these considerations, the Eurostoxx 50 gains 1.1% while the Nasdaq (+0.35%) and the S&P500 (+0.3%) are touching all-time record levels. Yield curves this morning took a breather after recent steepening moves and this was maintained throughout the day. First national EMU CPI inflation data (France HICP 0.4% m/m and 0.8% y/y from 0.6%, Spain 0.6% m/m and 2.2% y/y) were marginally softer than expected. It doesn’t change the picture for ECB policy going into the second half of the year. The ECB policy rate is at a neutral level and it now can hijack the ‘current’ Fed narrative that it is in a good place to navigate multiple event risk/uncertainties. German yields add 2-3 bps. The May US core PCE deflator at 0.2% m/m and 2.7% y/y was slightly higher than expected, but personal income (-0.4%) and spending (-0.1% nominal, -0.3% real) ) showed a substantial miss, indicating a further loss in demand/growth. US ST yields tentatively tried the downside after the publication of the report, but they finally held to the pause after the recent protracted bull steepening. US yields currently are rebounding 3-4 bps across the curve.
Even as (US) yields tried a cautious rebound today, it doesn’t bring reprieve for the dollar. With DXY at 97.1 and EUR/USD 1.1735, the protracted USD retreat simply continues. Softer than expected Tokyo CPI data published this morning still cause the yen to underperform other majors in the overall USD decline (USD/JPY stable near 144.6). Sterling today slightly underperformed the euro (EUR/GBP 0.8545).Gilts basically track, even tentatively outperform EU/German interest rate markets. UK Prime Minister Stramer backtracking on welfare reforms that are estimated to cost £3bn a year for now only had limited impact on (UK) markets. Even so, it further reduces Chancellor Reeves’ policy room and illustrates the tight/highly uncomfortable fiscal framework the government has to cope with. This for sure will return to the forefront when preparing the new budget proposal in autumn. We see it as a structural handicap for sterling going forward.
News & Views
Belgian inflation rose 0.35% M/M in June, pushing the annual figure up from 2.01% to 2.15% and ending the Y/Y decline in place since the start of the year (from 4% in January to 2% in May). Lower electricity prices (-0.7% M/M) partly offset price increases for holiday villages and camping sites (+7.2%), meat (+1.2%), private rents (+0.6%), hotel rooms (+4.2%), household appliances and repairs (+3.7%), restaurants and cafés (+0.3%), non-alcoholic beverages (+1.6%) and fruit (+1.6%). Inflation based on the health index remains unchanged at 2.37% Y/Y. Core inflation rose marginally, from 2.59% Y/Y to 2.63% with rent inflation (4.09% Y/Y from 3.60%) outweighing slightly lower services inflation (3.57% from 3.65%). Energy inflation fell further, from -1.10% Y/Y in May to -1.75% while food price inflation stood at 3.14% Y/Y from 2.04%.
The European Commission’s business and consumer surveys pointed at weakening economic sentiment in the E(M)U. The decline in the Economic Sentiment Indicator (94 from 94.8 for EMU) was primarily driven by reduced confidence the industry (-1.1; sub-indices on order books, stocks and production expectations all down), with retail trade (-0.5; lower assessment of volume of stocks and business expectations for next 3 months) contributing to the downturn to a lesser degree. Confidence in the services sector (+0.2) and among consumers (-0.3) remained broadly stable. Construction confidence continued to pick up (+0.7; rising employment expectations). Among the largest EU economies, the ESI dropped most in France (-3.4), followed by Spain (-1.4) and Germany (-0.8). The Employment Expectations Indicator was unchanged at 97.5. Managers’ selling price expectations continued to decline in industry, services, and construction. Consumers’ price expectations for the next 12 months and perceptions of price developments over the past 12 months decreased as well. Both remain at elevated levels in absolute terms though.