
Sample Category Title
EUR/CHF Daily Outlook
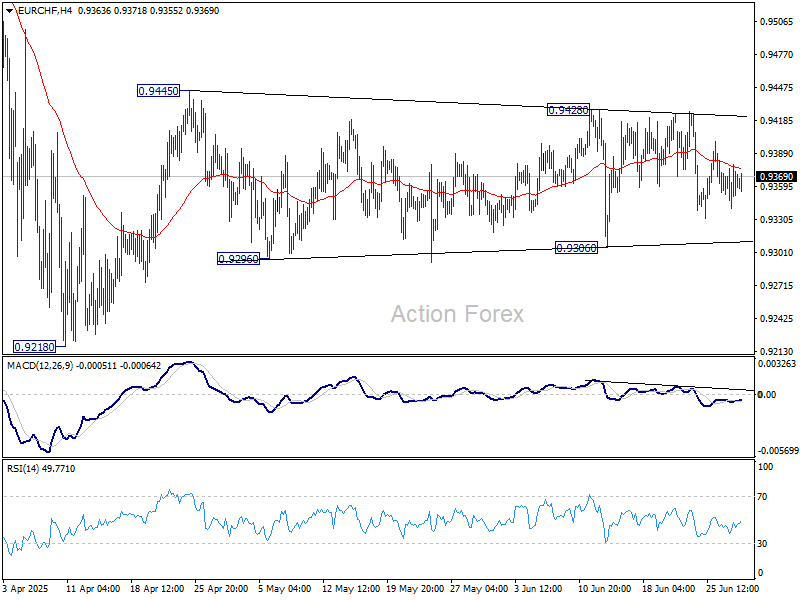
Daily Pivots: (S1) 0.9342; (P) 0.9361; (R1) 0.9381; More....
EUR/CHF is still bounded in range of 0.9306/9428 and intraday bias stays neutral. Further rally is mildly in favor as long as 0.9306 support holds. On the upside, break of 0.9428/45 resistance zone will resume the rebound from 0.9218. On the downside, break of 0.9306 will bring retest of 0.9218 low instead.
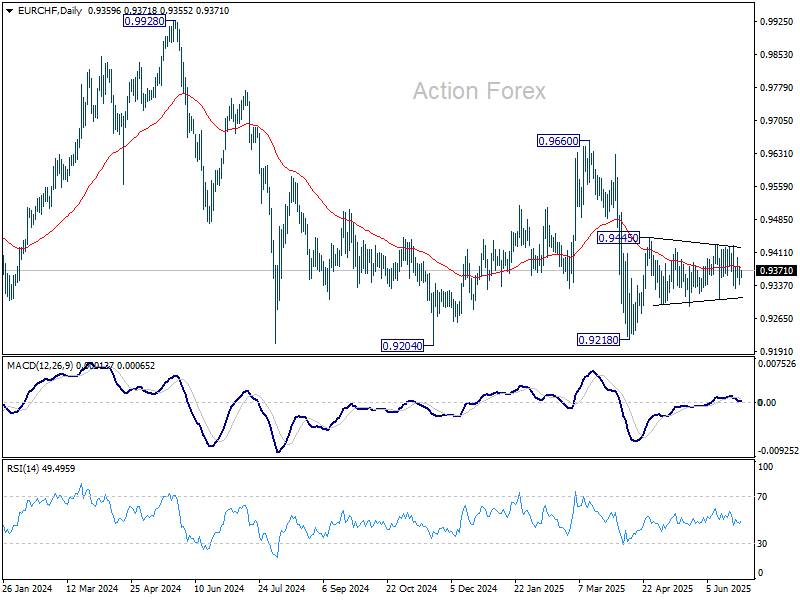
In the bigger picture, while downside momentum has been diminishing as seen in W MACD, there is no sign of bottoming yet. EUR/CHF is still staying below 55 W EMA and well inside long term falling channel. Outlook will stay bearish as long as 0.9660 resistance holds. Break of 0.9204 (2024 low) will confirm resumption of down trend from 1.2004 (2018 high).
Platinum (PL) Soars, Kicking Off Fresh Bullish Rally
Platinum (PL) has broken out of its bearish channel this month, signaling strong bullish trend momentum. This article explores the latest long-term Elliott Wave technical outlook.
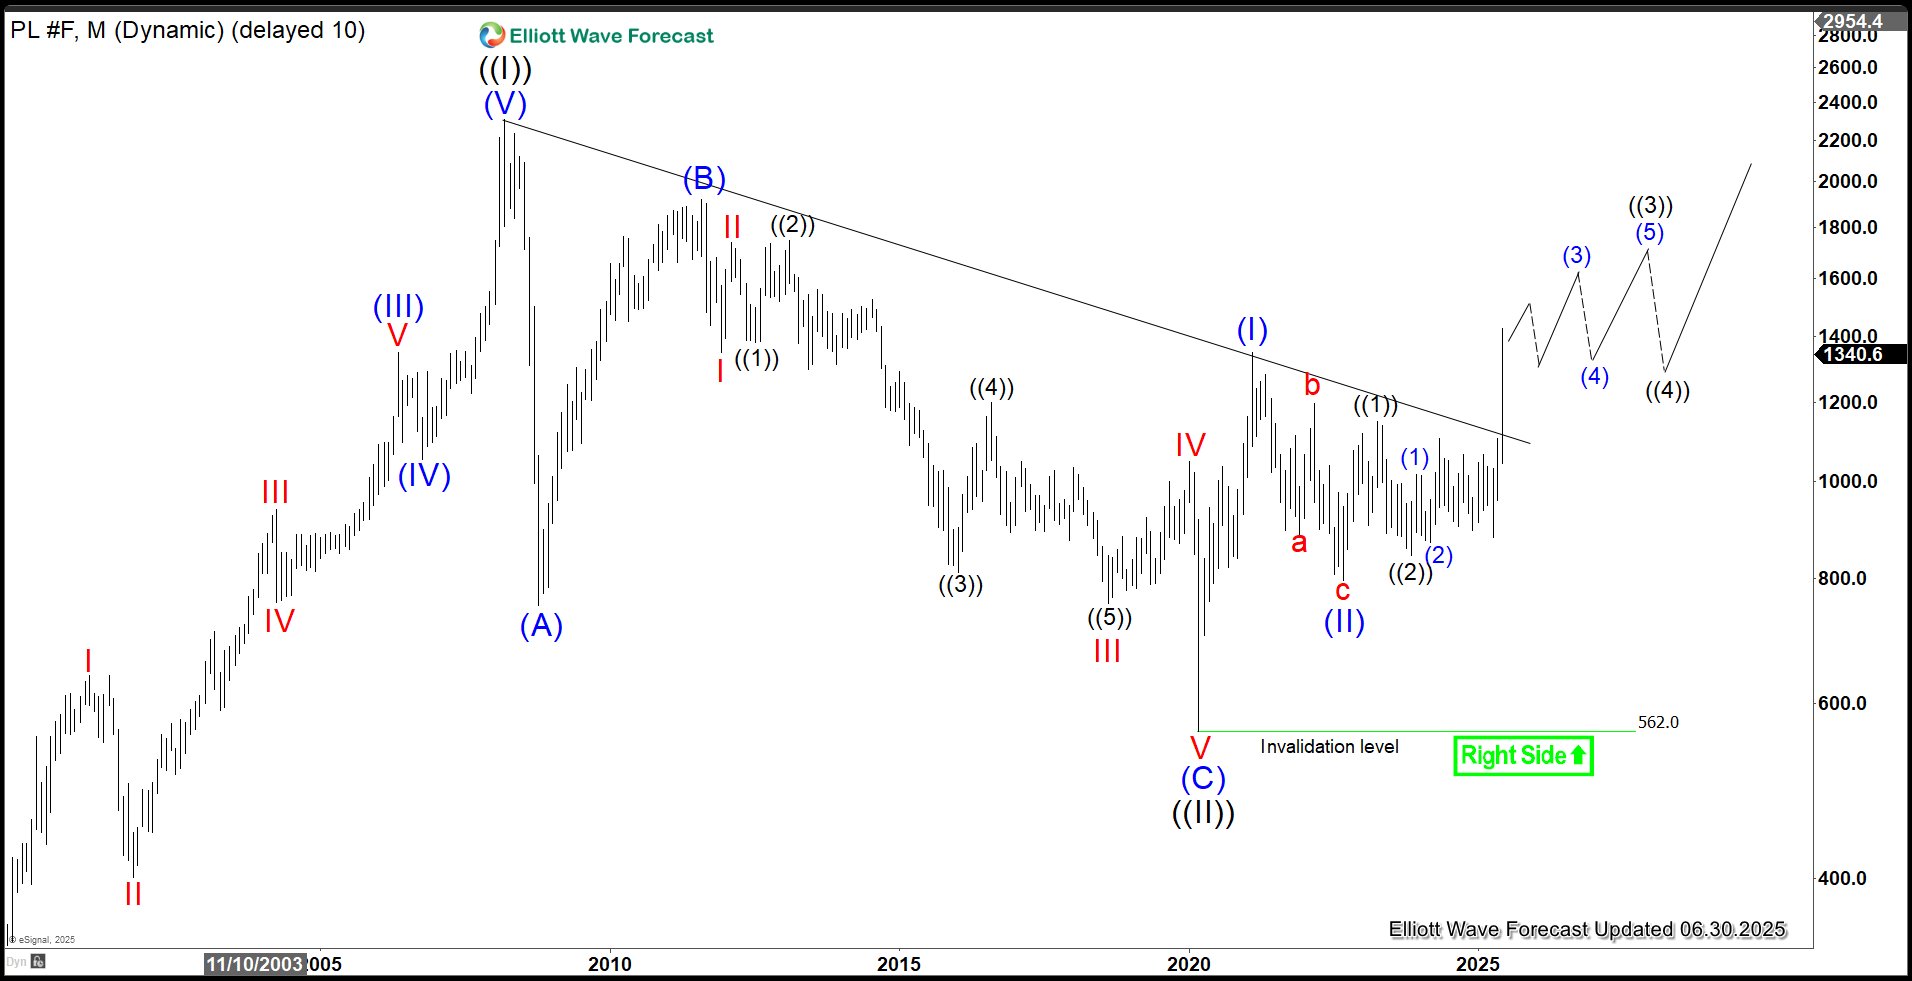
Platinum (PL) Monthly Elliott Wave Chart
The monthly platinum chart indicates that the Grand Cycle wave ((II)) correction concluded at 562. The metal has since turned bullish, advancing in wave ((III)) with a nested impulse structure. From the wave ((II)) low, wave (I) of ((III)) peaked at 1348.2, followed by a pullback in wave (II) of ((III)) ending at 802.1. Platinum has since resumed its upward trajectory, breaking above the descending bearish trendline from the March 2008 peak, confirming a strong bullish shift. The metal is expected to continue rallying within its nested impulsive structure.
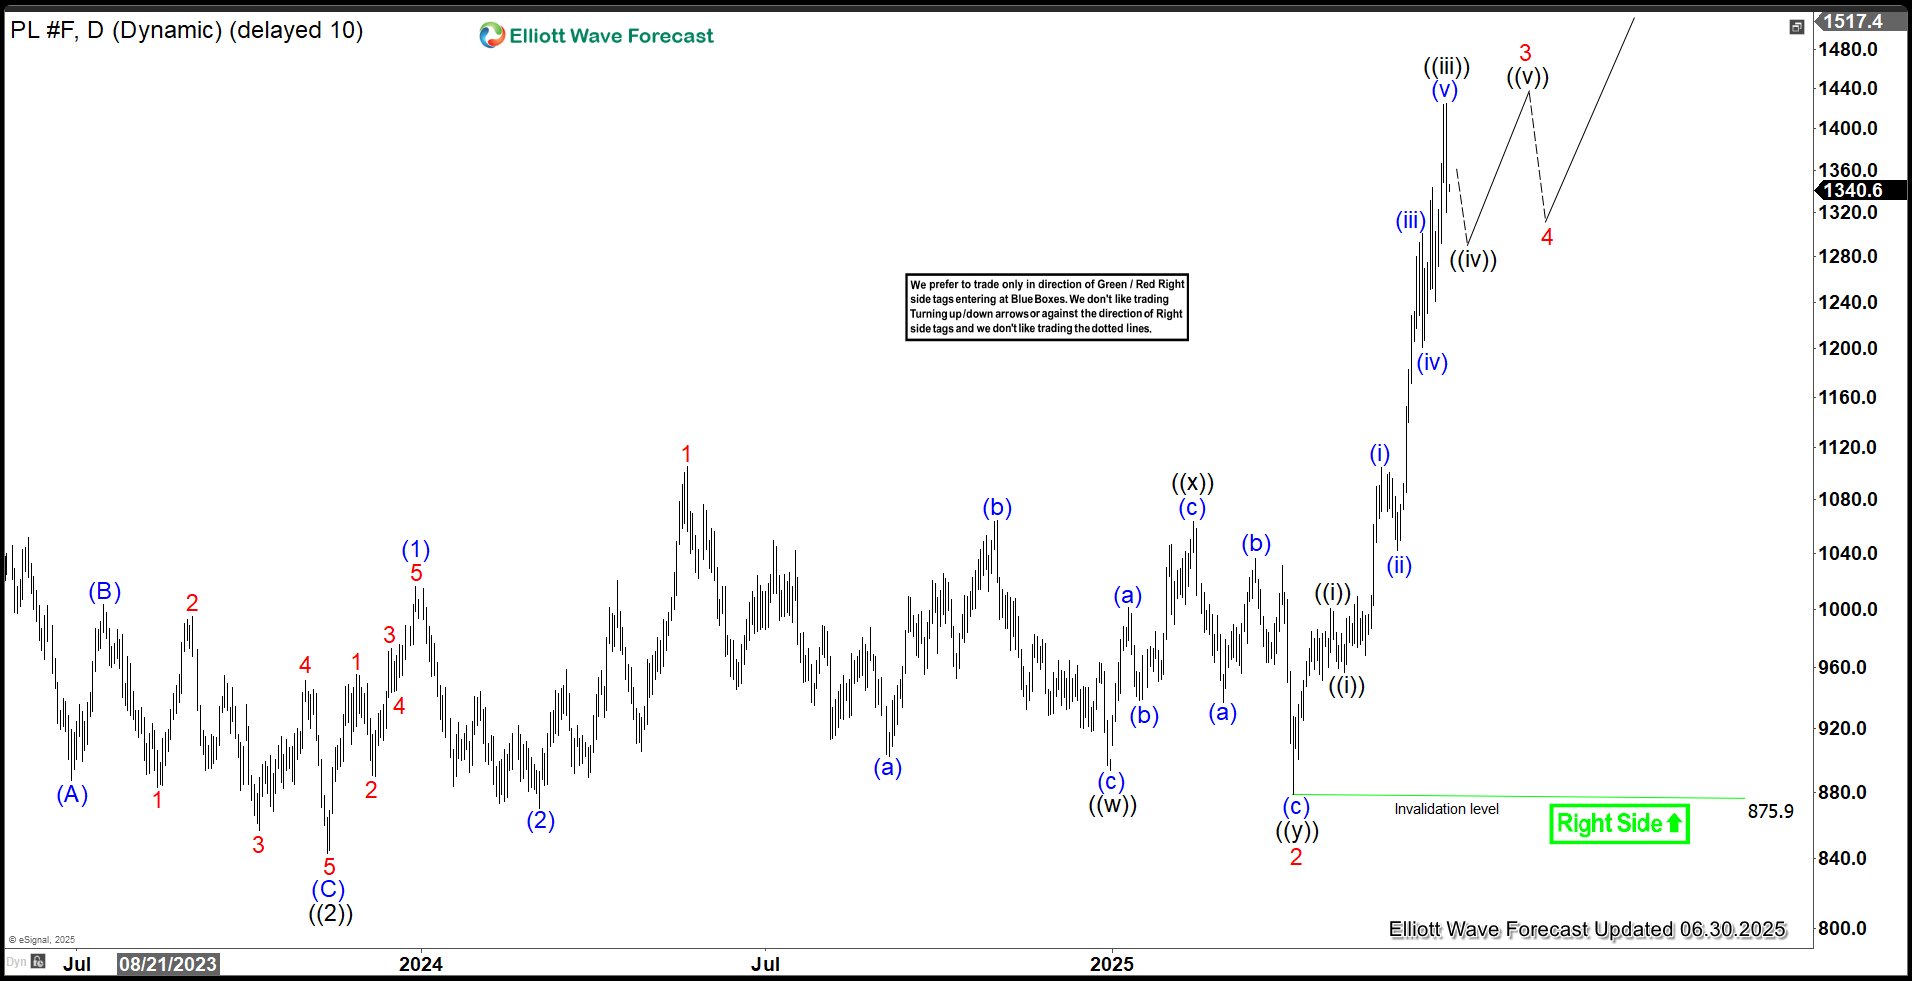
Platinum (PL) Daily Elliott Wave Chart
The daily platinum chart indicates that the wave ((2)) pullback concluded at 843.1. From there, wave 1 peaked at 1105, followed by a wave 2 pullback ending at 875.9. The metal has since resumed its ascent in wave 3. In the near term, as long as the price remains above 875.9, expect platinum to continue extending higher.
Equities Rally Despite Stagflation Fears as Canada Reopens Trade Talks; US Dollar Weakness Further
US equity markets continued their bullish climb on Friday, 27 June, defying renewed stagflation risks. Core PCE inflation for May rose to 2.7% y/y (above April’s 2.6% and consensus), while personal spending contracted -0.1% m/m—the first decline since January, highlighting the impact of tariffs and economic uncertainty on consumer demand.
The S&P 500 (+0.5%) and Nasdaq 100 (+0.4%) both closed at fresh all-time highs, brushing off hawkish trade rhetoric from President Trump. He signalled plans to suspend negotiations with Canada ahead of the 9 July expiry of the 90-day tariff pause, citing retaliation for Canada’s digital services tax and threatening new levies this week.
Canada U-turn boosts risk appetite in Asia
In today’s Asian session, market sentiment was lifted after Canada scrapped the digital tax on US firms and signalled readiness to resume trade talks. This spurred further risk-on momentum, with S&P 500 and Nasdaq 100 E-mini futures up 0.4% and 0.5%, respectively, at the time of writing.
Asian equities joined the rally. Japan’s Nikkei 225 gained 0.9%, heading for its fifth consecutive advance following last week’s breakout.
Hong Kong’s Hang Seng Index pared early losses (-0.8%) to -0.25%, helped by a milder contraction in China’s NBS Manufacturing PMI for June (49.7 vs. 49.5 in May) and a slight uptick in Services PMI (50.5 vs. 50.3 prior). The Hang Seng TECH Index rose 0.1%.
US dollar weakens further; Yen outperforms
The US dollar extended its decline in the Asia session after the US Dollar Index closed the week below critical long-term support at 97.40. It is now down another -0.2% to 97.04, reinforcing the prospect of a sustained bearish trend over the coming weeks and months.
The Japanese yen, previously a laggard, emerged as the top-performing major currency, gaining 0.6% against the dollar. USD/JPY is now trading at 143.90, testing the medium-term ascending trendline support from the 22 April swing low.
Gold eyes rebound after 6% corrective pullback
Gold (XAU/USD), down -6% over the past two weeks, is showing signs of short-term recovery. With prices testing key intermediate support at US$3,250 and deeply oversold technicals, the yellow metal has rebounded 0.4% intraday to US$3,287.
Economic data releases

Fig 1: Key data for today’s Asia mid-session (Source: MarketPulse)
Chart of the day – Bullish momentum intact, Germany 30 is eying a fresh all-time high
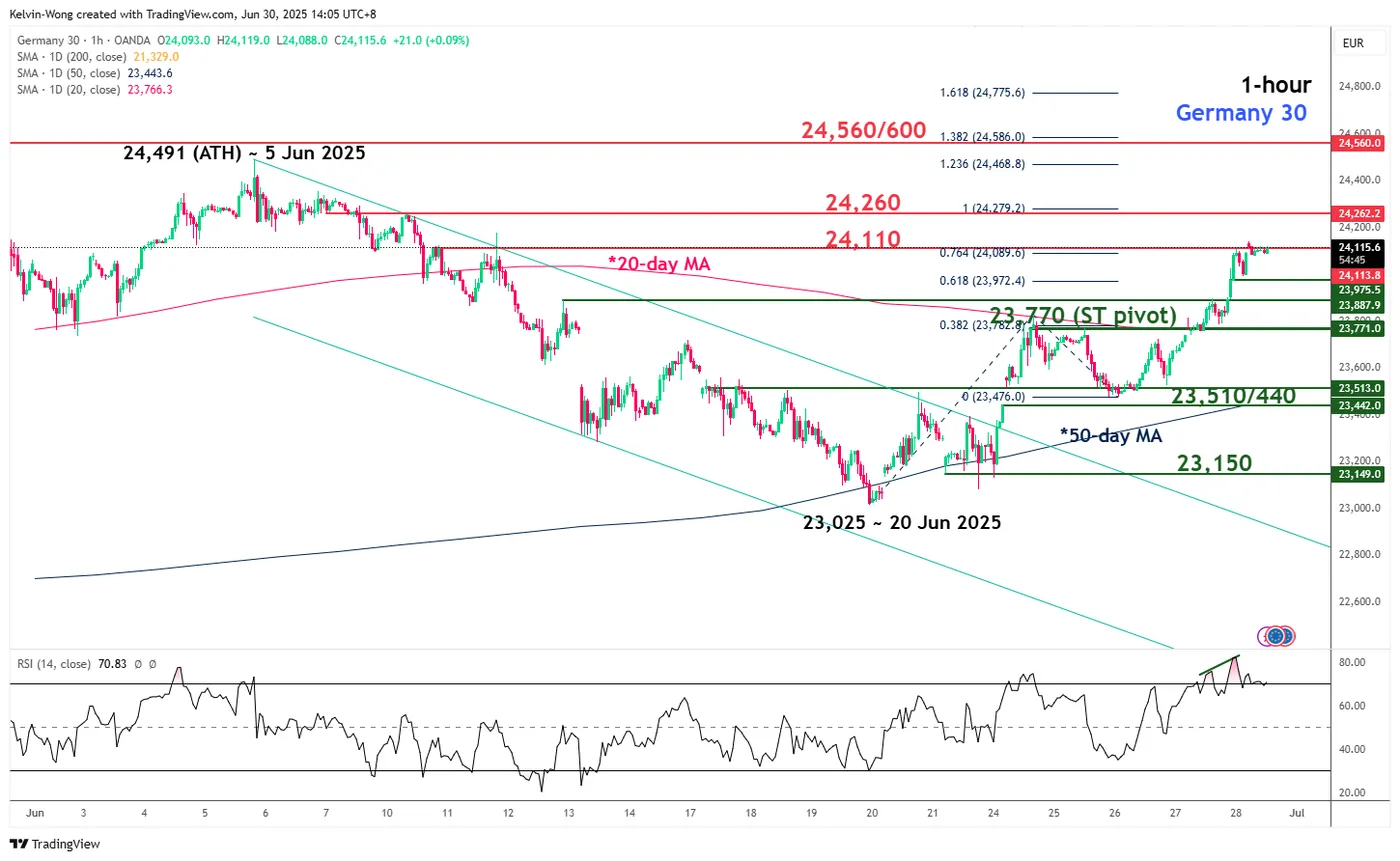
Fig 2: Germany 30 CFD Index minor trend as of 30 June 2025 (Source: TradingView)
Since its retest and bullish reversal on the 50-day moving average seen last Monday, 23 June 2025, the price actions of the Germany 30 CFD Index (a proxy of the German DAX futures) have transformed into a bullish impulsive up move sequence (see Fig 2).
Watch the 23,770 short-term pivotal support (also the 20-day moving average) for the next intermediate resistances to come in at 24,260, and 24,560/24,600 (Fibonacci extension cluster)
However, failure to hold above 23,770 invalidates the bullish tone to kick-start another minor corrective decline sequence to expose the next intermediate support at 23,510/23,440 (also the rising 50-day moving average) before another potential bullish reversal materializes.
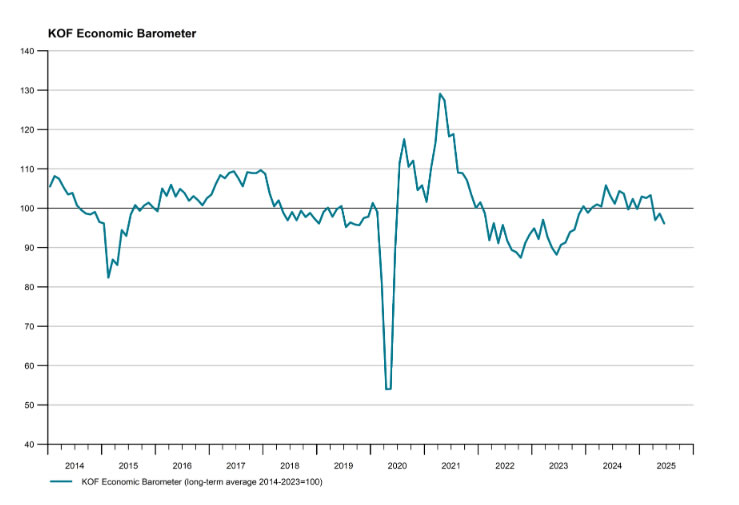
Swiss KOF barometer Falls to 96.1, manufacturing outlook worsens
Switzerland’s KOF Economic Barometer dropped to 96.1 in June from 98.6, missing expectations of 99.3 and marking a renewed deterioration in growth momentum.
The decline reflects broad-based weakness across most underlying components, according to KOF, with the manufacturing sector highlighted as being “considerably under pressure.”
While the overall tone was negative, there was a slight offset from improved foreign demand indicators.
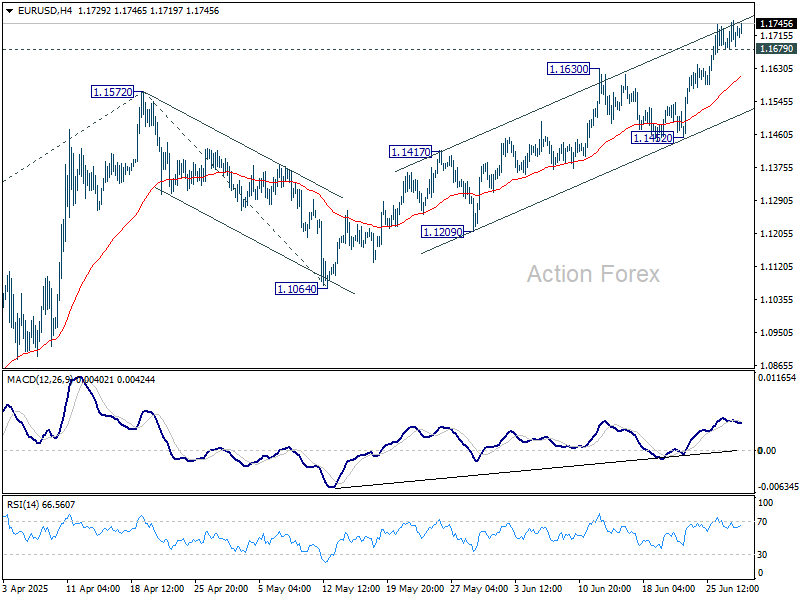
EUR/USD Daily Outlook
Daily Pivots: (S1) 1.1682; (P) 1.1718; (R1) 1.1755; More...
Intraday bias in EUR/USD stays on the upside at this point. Current rally should target 61.8% projection of 1.0176 to 1.1572 from 1.1064 at 1.1927. On the downside, below 1.1679 minor support will turn intraday bias neutral and bring consolidations. But downside should be contained above 1.1452 support to bring another rally.
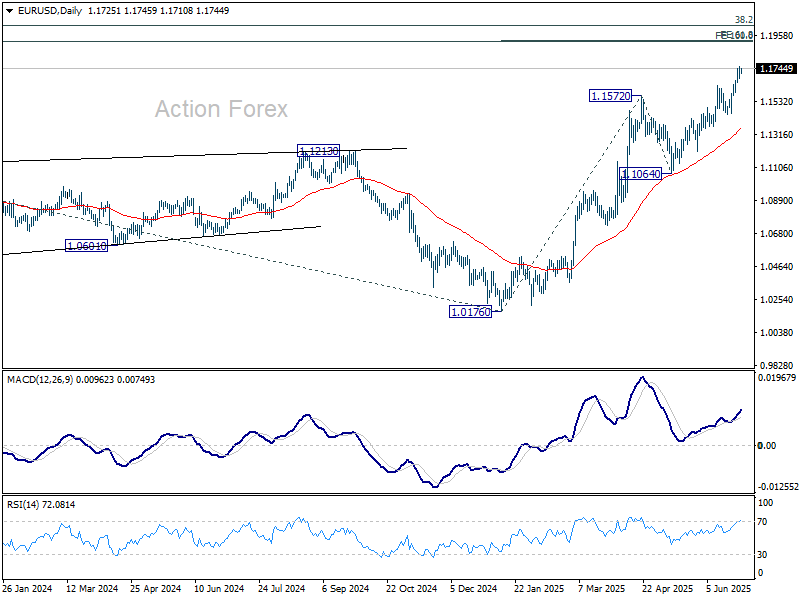
In the bigger picture, rise from 0.9534 long term bottom could be correcting the multi-decade downtrend or the start of a long term up trend. In either case, further rise should be seen to 100% projection of 0.9534 to 1.1274 from 1.0176 at 1.1916. This will now remain the favored case as long as 1.1604 support holds.
USD/JPY Daily Outlook
Daily Pivots: (S1) 144.24; (P) 144.59; (R1) 145.01; More...
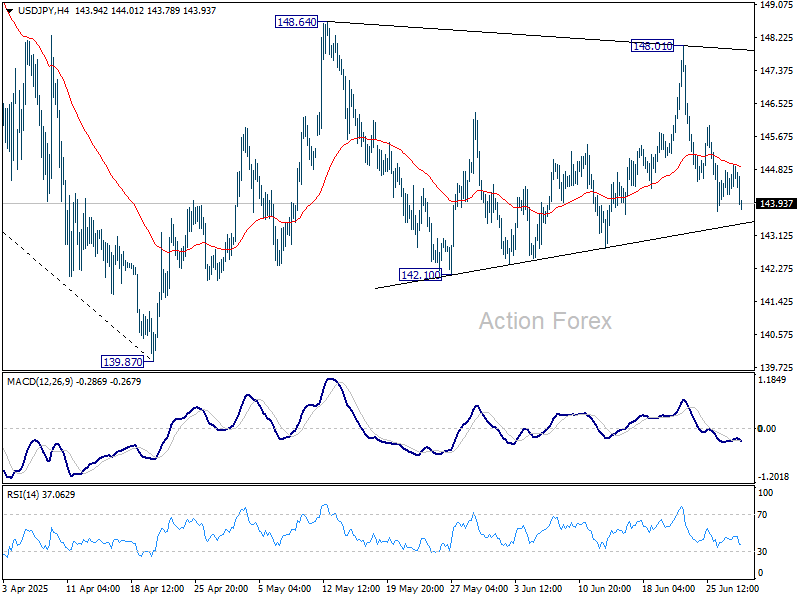
USD/JPY remains bounded in range trading and intraday bias stays neutral at this point. On the upside, firm break of 148.64 will resume the rise from 139.87 to 61.8% retracement of 158.86 to 139.87 at 151.22. However, break of 142.10 will bring deeper fall back to retest 139.87 low.
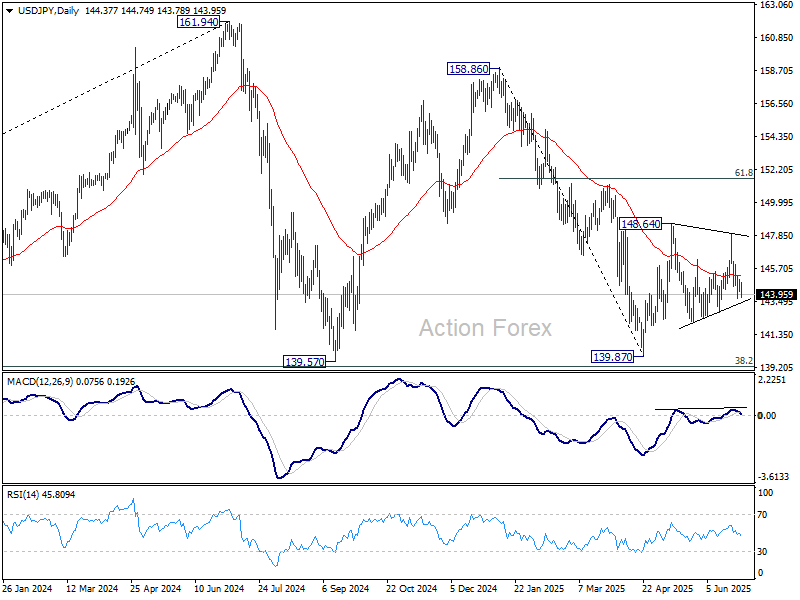
In the bigger picture, price actions from 161.94 are seen as a corrective pattern to rise from 102.58 (2021 low), with fall from 158.86 as the third leg. Strong support should be seen from 38.2% retracement of 102.58 to 161.94 at 139.26 to bring rebound. However, sustained break of 139.26 would open up deeper medium term decline to 61.8% retracement at 125.25.
GBP/USD Daily Outlook
Daily Pivots: (S1) 1.3684; (P) 1.3719; (R1) 1.3754; More...
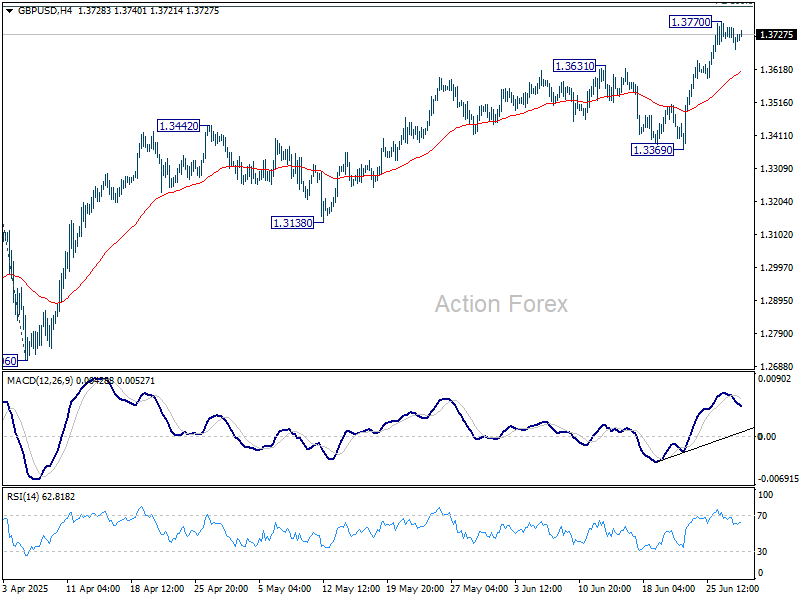
Intraday bias in GBP/USD remains neutral for consolidations below 1.3770 temporary top. Downside of retreat should be contained above 1.3369 support to bring another rally. Above 1.3770 will target 100% projection of 1.2099 to 1.3206 from 1.3138 at 1.3813.
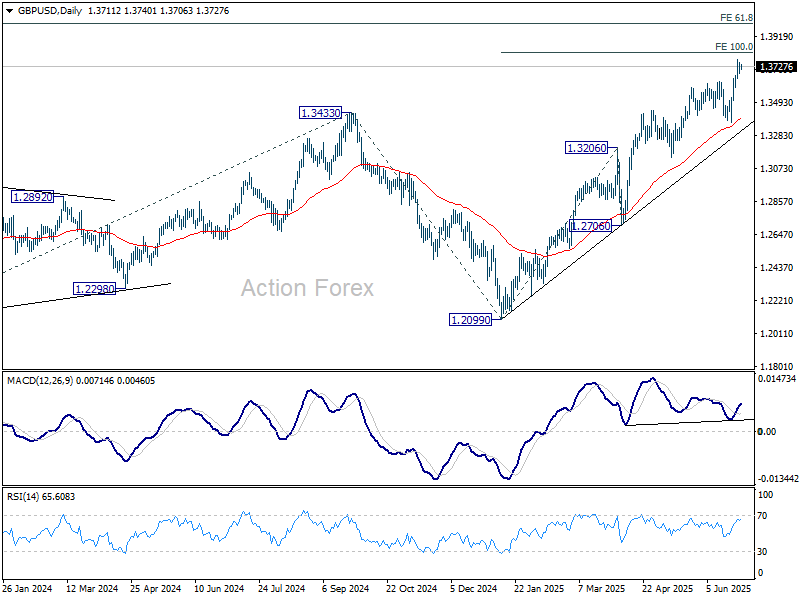
In the bigger picture, up trend from 1.3051 (2022 low) is in progress. Next medium term target is 61.8% projection of 1.0351 to 1.3433 from 1.2099 at 1.4004. Outlook will now stay bullish as long as 55 W EMA (now at 1.2960) holds, even in case of deep pullback.
USD/CHF Daily Outlook
Daily Pivots: (S1) 0.7959; (P) 0.7988; (R1) 0.8019; More….
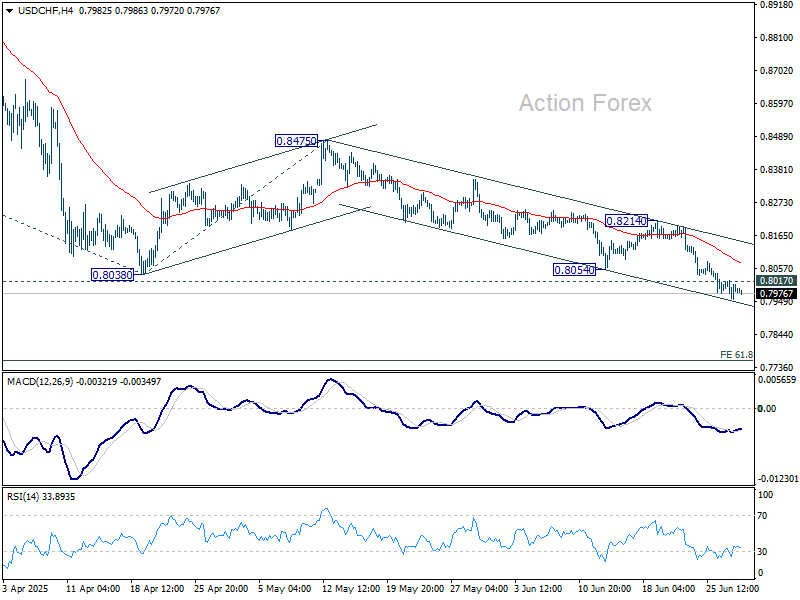
Intraday bias in USD/CHF remains on the downside at this point. Current down trend should target 61.8% projection of 0.9200 to 0.8038 from 0.8475 at 0.7757 next. On the upside, above 0.8017 minor resistance will turn intraday bias neutral and bring consolidations. But recovery should be limited below 0.8214 resistance to bring another fall.
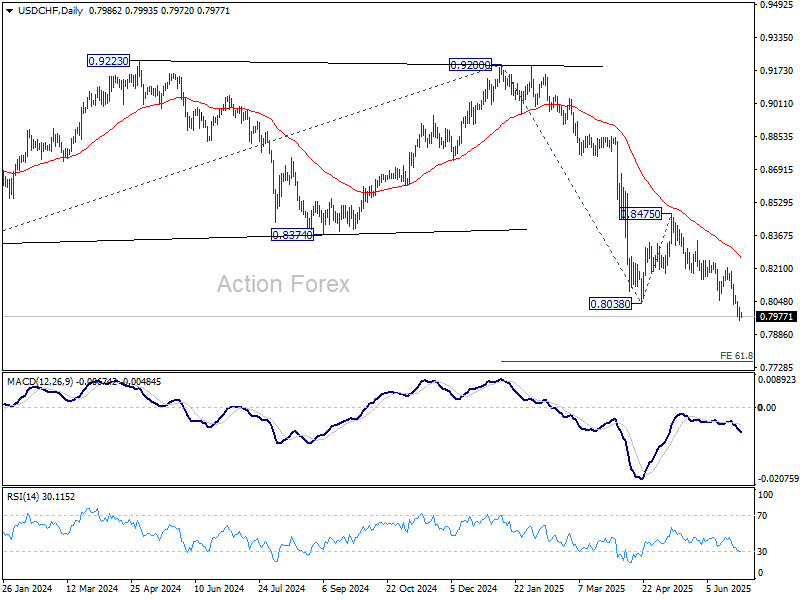
In the bigger picture, long term down trend from 1.0342 (2017 high) is still in progress. Next target is 100% projection of 1.0146 (2022 high) to 0.8332 from 0.9200 at 0.7382. In any case, outlook will stay bearish as long as 0.8475 resistance holds.
AUD/USD Daily Report
Daily Pivots: (S1) 0.6506; (P) 0.6534; (R1) 0.6559; More...
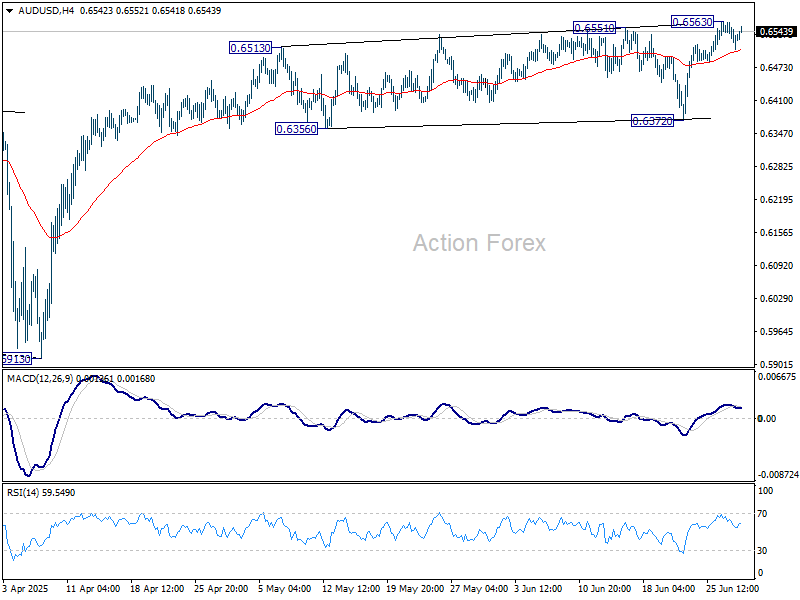
Intraday bias in AUD/USD remains neutral for the moment, and some more consolidations would be seen below 0.6563 temporary top. Near term outlook will stay bullish as long as 0.6372 support holds. On the upside, above 0.6563 will resume the rally from 0.51913 to 0.6713 fibonacci level.
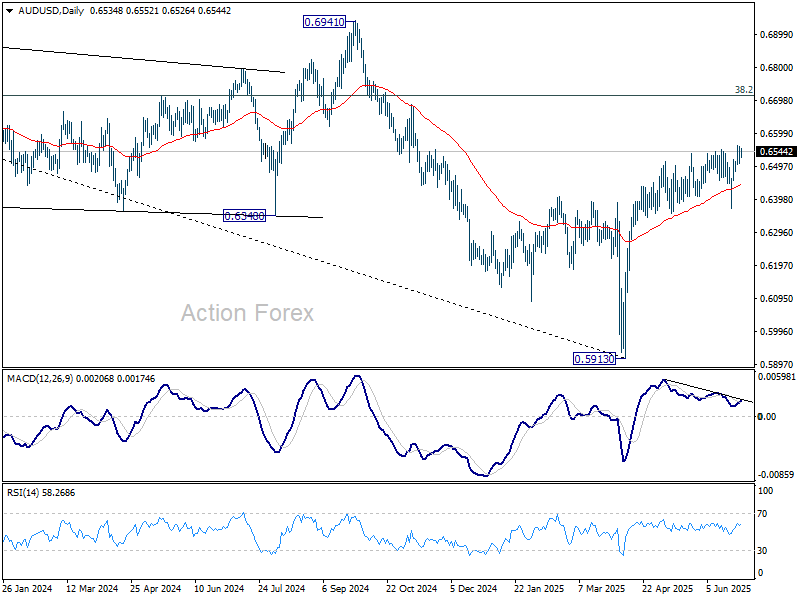
In the bigger picture, there is no clear sign that down trend from 0.8006 (2021 high) has completed. Rebound from 0.5913 is seen as a corrective move. While stronger rally cannot be ruled out, outlook will remain bearish as long as 38.2% retracement of 0.8006 to 0.5913 at 0.6713 holds. Nevertheless, considering bullish convergence condition in W MACD, even in case of another fall through 0.5913, downside should be contained above 0.5506 (2020 low).
US Markets Particularly Vulnerable for Downside Surprises
Markets
US yields looked for and found a bottom after a two-week slide in which the front end outperformed. Net daily changes on Friday amounted to 2.9-4.5 bps across the curve. European rates added up to 2.5 bps at the front amidst markets slowly coming to terms with the end of the ECB’s easing cycle. The risk-on vibes, initiated by US Commerce Secretary Lutnick, supported the move. The July 9 tariff pause deadline approaches fast but the US says several deals are in the making. According to US Treasury Secretary Bessent that could be the case for 10 or 12 of the important 18 trade relationships. He added that the remaining 20 others or so may be wrapped up by Labor Day (Sep 1). Noises coming from the EU-US trade talks are encouraging with both sides confident about reaching a deal by the July deadline. And Canada ditched its digital services tax in a bid to revive talks (see below). Trump’s massive tax bill, meanwhile, was being massaged through the Senate. This is particularly important for the long end of the curve. The Senate’s version of the BBB cleared the initial vote by 51-49 over the weekend. It paves the way for a marathon voting session today on dozens of amendments, to be followed by a final vote. That could come as soon as late Monday or early Tuesday. It then returns to the House. If they vote it down, both chambers need to work on a compromise that will almost certainly delay the July 4 deadline imposed by president Trump. If the House greenlights the Senate version, then we’ll be looking for a roughly $3.3tn increase to the US deficit in the 2025-2034 period, the Congressional Budget Office estimated on Friday. More than half, $2tn, would already come in the next five years. Such a dire budgetary prospects don’t bode well for the dollar. We remain structurally cautious on sterling for a similar reason. The greenback continues to decline, be it gradually. The trade-weighted index confirmed a break towards new multiyear lows and is currently floating just north of 97. EUR/USD is closing in on the 1.18 big figure ever since it moved beyond final resistance (ahead of the 2021 high) at 1.1685/1.1704. The pair is trending higher nicely along an upward sloping channel.
This week’s economic calendar offers an important update on the US economy with the ISM business confidence indicators, JOLTS job openings and the June payrolls report. US markets are particularly vulnerable for downside surprises that could spur more speculation on Fed cuts. Portugal’s Sintra is in the center of attention with the ECB’s yearly Forum on Central Banking taking place. Kick-off is today. The central bank also releases its conclusions of its strategic review while Germany is scheduled to release inflation numbers ahead of the European print tomorrow.
News & Views
News agency Reuters this weekend reported that OPEC+ will decide at its July 6 meeting on another 411k b/day production boost for the month of August. They implemented similar-sized output increases in May, June and July. The rumours – according to four OPEC+ delegates – triggered a test of last week’s post cease-fire low in oil prices (Brent crude $67/b). Both easing of geopolitical risks and OPEC’s course boost supply expectations at a time when global demand growth is strained by uncertainty over the impact of trade policies.
Canada pulled a 3% tax on revenue for the biggest technology companies just hours before it came into effect. The digital services tax prompted US President Trump to terminate ongoing trade talks between both nations. Canadian PM Carney said that scrapping the tax will support a resumption of negotiations towards a July 21 deadline agreed at this month’s G7-meeting. The Canadian Loonie was in for a wild ride with USD/CAD gaining a big figure on Friday after the Trump comments, only fall all the way back to 1.3665 this morning following the Canadian U-turn.