
Sample Category Title
Mr Late Better Be on Time Today
Markets
The US dollar capped the first half of 2025 with the weakest performance YtD since 1973 and new multiyear low. The trade-weighted index closed at 96.88, the weakest level since February 2022. EUR/USD rose for an eighth day straight with the pair now testing the upper bound of the upward sloping trend channel near the 1.18 big figure. USD/JPY technical looks a bit less disastrous but the duo weakened yesterday nonetheless to 144.03. GBP isn’t in the best shape either – EUR/GBP shot up to 0.858 yesterday – but still outperformed the dollar. Cable returned the very recent highs north of 1.37. We’ve seen no particular trigger for yesterday’s dollar weakness. It’s simply the result of ongoing overall (US) policy uncertainty, an unsustainable fiscal path and the prospect of (aggressive) Fed cuts later this year. Touching on these individually, we’ve seen some positive noises coming one the trade front regarding the likes of the EU – which according to Bloomberg yesterday said it would accept a 10% universal tariff in return for exemptions on key sectors such as pharma and semiconductors. A potential (framework of a) deal is beneficial for the currency involved in the first place, in this case the euro, despite the amount of details that would still needed to be worked out afterwards. Japan is on the other side of the spectrum with president Trump lashing out at the country and threatening to send it a letter with a unilaterally set import tariff rate. In terms of unsustainable public finances, the Senate is in the process of voting on dozens of amendments to the $3.3tn deficit-raising BBB that eventually culminate in a final up-or-down vote on the bill. The latter is expected for this afternoon. Increasing bets for Fed rate cuts, finally, have also weighed on the dollar recently. Since Powell’s subtle tweak before Congress last week, markets are eager to spot any speck of weakness in economic data. That’s how they’ll look at this week’s releases as well, starting today with the US manufacturing ISM and JOLTS job openings. It makes both the dollar and US yields vulnerable for further losses. The latter dropped another 2.8-6.1 bps in a bull flattener. We’re wary for the long end of the curve though, with the mega bill underway. It’s what we see in Europe as well, where the long end started underperforming the front particularly in the wake of Merz’ fiscal whatever it takes early March and yesterday again (Germany +3 bps in the 30-yr). US President Trump meanwhile send a letter to Fed chair Powell, listing all the countries with lower policy rates than the US and insisting on him to lower rates. “Jerome - You are, as usual, “Too Late”. You have cost the USA a fortune and continue to do so. You should lower The Rate – by a lot! Hundreds of Billions of Dollars Being lost! No Inflation.” Mr Late better be on time today with the highlight of the ECB’s Sintra event: a panel chat that includes ECB’s Lagarde, BoE’s Bailey, BoJ’s Ueda and himself.
News & Views
The quarterly Tankan confidence survey of the Bank of Japan indicates that activity remains quite resilient despite overall uncertainty, in particular on trade. The headline large manufacturing index improved from 12 in Q1 to 13 in Q2. A similar index of the non-manufacturing sector eased slightly from 35 to 34, but both indices printed stronger than expected. Companies are turning a bit less confident on the upcoming quarter (12 & 27 respectively) but the also these measures remained stronger than expected. Big companies (both sectors combined) expect capital investment to rise by 11.5% fiscal year 2025. Japanese firms expect CPI inflation to stay above the 2% target both short-term and longer term (1-y 2.4%, 3-y ahead 2.4% and 5-y ahead 2.3%). While the BoJ recently turned a bit more cautious on the timing of further easing, today’s survey at least suggests the debate on the timing/pace of further policy normalization is here to stay and might become again more concrete when uncertainty on trade eases later this year. The yen strengthens modestly this morning, with USD/JPY drifting below the 144 big figure (143.65).
According to the price measure from the UK retail industry group BRC, shop prices accelerated in June from -0.1% Y/Y to 0.4% Y/Y. It was the first positive reading since July of last year. The rise was mainly driven by a further substantial monthly rise in food prices (0.7% M/M from 0.4% in May) raising the Y/Y measure from 2.8% to 3.7%. The rise in non-food shop prices remained more modest at 0.1% M/M keeping this measure in negative territory Y/Y (-1.2% from 1.5%). BRC comments that “Within three months of the costs imposed by last Autumn’s Budget kicking in, headline shop prices have returned to inflation for the first time in close to a year. Food inflation showed little sign of slowing down, particularly in fresh produce, where prices of meat have been impacted by high wholesale prices and more expensive labour costs”.
AUD/USD Daily Report
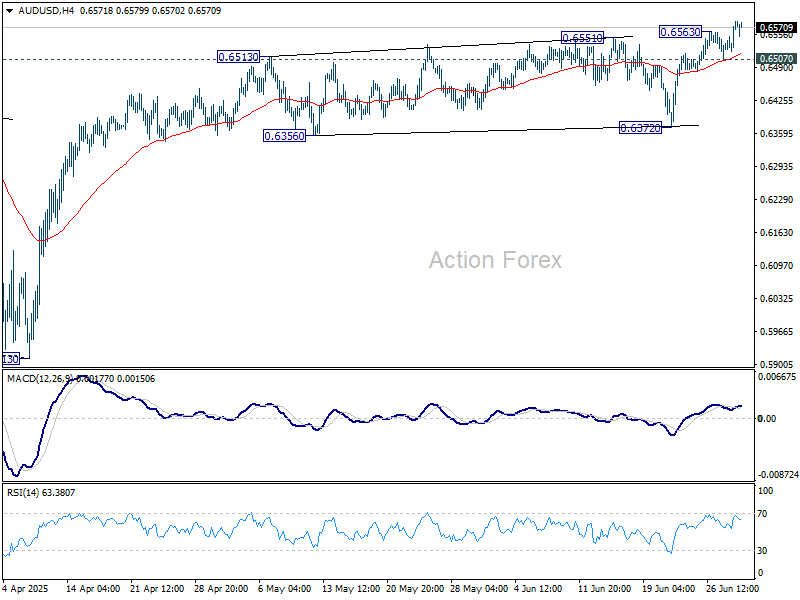
Daily Pivots: (S1) 0.6542; (P) 0.6563; (R1) 0.6603; More...
AUD/USD's rally resumed after brief consolidations and intraday bias is back on the upside. Current rise from 0.5913 should target 0.6713 fibonacci level. On the downside, below 0.6507 will turn intraday bias neutral again. But outlook will remain bullish as long as 0.6372 support holds, in case of retreat.
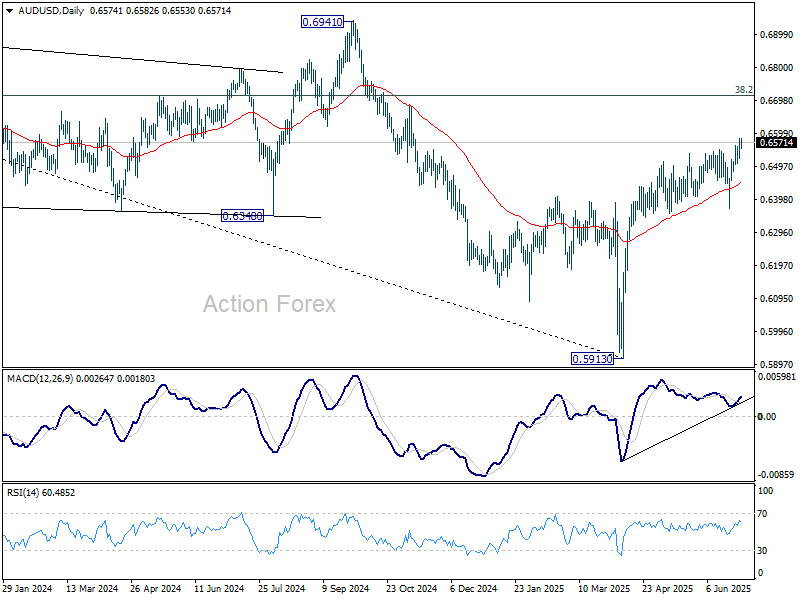
In the bigger picture, there is no clear sign that down trend from 0.8006 (2021 high) has completed. Rebound from 0.5913 is seen as a corrective move. While stronger rally cannot be ruled out, outlook will remain bearish as long as 38.2% retracement of 0.8006 to 0.5913 at 0.6713 holds. Nevertheless, considering bullish convergence condition in W MACD, even in case of another fall through 0.5913, downside should be contained above 0.5506 (2020 low).
Dollar Drops on Renewed Tariff Risks as Trump Targets Japan, Swiss Franc Shines
Dollar’s selloff extended overnight, breaking to fresh lows against Euro and Swiss Franc, as markets grow increasingly uneasy about U.S. trade policy ahead of the July 9 deadline. While US equities remain resilient, with the S&P 500 and NASDAQ surging to record highs, FX markets are telling a different story, with safe haven flows driving gains in Swiss Franc and Japanese Yen.
US Treasury Secretary Scott Bessent signaled that Washington is prepared to slap higher tariffs on countries failing to reach a deal by next week. The temporary 10% rate is set to expire, potentially reverting to levels as high as 50% announced in April. President Donal Trump has also intensified his rhetoric. In a social media post, he criticized Japan for refusing to import US-grown rice, calling it a symptom of trade partners becoming “spoiled” at the US’s expense. White House spokesperson Karoline Leavitt added that countries unwilling to negotiate “in good faith” would face the full weight of US trade measures.
European leaders are pushing back. French President Emmanuel Macron called the current tariff strategy a form of “blackmail,” arguing that trade tools should promote fairness rather than coercion. He also criticized the US for simultaneously demanding more European defense spending while launching a trade war.
In the currency markets, Dollar is the weakest performer so far this week, followed by Sterling and Loonie. Swiss Franc continues to outperform as a safe haven, leading gains ahead of Yen and Kiwi. Euro and Aussie are trading in the middle of the pack.
Technically, GBP/CHF finally broke out of consolidations this week and resumed the fall from 1.1200. Near term outlook will now stay bearish as long as 1.1017 resistance holds. Sustained break of 61.8% retracement of 1.0610 to 1.1200 at 1.0835 will raise the chance of larger down trend resumption, and target 1.0610 low next.

In Asia, Nikkei closed down -1.42%. Hong Kong is on holiday. China Shanghai SSE is up 0.38%. Singapore Strait Times is up 0.76%. Japan 10-year JGB yield fell -0.039 to 1.397. Overnight, DOW rose 0.63%. S&P 500 rose 0.52%. NASDAQ rose 0.47%. 10-year yield fell -0.053 to 4.230.
Looking ahead, Eurozone CPI flash is the main focus in European session. Eurozone PMI manufacturing final, Germany unemployment and UK PMI manufacturing final will also be released. Later in the day, US ISM manufacturing will take center stage.
BoJ Tankan signals resilience, keeps 2025 hike option alive
Japan’s Q2 Tankan survey showed business sentiment holding firm despite intensifying trade tensions. While today’s Tankan beat won’t trigger immediate action, it keeps the door open for a BoJ hike policy shift before year-end, especially if trade risks stabilize.
Large manufacturers posted a headline index of +13, beating expectations of 10, and reaching the highest level since December 2024. Their forward outlook for September came in at +12, also topping forecasts of 9. The services side was more mixed. Large non-manufacturers remained steady at +34, meeting expectations, but this marked a softening from prior readings, with the September outlook dipping to +27.
Still, capital expenditure plans surprised to the upside: large firms projected FY2025/26 capex to rise 11.5% (vs. 10.0% expected), while small firms were slightly less pessimistic than forecast. The investment data points to continued confidence in the domestic recovery.
Inflation expectations remained broadly stable. Firms anticipate CPI to rise 2.4% over both one-year and three-year horizons—unchanged to slightly lower from the previous survey.
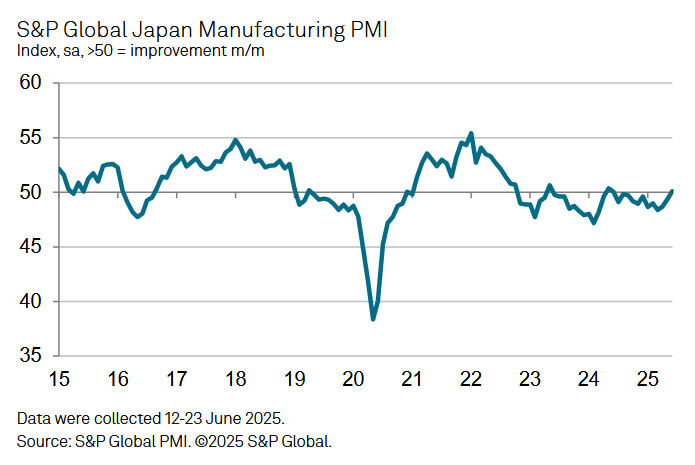
Japan's PMI manufacturing finalized at 50.1, demand still fragile
Japan’s Manufacturing PMI was finalized at 50.1 in June, rising from 49.4 in May. While production and employment ticked higher, underlying demand remained weak.
According to S&P Global’s Annabel Fiddes, firms reported continued declines in both domestic and overseas sales, reflecting the lingering impact of global uncertainty—particularly around US tariff policy.
Despite soft demand, business sentiment improved, encouraging firms to boost output and hiring. However, Fiddes emphasized that a "renewed and sustained improvement in customer demand" is still needed to drive a broader recovery.
Price pressures also "picked up slightly", with both input costs and selling prices rising above their long-term averages, suggesting inflationary risks remain embedded in supply chains.
China Caixin PMI manufacturing rises to 50.4, but optimism fades
China’s Caixin PMI Manufacturing rose to 50.4 in June from 48.3, topping expectations of 49.0 and marking a return to expansion territory. However, Wang Zhe of Caixin Insight cautioned that job losses persisted, external demand remained weak, and price pressures were subdued.
While the latest figures point to near-term stabilization, underlying risks remain elevated. Wang stressed that domestic demand has yet to see a fundamental turnaround and that businesses have grown less optimistic. With logistics and purchasing activity still soft, and global uncertainty intensifying, the sustainability of June’s rebound remains in question unless further policy support or demand recovery materializes.
NZIER survey shows NZ business confidence rising, inflation pressures easing
New Zealand business confidence improved modestly in Q2, with a net 22% of firms expecting better conditions ahead, up from 19% in Q1, according to NZIER’s quarterly survey.
Inflationary pressure appears to be cooling. 1% of firms reported price cuts in Q2, a sharp turnaround from the 8% that raised prices in Q1.
The report pointed to a continued "divergence between firms experiencing weak demand and firms expecting a recovery in demand", underlining an uneven domestic outlook despite improved sentiment.
NZIER said the effect of interest rate cuts since last August has yet to fully feed through to real activity, despite supporting sentiment.
Fed's Goolsbee dismisses stagflation risk, but warns on dual deterioration
Chicago Fed President Austan Goolsbee downplayed the risk of a 1970s-style stagflation scenario. He noted that with unemployment near 4% and inflation around 2.5% and falling, the current environment bears little resemblance to the high-inflation, high-unemployment era.
Speaking overnight, Goolsbee emphasized that today’s economic fundamentals are far stronger, with inflation far below double digits and labor markets still tight.
However, he cautioned that simultaneous deterioration in both inflation and employment remains possible. “There's definitely the possibility of both things getting worse at the same time,” he said. Goolsbee framed the outlook in terms of evaluating how large and lasting each side’s deviation might be—whether shocks are temporary or structural.
AUD/USD Daily Report
Daily Pivots: (S1) 0.6542; (P) 0.6563; (R1) 0.6603; More...
AUD/USD's rally resumed after brief consolidations and intraday bias is back on the upside. Current rise from 0.5913 should target 0.6713 fibonacci level. On the downside, below 0.6507 will turn intraday bias neutral again. But outlook will remain bullish as long as 0.6372 support holds, in case of retreat.
In the bigger picture, there is no clear sign that down trend from 0.8006 (2021 high) has completed. Rebound from 0.5913 is seen as a corrective move. While stronger rally cannot be ruled out, outlook will remain bearish as long as 38.2% retracement of 0.8006 to 0.5913 at 0.6713 holds. Nevertheless, considering bullish convergence condition in W MACD, even in case of another fall through 0.5913, downside should be contained above 0.5506 (2020 low).
Trade Headlines, While Encouraging, Aren’t Especially Promising
So, here we are on July 1st. US equities are back at all-time highs. Most headlines credit the rebound to optimism around trade negotiations—hopes that deals will be struck before the July 9 deadline—and expectations that the Federal Reserve (Fed) could cut rates sooner rather than later. But this rally is mostly driven and shouldered by AI optimism – the rest remains uncertain.
The trade headlines, while encouraging, aren’t especially promising. The negotiations with Japan are bumpy. The Japanese, understandably, are reluctant to buy American rice, and as a result, they may soon receive a ‘reveal letter’ detailing the tariff rate they’ll be subjected to. As for the EU, talks are just as uncertain. European could accept 10% universal tariff but demand exceptions for key sectors like drugs, alcohol, chips, planes, cars, steel an aluminum that they might not get.
On the monetary policy front, Fed Chair Jerome Powell has been crystal clear: it’s not smart to rush to the exit when the implications of new tariffs on inflation and growth are still unknown. That warning was reinforced by last week’s core PCE data, which came in hotter than expected, suggesting that inflation may be making a U-turn—moving away from the 2% target. That means even if economic data on growth or jobs begins to weaken, the Fed is likely to prioritize tackling inflation first. Yet, this doesn’t seem fully priced into markets.
There’s a clear mismatch between how markets are positioned and the risks that remain on the table. Trade tensions, geopolitical uncertainty, the ballooning US debt burden, the possibility that the Fed might not be able to cut rates, signs of economic slowdown, and even a potential re-acceleration in inflation—none of these risks have disappeared. They’ve simply been pushed aside, priced in and out over recent months, but they persist.
Retail investors continue to drive the rally. The latest COT data shows that institutional demand has improved slightly, but still feels lukewarm. That’s understandable, given the trend in earnings expectations. According to FactSet, second-quarter S&P 500 earnings growth estimates have been revised down from 9.4% at the end of March to just 5%. That downgrade is barely reflected in market pricing, making the upcoming earnings season a potential minefield.
From here, the path forward is essentially a coin toss. In one scenario, trade deals are struck, everyone leaves the negotiating table happy, the Middle East finds peace, the US addresses its soaring debt, inflation slows, and economic growth accelerates. But if that doesn’t happen—and some of the risks materialize—markets could face a sharp reality check. Earnings could disappoint, macro data could weaken, trade deals could fall short or prove unsustainable, and US debt worries could resurface—especially given that the latest tax bill is expected to add $3 trillion to the federal deficit. That would require a ramp-up in debt issuance, which could push yields higher just as corporate profits come under pressure.
Investors vs CFOs
Investor sentiment may appear upbeat, but those making real-world business decisions are more cautious. A recent Teneo survey shows nearly 80% of investors expect the global economy to improve over the next six months. Yet 43% of global CFOs disagree. In fact, the majority of US CFOs expect interest rates to rise—not fall—over that same period. We can choose to ignore those views, but CFOs are decision-makers, and they’ve already started to act, slowing hiring and reassessing supply chains.
That said, one area continues to shine: AI. Strong capital expenditure is flowing into AI projects, with the aim of replacing labour, cutting costs, and boosting productivity. That could help tame inflation over the long run and support growth. Oracle announced a major cloud deal expected to bring in up to $30 billion annually from fiscal 2028. Its stock jumped 4% on the news. Meta also hit an all-time high on reports it plans to spend ‘hundreds of billions’ on projects and research. Nvidia continues to hover near record highs.
But beyond the AI sector, the broader macro picture remains fragile. All eyes are now on US labour market data this week. Job openings are due today, followed by the ADP employment report tomorrow and nonfarm payrolls, wage figures, and the unemployment rate on Thursday. Moderately soft figures may support expectations of Fed rate cuts and push equities even higher. But if the data is too weak, it could raise concerns about the economic impact of recent policy shifts, prompting some investors to lock in profits and head to the sidelines ahead of the slower summer months.
Meanwhile, the US dollar remains under pressure. The EURUSD touched the 1.18 level this morning after an unexpected dip in German inflation revived dovish European Central Bank (ECB) expectations. Today’s euro area aggregate inflation number is likely to land near the ECB’s 2% target, reinforcing the view that the central bank will remain accommodative. The euro outlook remains positive, but technically speaking, the RSI indicator points to overbought conditions. Deep bearish dollar positioning also suggests that some profit-taking could lead to a short-term correction before the euro resumes its march toward the 1.20 mark.
Elliott Wave Analysis: Nasdaq (NQ) Continues Bullish Cycle, Reaching New All-Time High
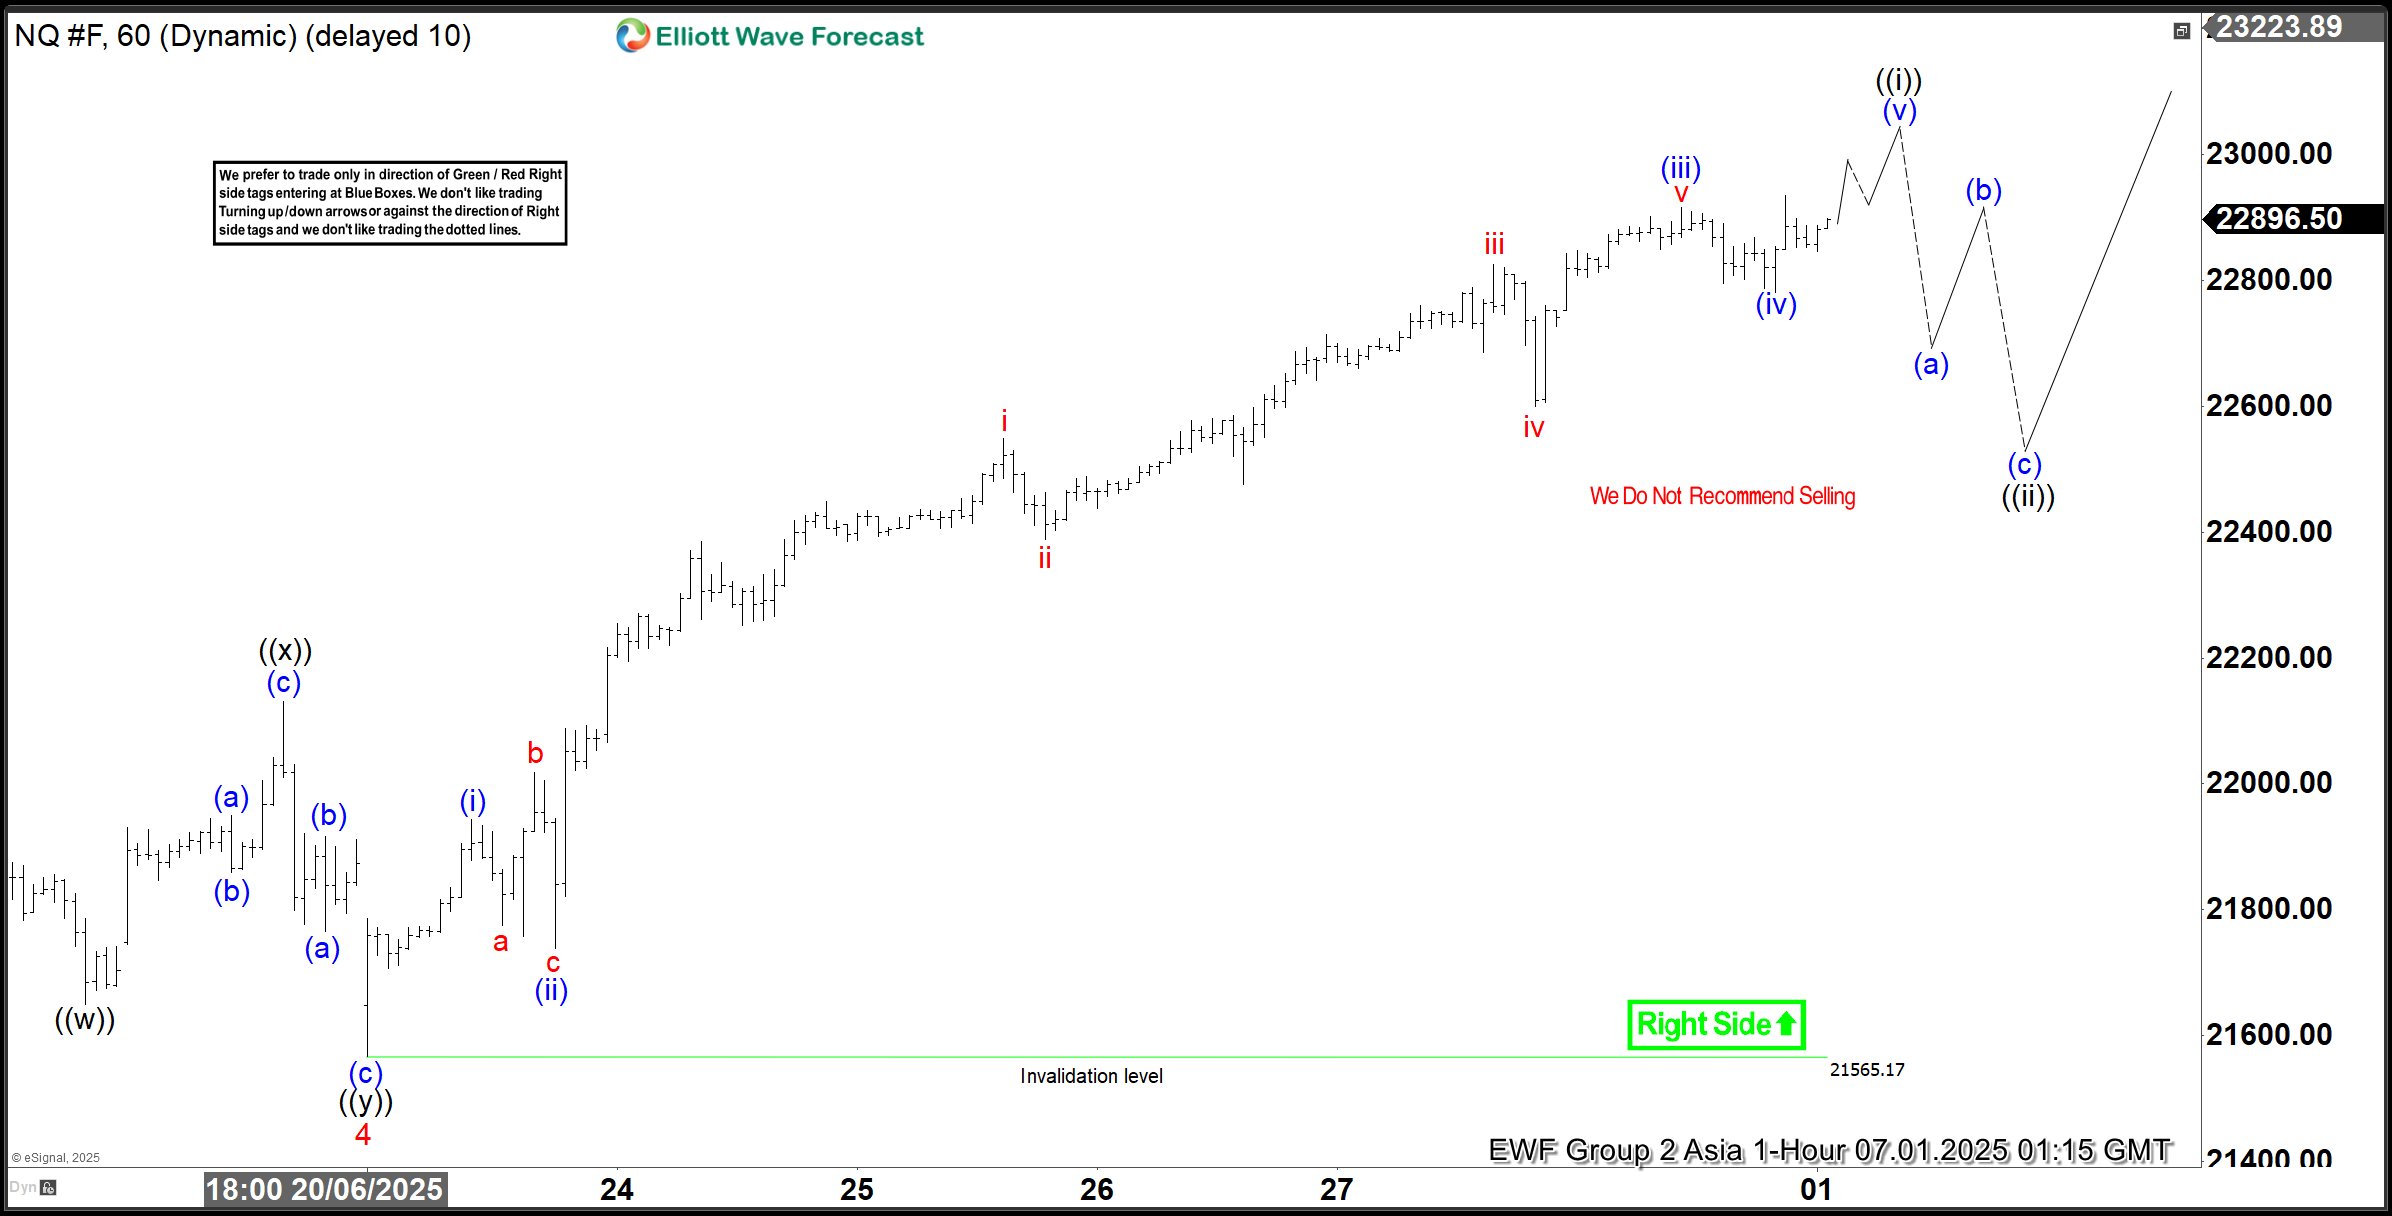
The Nasdaq (NQ) has surged to a new all-time high, reaffirming the strength of its ongoing bullish trend. The index established a significant low on April 7, 2025, at 16,460, following a sell-off triggered by tariff war concerns. This low marked a critical turning point, from which the Nasdaq embarked on a robust upward trajectory, unfolding in a five-wave impulse structure as per Elliott Wave analysis.
From the April 7 low, wave 1 peaked at 18,357.25. A corrective wave 2 then followed which bottomed at 16,735. The index then rallied in wave 3, reaching 22,222, before a shallow wave 4 pullback concluded at 21,565.17, as illustrated on the one-hour chart. Currently, wave 5 is in progress, exhibiting an internal impulse structure in a lesser degree. Within this wave 5, wave (i) topped at 21,944.25, with wave (ii) finding support at 21,738.25. Wave (iii) extended to 22,915, followed by a wave (iv) correction that ended at 22,781. The final wave (v) is expected to conclude soon, completing wave ((i)) of the higher-degree wave 5.
Looking ahead, a wave ((ii)) pullback is anticipated to correct the cycle from the June 23, 2025 low, likely unfolding in a 3, 7, or 11-swing pattern before the index resumes its ascent. In the near term, as long as the pivot low at 21,565.17 holds, any dips should find support in a 3, 7, or 11-swing structure, paving the way for further upside. This technical outlook underscores the Nasdaq’s resilience and potential for continued gains, provided key support levels remain intact.
Nasdaq 60-Minute Elliott Wave Technical Chart
Nasdaq (NQ) Elliott Wave Technical Video
https://www.youtube.com/watch?v=Q-iTH7DTc14
GBP/USD Eases — Could Bulls Reignite Momentum Soon?
Key Highlights
- GBP/USD extended gains above the 1.3720 resistance.
- A bullish continuation pattern is forming with resistance at 1.3725 on the 4-hour chart.
- EUR/USD started consolidating gains below the 1.1750 zone.
- Gold price dipped below the $3,320 and $3,300 support levels.
GBP/USD Technical Analysis
The British Pound started a fresh increase above the 1.3650 level against the US Dollar. GBP/USD cleared the 1.3700 zone to move further in a positive zone.
Looking at the 4-hour chart, the pair cleared many hurdles and bearish trend lines to climb above 1.3700. The bulls even pushed the pair above 1.3750. A high was formed near 1.3770 and the pair settled well above the 100 simple moving average (red, 4-hour) and the 200 simple moving average (green, 4-hour).
It is now consolidating gains below the 1.3750 zone. On the downside, immediate support is near the 1.3650 level. The next key support sits near 1.3620.
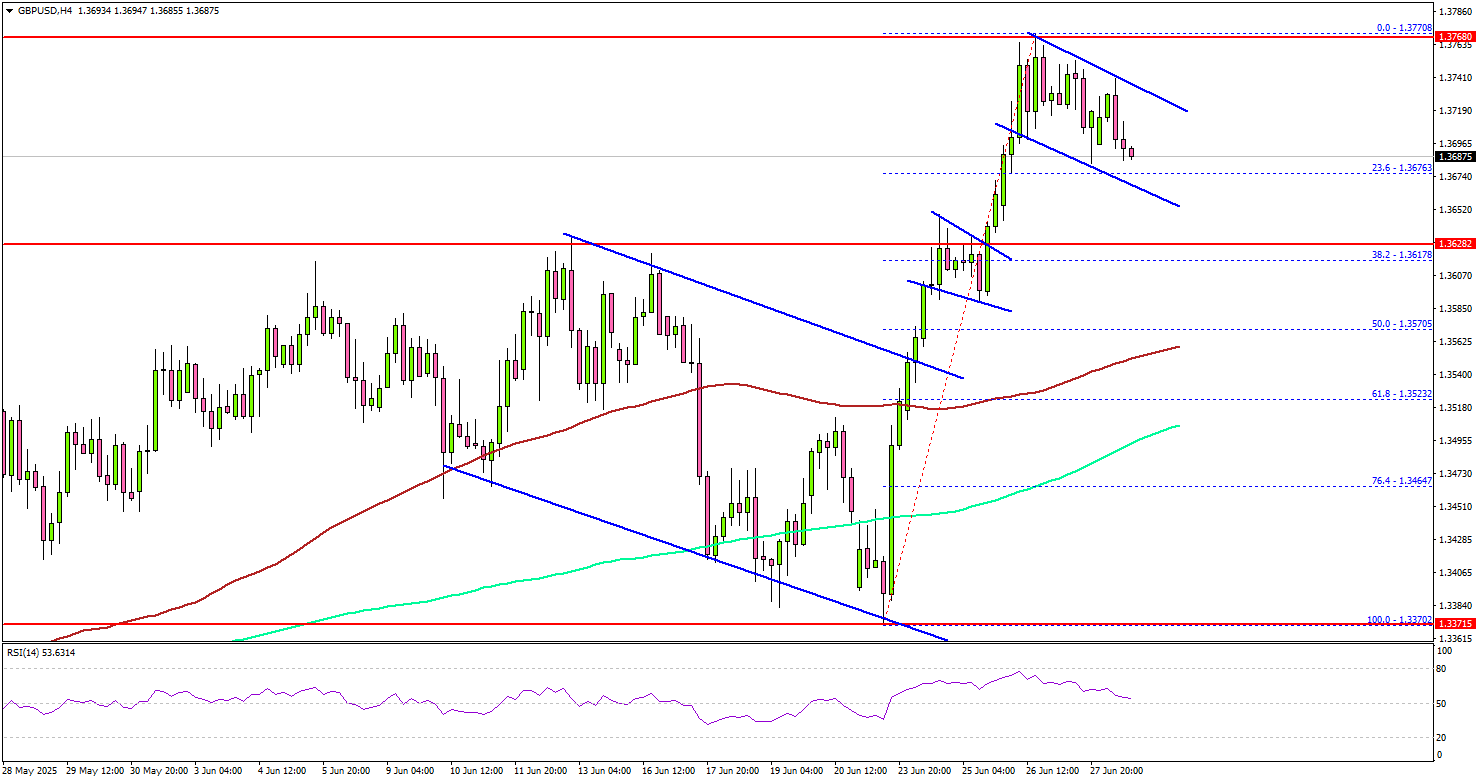
Any more losses could send the pair toward the 1.3570 support zone and the 100 simple moving average (red, 4-hour). Conversely, the pair could restart its increase after the current wave of correction.
On the upside, the pair could face resistance near the 1.3725 level. There is also a bullish continuation pattern forming with resistance at 1.3725 on the same chart. The next key resistance sits near the 1.3750 level.
The first major resistance sits at 1.3770. A close above the 1.3770 level could set the pace for another increase. In the stated case, the pair could even clear the 1.3800 resistance. The next major stop for the bulls could be near the 1.3880 resistance.
Looking at EUR/USD, the pair gained pace for an upside break above the 1.1650 and 1.1720 resistance levels. It is now consolidating gains and might start a downside correction.
Upcoming Economic Events:
- Euro Zone Manufacturing PMI for June 2025 – Forecast 49.4, versus 49.4 previous.
- UK Manufacturing PMI for June 2025 – Forecast 47.7, versus 47.7 previous.
- US ISM Manufacturing Index for June 2025 – Forecast 48.8, versus 48.5 previous.
China Caixin PMI manufacturing rises to 50.4, but optimism fades
China’s Caixin PMI Manufacturing rose to 50.4 in June from 48.3, topping expectations of 49.0 and marking a return to expansion territory. However, Wang Zhe of Caixin Insight cautioned that job losses persisted, external demand remained weak, and price pressures were subdued.
While the latest figures point to near-term stabilization, underlying risks remain elevated. Wang stressed that domestic demand has yet to see a fundamental turnaround and that businesses have grown less optimistic. With logistics and purchasing activity still soft, and global uncertainty intensifying, the sustainability of June’s rebound remains in question unless further policy support or demand recovery materializes.

Japan’s PMI manufacturing finalized at 50.1, demand still fragile
Japan’s Manufacturing PMI was finalized at 50.1 in June, rising from 49.4 in May. While production and employment ticked higher, underlying demand remained weak.
According to S&P Global’s Annabel Fiddes, firms reported continued declines in both domestic and overseas sales, reflecting the lingering impact of global uncertainty—particularly around US tariff policy.
Despite soft demand, business sentiment improved, encouraging firms to boost output and hiring. However, Fiddes emphasized that a "renewed and sustained improvement in customer demand" is still needed to drive a broader recovery.
Price pressures also "picked up slightly", with both input costs and selling prices rising above their long-term averages, suggesting inflationary risks remain embedded in supply chains.
BoJ Tankan signals resilience, keeps 2025 hike option alive
Japan’s Q2 Tankan survey showed business sentiment holding firm despite intensifying trade tensions. While today’s Tankan beat won’t trigger immediate action, it keeps the door open for a BoJ hike policy shift before year-end, especially if trade risks stabilize.
Large manufacturers posted a headline index of +13, beating expectations of 10, and reaching the highest level since December 2024. Their forward outlook for September came in at +12, also topping forecasts of 9. The services side was more mixed. Large non-manufacturers remained steady at +34, meeting expectations, but this marked a softening from prior readings, with the September outlook dipping to +27.
Still, capital expenditure plans surprised to the upside: large firms projected FY2025/26 capex to rise 11.5% (vs. 10.0% expected), while small firms were slightly less pessimistic than forecast. The investment data points to continued confidence in the domestic recovery.
Inflation expectations remained broadly stable. Firms anticipate CPI to rise 2.4% over both one-year and three-year horizons—unchanged to slightly lower from the previous survey.
Full BoJ Tankan survey release here.
NZIER survey shows NZ business confidence rising, inflation pressures easing
New Zealand business confidence improved modestly in Q2, with a net 22% of firms expecting better conditions ahead, up from 19% in Q1, according to NZIER’s quarterly survey.
Inflationary pressure appears to be cooling. 1% of firms reported price cuts in Q2, a sharp turnaround from the 8% that raised prices in Q1.
The report pointed to a continued "divergence between firms experiencing weak demand and firms expecting a recovery in demand", underlining an uneven domestic outlook despite improved sentiment.
NZIER said the effect of interest rate cuts since last August has yet to fully feed through to real activity, despite supporting sentiment.