
Sample Category Title
EUR/USD Mid-Day Outlook
Daily Pivots: (S1) 1.1682; (P) 1.1718; (R1) 1.1755; More...
EUR/USD is losing some upside momentum as seen in 4H MACD, but there is no clear sign of topping yet. Intraday bias stays mildly on the upside. Current rally should target 61.8% projection of 1.0176 to 1.1572 from 1.1064 at 1.1927. On the downside, below 1.1679 minor support will turn intraday bias neutral and bring consolidations. But downside should be contained above 1.1452 support to bring another rally.
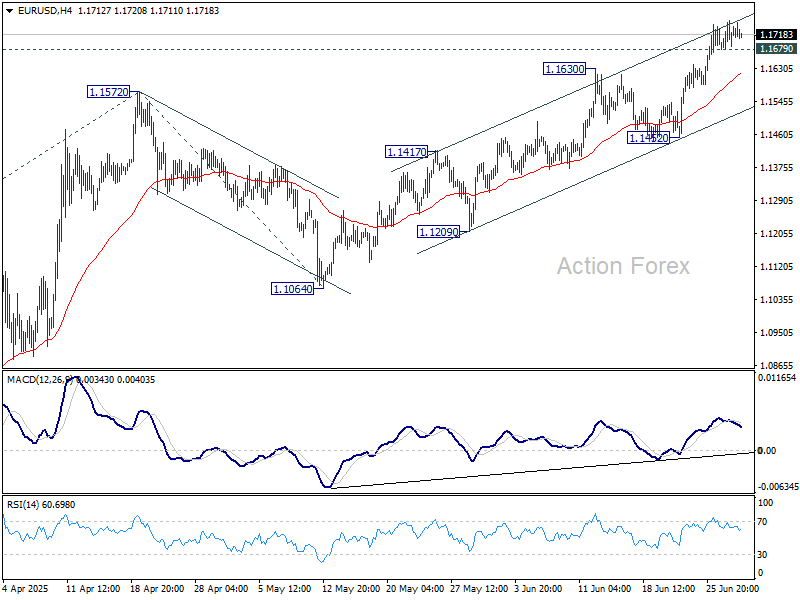
In the bigger picture, rise from 0.9534 long term bottom could be correcting the multi-decade downtrend or the start of a long term up trend. In either case, further rise should be seen to 100% projection of 0.9534 to 1.1274 from 1.0176 at 1.1916. This will now remain the favored case as long as 1.1604 support holds.
GBP/USD Mid-Day Outlook
Daily Pivots: (S1) 1.3684; (P) 1.3719; (R1) 1.3754; More...
GBP/USD is staying in consolidations below 1.3770 temporary top and intraday bias remains neutral at this point. Downside of retreat should be contained above 1.3369 support to bring another rally. Above 1.3770 will target 100% projection of 1.2099 to 1.3206 from 1.3138 at 1.3813.
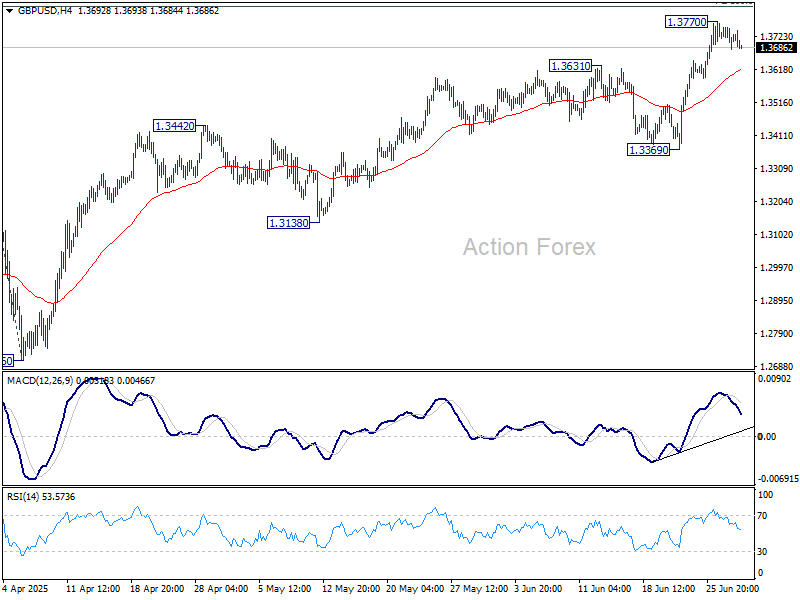
In the bigger picture, up trend from 1.3051 (2022 low) is in progress. Next medium term target is 61.8% projection of 1.0351 to 1.3433 from 1.2099 at 1.4004. Outlook will now stay bullish as long as 55 W EMA (now at 1.2960) holds, even in case of deep pullback.
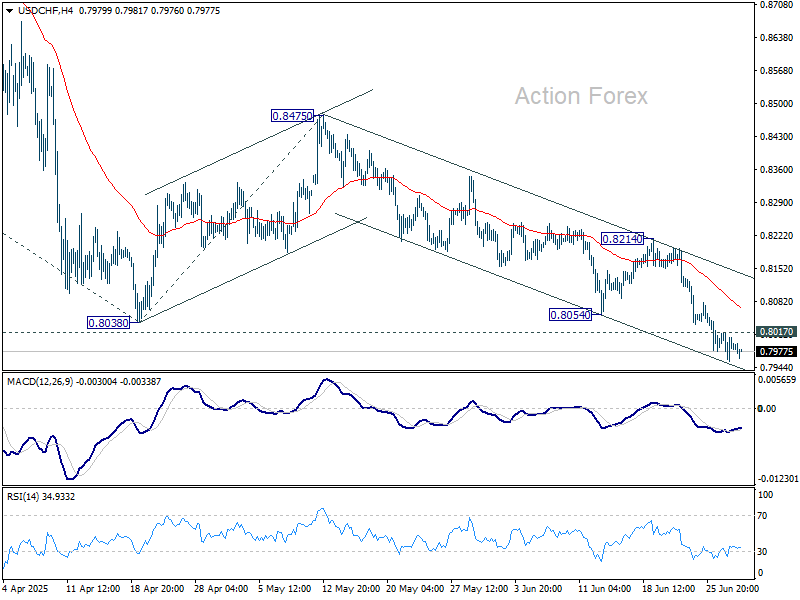
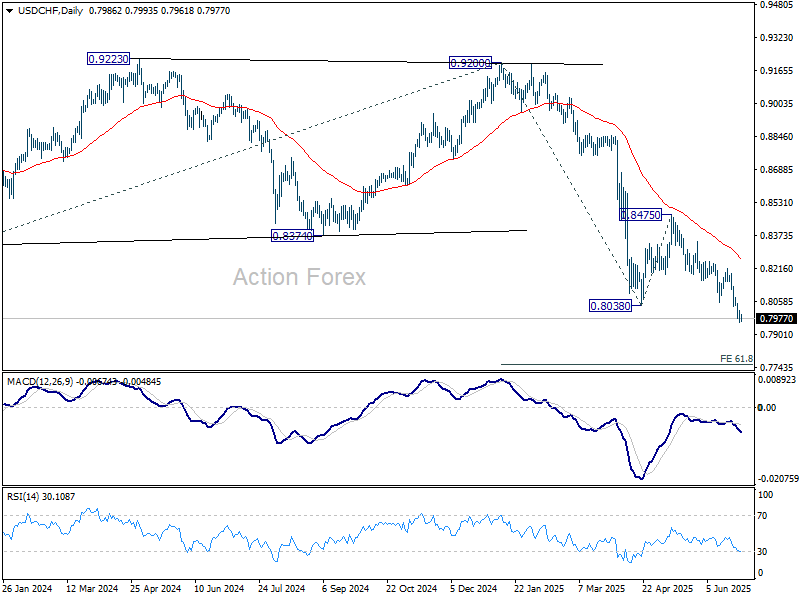
USD/CHF Mid-Day Outlook
Daily Pivots: (S1) 0.7959; (P) 0.7988; (R1) 0.8019; More….
While USD/CHF is losing some downside momentum as seen in 4H MACD, there is no clear sign of bottoming yet. Intraday bias stays mildly on the downside. Current down trend should target 61.8% projection of 0.9200 to 0.8038 from 0.8475 at 0.7757 next. On the upside, above 0.8017 minor resistance will turn intraday bias neutral and bring consolidations. But recovery should be limited below 0.8214 resistance to bring another fall.
In the bigger picture, long term down trend from 1.0342 (2017 high) is still in progress. Next target is 100% projection of 1.0146 (2022 high) to 0.8332 from 0.9200 at 0.7382. In any case, outlook will stay bearish as long as 0.8475 resistance holds.
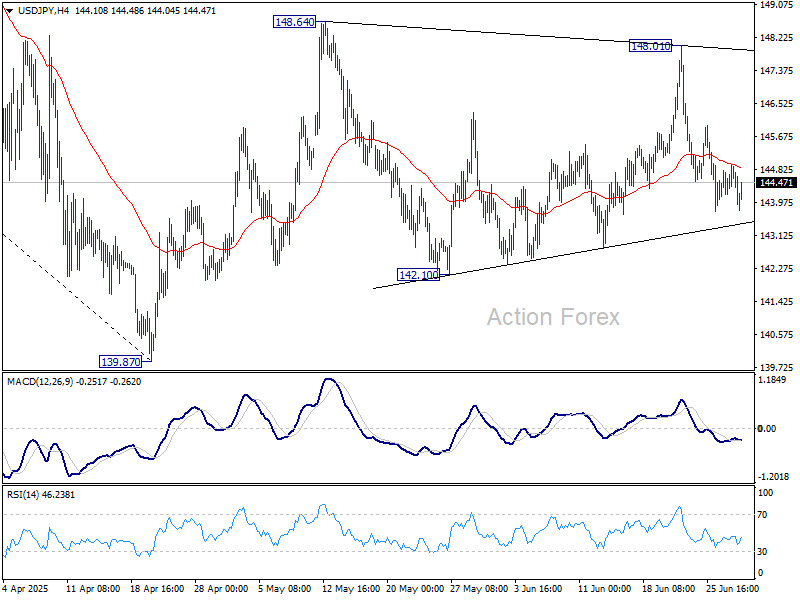
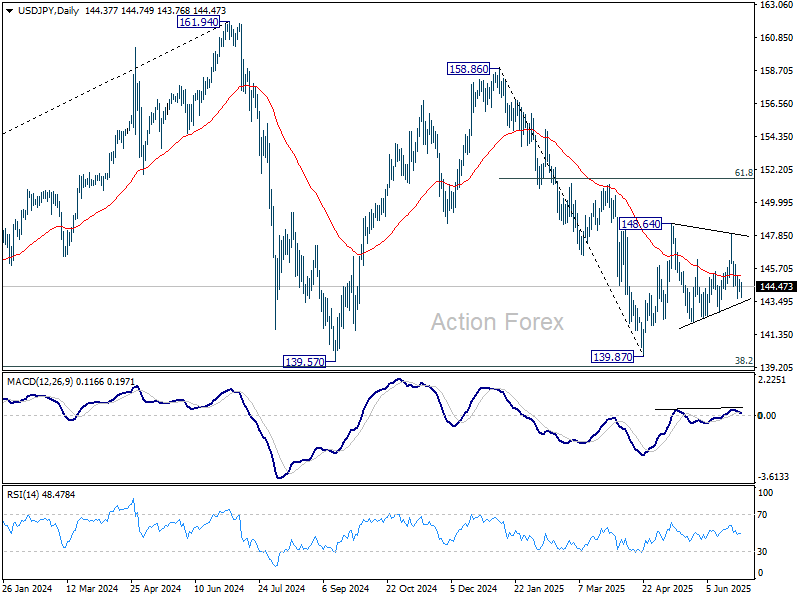
USD/JPY Mid-Day Outlook
Daily Pivots: (S1) 144.24; (P) 144.59; (R1) 145.01; More...
Intraday bias in USD/JPY stays neutral range trading continues inside 142.10/148.01. On the upside, firm break of 148.01 resistance will resume the rise from 139.87 to 61.8% retracement of 158.86 to 139.87 at 151.22. However, break of 142.10 will bring deeper fall back to retest 139.87 low.
In the bigger picture, price actions from 161.94 are seen as a corrective pattern to rise from 102.58 (2021 low), with fall from 158.86 as the third leg. Strong support should be seen from 38.2% retracement of 102.58 to 161.94 at 139.26 to bring rebound. However, sustained break of 139.26 would open up deeper medium term decline to 61.8% retracement at 125.25.
Quiet Market With Trade Tensions Simmering, Japan’s Tankan in Focus
Forex trading remains subdued and directionless, with most major pairs and crosses holding within Friday’s ranges. Traders appear to be in wait-and-see mode ahead of a packed US data schedule. The spotlight turns first to Tuesday’s ISM Manufacturing report, then to Thursday’s ISM Services and the highly anticipated non-farm payrolls. Until then, price action might continued to stay constrained within recent ranges.
On the trade front, Japan’s negotiator Ryosei Akazawa returned from his seventh round of talks in Washington without securing a clear path forward. US President Trump said he may move ahead with a 25% tariff on Japanese autos, even as Tokyo had requested a review of the measure. Akazawa said he remains committed to reaching an agreement while safeguarding Japan’s economic interests.
Yen leads performance today so far, but weak momentum suggests it's vulnerable to reverse. Swiss Franc and Kiwi also trade firmer. Sterling lags at the bottom, with Dollar and Aussie also soft. Euro and Canadian Dollar are trading in the middle of the board.
Focus will soon shift to the BoJ’s quarterly Tankan survey, due in the Asian session. The report will offer the first full snapshot of business sentiment following the latest round of US trade measures. Economists expect a modest deterioration in confidence among both manufacturing and service firms, with particular concern about weakening export demand.
Expectations for another BoJ rate hike this year have already faded in recent weeks. A weak Tankan report would reinforce this dovish repricing, especially as trade headwinds mount.
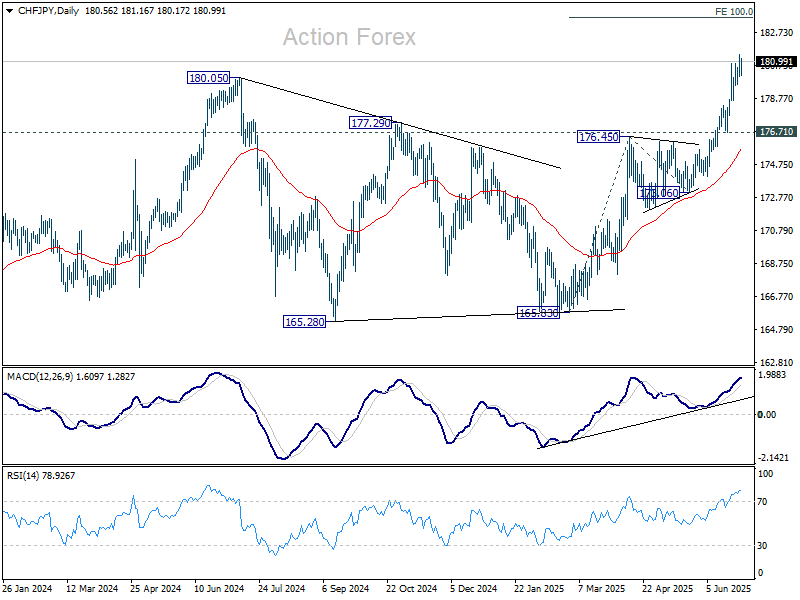
Technically, CHF/JPY's break of 180.05 resistance last week confirmed long term up trend resumption. Further rally should be seen to 100% projection of 165.83 to 176.45 from 173.06 at 183.68 next. Outlook will continue to stay bullish as long as 176.71 support holds, in case of retreat.
In Europe, at the time of writing, FTSE is down -0.19%. DAX is down -0.19%. CAC is up 0.05%. UK 10-year yield is down -0.019 at 4.487. Germany 10-year yield is down -0.01 at 2.582. Earlier in Asia, Nikkei rose 0.84%. Hong Kong HSI fell -0.87%. China Shanghai SSE rose 0.59%. Singapore Strait Times fell -0.05%. Japan 10-year JGB yield closed flat at 1.436.
Swiss KOF barometer Falls to 96.1, manufacturing outlook worsens
Switzerland’s KOF Economic Barometer dropped to 96.1 in June from 98.6, missing expectations of 99.3 and marking a renewed deterioration in growth momentum.
The decline reflects broad-based weakness across most underlying components, according to KOF, with the manufacturing sector highlighted as being “considerably under pressure.”
While the overall tone was negative, there was a slight offset from improved foreign demand indicators.
Japan’s industrial production rises 0.5% mom in May, far below expectation
Japan’s May industrial output came in far below expectations, rising just 0.5% mom versus the anticipated 3.4% mom growth. Though production improved in key sectors such as machinery and autos, five categories—led by non-auto transport equipment—recorded declines.
Shipments rose 2.2% mom, while inventories fell -1.9% mom, offering some positive signals, but not enough to shift the ministry’s cautious tone.
METI maintained its assessment that output “fluctuates indecisively”. A poll of manufacturers showed expectations for a muted 0.3% mom rise in June and a -0.7% mom drop in July.
China’s PMI manufacturing rises to 49.7, small firms lag
China’s official NBS PMI Manufacturing rose slightly to 49.7 in June, up from 49.5 and matching expectations. While still in contraction for a third straight month, the improvement in production (51.0) and new orders (50.2) suggests some stabilization in activity. Large manufacturers led the gains, with their PMI rising to 51.2, but conditions for small enterprises deteriorated sharply, with a 2-point drop to 47.3.
The Non-Manufacturing PMI also inched up to 50.5 from 50.3, supported by a rebound in construction activity. The construction business activity index rose to 52.8, while services slipped marginally to 50.1. Composite PMI rose to 50.7 from 50.4, reinforcing the picture of a subdued recovery.
NZ ANZ business confidence jumps to 46.3, but growth headwinds persist
Business confidence in New Zealand improved notably in June, with the ANZ headline index rising from 36.6 to 46.3 and firms’ Own Activity Outlook climbing from 34.8 to 40.9. Inflation expectations held steady at 2.71%.
ANZ warned that the underlying environment remains difficult, citing ongoing cost pressures, tight margins, and a global backdrop that continues to “impeding risk-taking”. The bank highlighted that while the 0.8% qoq Q1 growth was solid, the outlook for Q2 appears “not looking nearly so positive. Despite stronger sentiment, actual business conditions and demand may remain under pressure in the months ahead.
ANZ continues to forecast more rate cuts from the RBNZ than the central bank currently projects, arguing that the recovery will likely fall short of policymakers’ expectations. Still, it acknowledged that the RBNZ appears inclined to move slowly, balancing inflation risks with a softening economic backdrop.
USD/JPY Mid-Day Outlook
Daily Pivots: (S1) 144.24; (P) 144.59; (R1) 145.01; More...
Intraday bias in USD/JPY stays neutral range trading continues inside 142.10/148.01. On the upside, firm break of 148.01 resistance will resume the rise from 139.87 to 61.8% retracement of 158.86 to 139.87 at 151.22. However, break of 142.10 will bring deeper fall back to retest 139.87 low.
In the bigger picture, price actions from 161.94 are seen as a corrective pattern to rise from 102.58 (2021 low), with fall from 158.86 as the third leg. Strong support should be seen from 38.2% retracement of 102.58 to 161.94 at 139.26 to bring rebound. However, sustained break of 139.26 would open up deeper medium term decline to 61.8% retracement at 125.25.
Gold Bounces from One-Month Low But Recovery Still Hold Below Initial Barriers
Gold bounced from one-month low ($3247) on Monday, lifted by weaker dollar and partial profit-taking from 5% drop in past two weeks.
The yellow metal showed limited positive reaction on recent war between Israel and Iran but fell two full figures on announcement of ceasefire and signals of US-China trade deal, which contributed to strong drop in safe-haven demand.
Bears faced strong headwinds from thick daily Ichimoku cloud (cloud top lays at $3276) and has repeatedly contained dips (today / Friday) highlighting the significance of support.
However, recovery still lacks strength to clear first significant barriers at $3300 zone (14-d momentum is in negative territory / MA’s still in full bearish setup) that keeps the downside vulnerable.
Near-term action may hold in more quiet mode as markets await releases of key US labor reports (JOLTS / ADP / NFP) this week, which are expected to provide a fresh update about the situation in US labor sector and subsequently contribute to Fed’s rate decisions.
The latest positive signals from US-China trade deal may ease pressure, although tariffs are likely to remain the main obstacle, as the US central bank sees increased risk of fresh rise in consumer prices if Trump’s administration implements tariffs.
Bullish scenario – initial positive signal on clear break of $3300 zone, which will need verification on lift above $3325 (Fibo 38.2% of $3452/$3246 descend) and open way for possible stronger recovery.
Bearish scenario – the downside is expected to remain at risk if recovery repeatedly fails to clear $3300 zone, with repeated penetration of daily cloud and violation of recent low ($3247, also Fibo 61.8% of $3120/$3452) to risk deeper drop towards $3200 (psychological / Fibo 76.4%).
Res: 3300; 3325; 3350; 3373.
Sup: 3247; 3222; 3200; 3168.
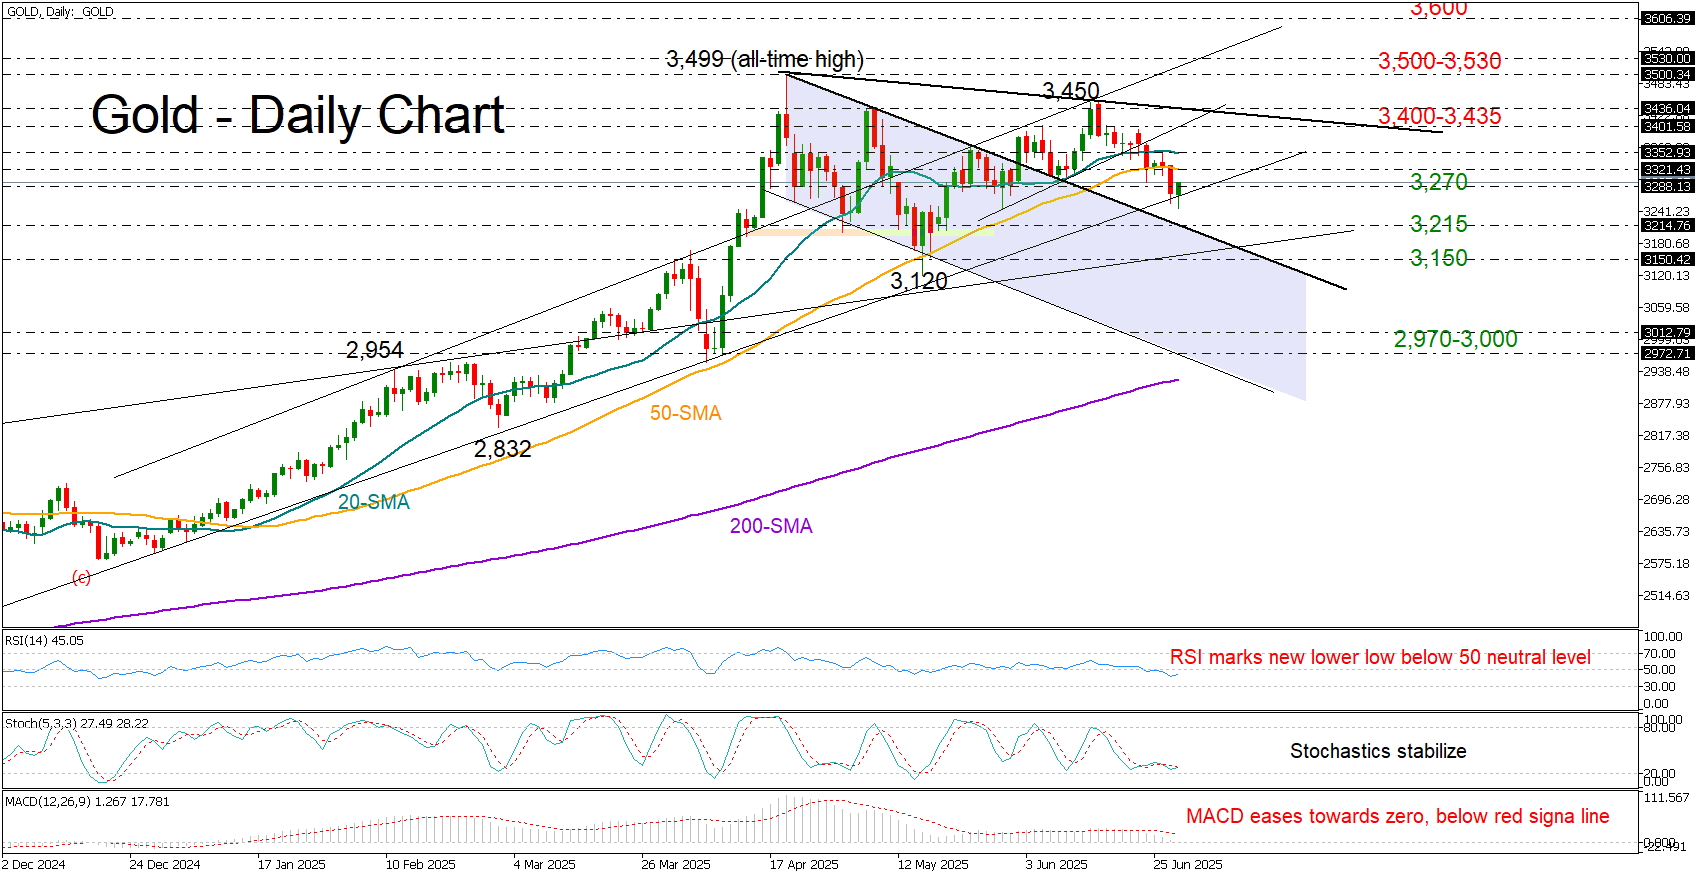
Cracks in Gold Rally? Not Just Yet
- Gold loses ground but remains supported near key pivot point.
- Technical signals deteriorate, sideways pattern intact above 3,150.
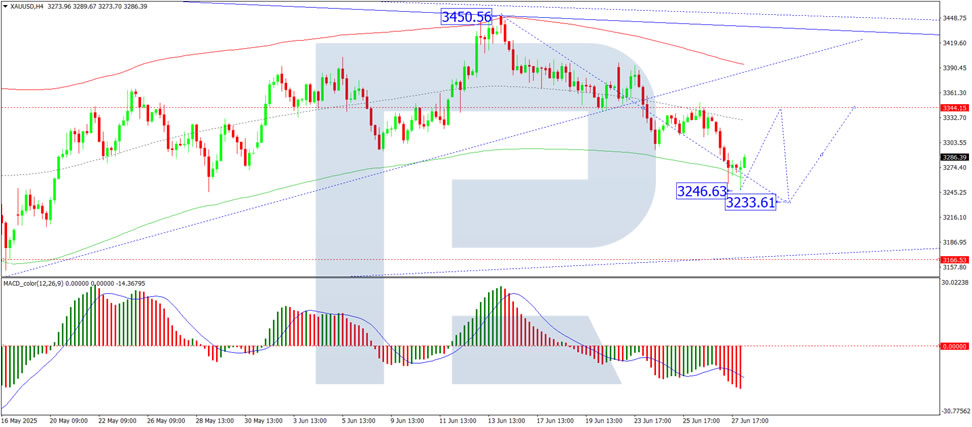
Gold extended its short-term decline below its 20- and 50-day simple moving averages (SMAs) after Federal Reserve Chair Jerome Powell questioned the case for a July rate cut during his semi-annual testimony before Congress last week. Additionally, recent U.S. data backed this narrative, revealing signs of rising inflationary pressures and a pullback in jobless claims.
Nevertheless, the support trendline drawn from December 2024 continues to act as a safety net around the 3,270 zone. This comes as the July 9 tariffs deadline approaches, with sticking points between the U.S. and its trade partners persisting – suggesting that agreements may take longer to finalize, or that quick solutions could leave key issues unresolved.
Technically, the risk remains tilted to the downside in the short-term picture given the weakening momentum in the RSI and MACD indicators. The RSI is printing new lower lows below its neutral 50 mark. If bearish pressure intensifies in the coming sessions, the price could retest the upper band of the former bearish channel at 3,215, followed by the rising support line from October 2024 at 3,150. A drop below that level could accelerate losses toward the psychological 3,000 mark, or even lower to 2,970.
On the upside, if strong catalysts push the precious metal back above its 20- and 50-day SMAs (currently at 3,320–3,350), the next challenge may pop up within the 3,400-3,435 area. A decisive close above that border could pave the way to 3,500, or test resistance near 3,530, before potentially targeting the 3,600 level.
In summary, gold has not completely lost its potential for a bullish reversal, despite the weakening technical indicators. Downside pressures may still encourage a "buy the dip" strategy, as long as the price holds within its sideways structure above 3,150.
S&P 500 Sets New All-Time High, Surges Above 6200
The S&P 500 index (US SPX 500 mini on FXOpen) started the week by reaching a fresh all-time high. As shown on the chart, the index hit 6,210 points earlier this morning.
In addition to a reduced risk of US involvement in a large-scale war in the Middle East, market optimism has been fuelled by:
→ Tariff-related news. Last week, the US President announced the signing of a trade deal with China, while Treasury Secretary Scott Bessent expressed hope that the US would conclude trade negotiations with over a dozen countries by early September.
→ Strong corporate performance. On Friday, Nike (NKE) shares led the stock market, rising by more than 15% following an earnings report that exceeded analysts’ expectations. This could be boosting investor sentiment ahead of the upcoming earnings season.
Technical Analysis of the S&P 500 Chart
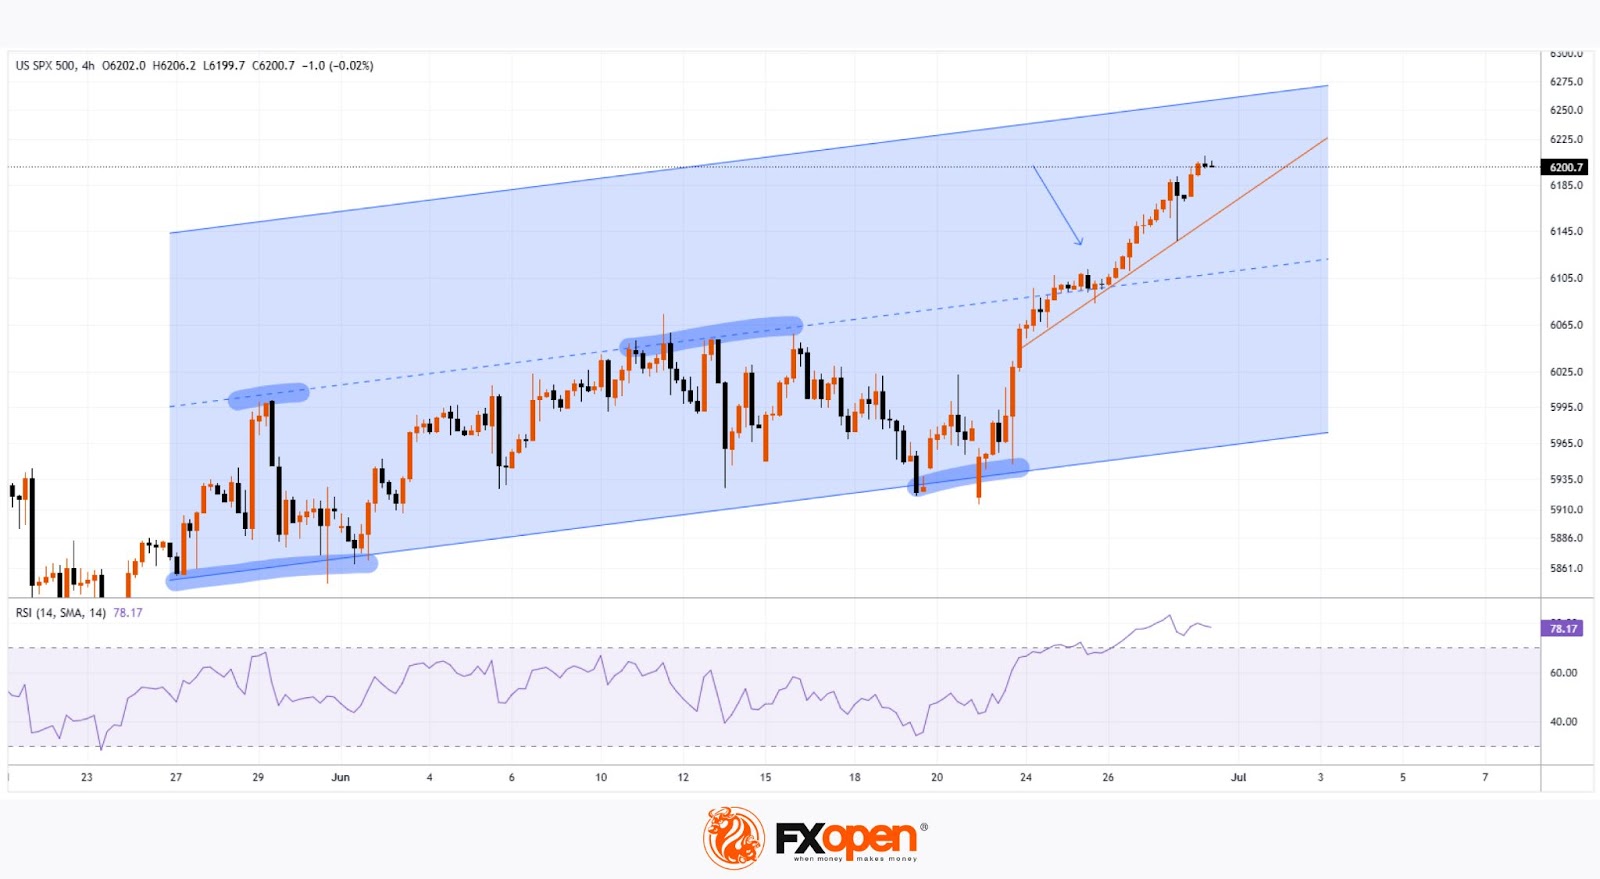
Evaluating the 4-hour chart of the S&P 500 index (US SPX 500 mini on FXOpen) in the context of June’s price movements reveals key reference points (marked on the chart) that outline an ascending channel. A consolidation zone, marked with an arrow, highlights a temporary equilibrium between supply and demand—after which buyers gained the upper hand, pushing the price upward.
It is possible that the ongoing bullish momentum could carry the price toward the upper boundary of the channel. However, attention should be paid to the RSI indicator, which suggests the market is heavily overbought; in fact, Friday’s reading marked the highest level of the year. In such conditions, a price correction cannot be ruled out—potentially back toward the local ascending trendline (shown in orange).
Trade global index CFDs with zero commission and tight spreads. Open your FXOpen account now or learn more about trading index CFDs with FXOpen.
This article represents the opinion of the Companies operating under the FXOpen brand only. It is not to be construed as an offer, solicitation, or recommendation with respect to products and services provided by the Companies operating under the FXOpen brand, nor is it to be considered financial advice.
XAU/USD Chart Analysis: Price Retreats to Monthly Low
In mid-June 2025, demand for gold surged following reports of exchanged strikes between Israel and Iran, along with US bombings of Iran's nuclear facilities. As a so-called safe-haven asset, gold prices climbed towards $3,430.
However, by the final day of June, the XAU/USD chart shows that gold had retreated to around $3,250, marking the lowest level in a month.
Why Is the Gold Price Falling?
On one hand, this reflects easing tensions in the Middle East, as a ceasefire—albeit fragile—between Israel and Iran remains in place.
On the other hand, the risk of trade wars is also diminishing. According to media reports:
→ President Donald Trump announced last week that the United States had signed a trade agreement with China and hinted that a “very major” deal with India would follow soon.
→ The US is also close to concluding agreements with Mexico and Vietnam, while negotiations with Japan and many other countries are ongoing.
Technical Analysis of the XAU/USD Chart
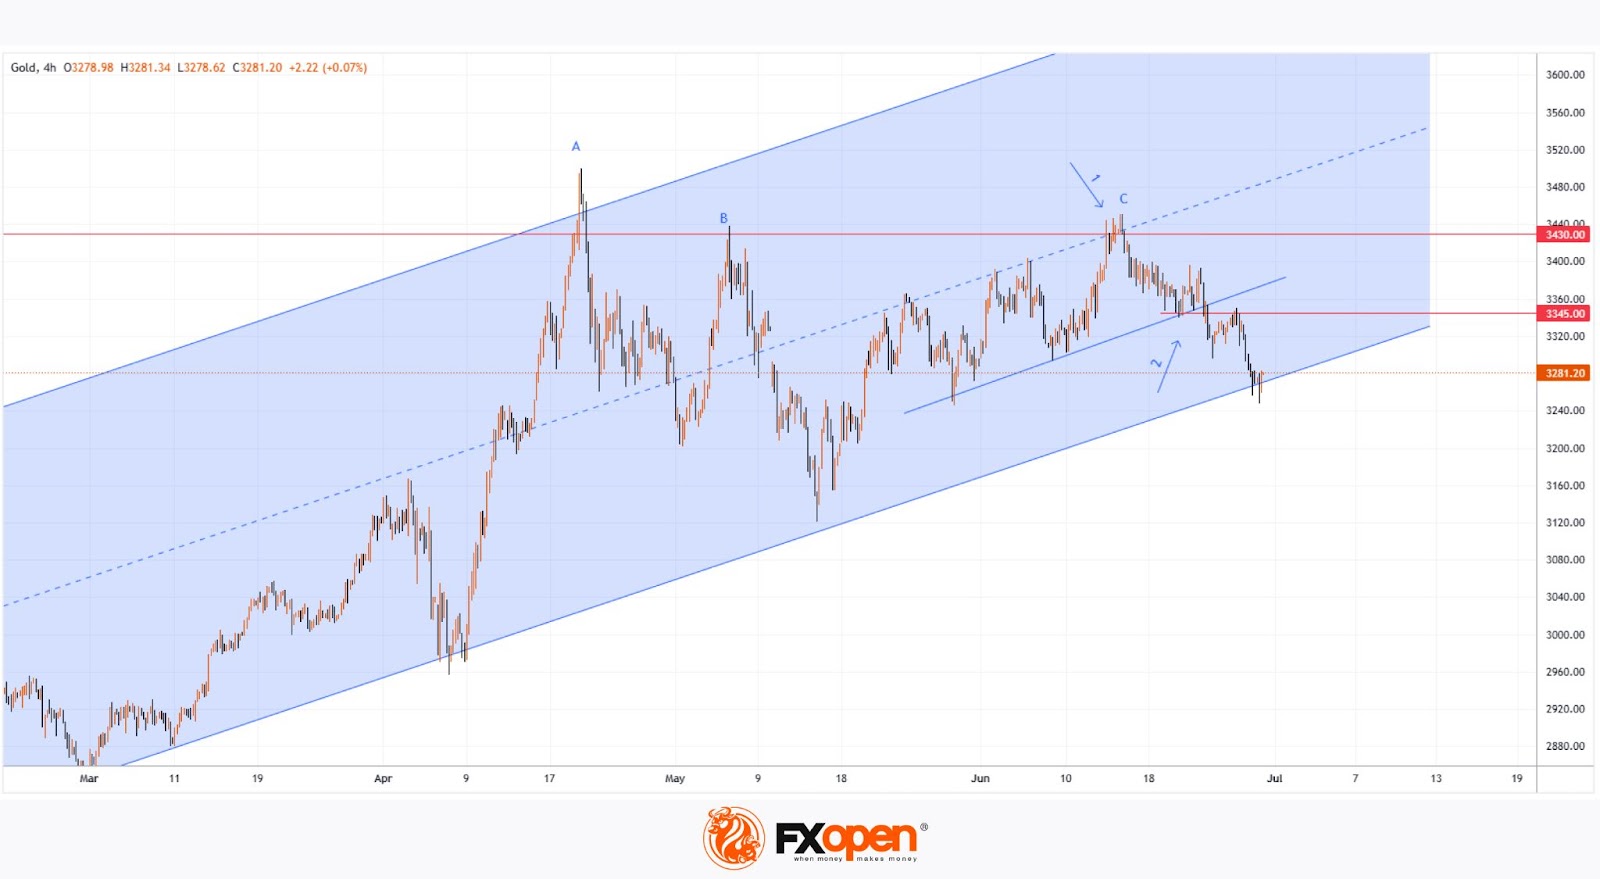
Looking at the broader picture, it is worth noting that gold prices in 2025 continue to move within a long-term upward channel (shown in blue), with the following key observations:
→ The channel’s median line acted as resistance (indicated by arrow 1);
→ The line dividing the lower half of the channel in half also showed signs of resistance (indicated by arrow 2).
Now, gold is trading near the lower boundary of the channel – a key support level within the multi-month uptrend. Demand may begin to strengthen here, with long lower wicks on candles on the lower timeframes supporting this view.
A rebound from the lower boundary is possible in early July, but how strong might it be? Note that bears have taken control of the $3,345 level (which has now flipped from support to resistance), and there are signs of a triple top pattern (A-B-C) forming near the $3,430 resistance. This raises the risk of a bearish breakout from the ascending channel.
Start trading commodity CFDs with tight spreads. Open your trading account now or learn more about trading commodity CFDs with FXOpen.
This article represents the opinion of the Companies operating under the FXOpen brand only. It is not to be construed as an offer, solicitation, or recommendation with respect to products and services provided by the Companies operating under the FXOpen brand, nor is it to be considered financial advice.
Gold Declines as Risk Appetite Improves
The price of gold fell to 3,280 USD per troy ounce on Monday, approaching its monthly low. The decline reflects reduced demand for safe-haven assets as geopolitical tensions ease and optimism grows over international trade developments.
Geopolitical tensions ease, trade optimism rises
In the Middle East, a fragile yet stable ceasefire between Israel and Iran remains in place, alleviating fears of a fresh escalation in regional conflict.
Meanwhile, trade sentiment improved after US President Donald Trump announced the conclusion of a trade agreement with China last week, alongside an upcoming major deal with India. Reports also indicate that Washington is nearing agreements with Mexico and Vietnam while negotiations continue with Japan and other countries. These developments have eased concerns about a deterioration in global trade relations, further dampening gold’s appeal.
Focus shifts to US economic data
Investor attention is now turning towards US macroeconomic indicators scheduled for release this week, including:
- Job vacancies data
- ADP employment report
- Non-farm payrolls index
These releases will offer insight into the Federal Reserve’s future monetary policy decisions.
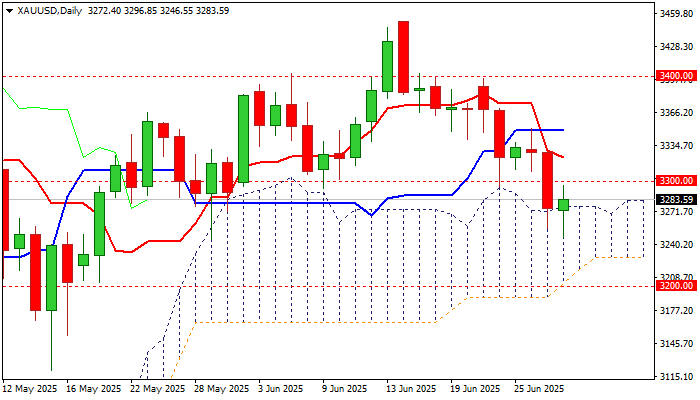
Technical analysis of XAU/USD
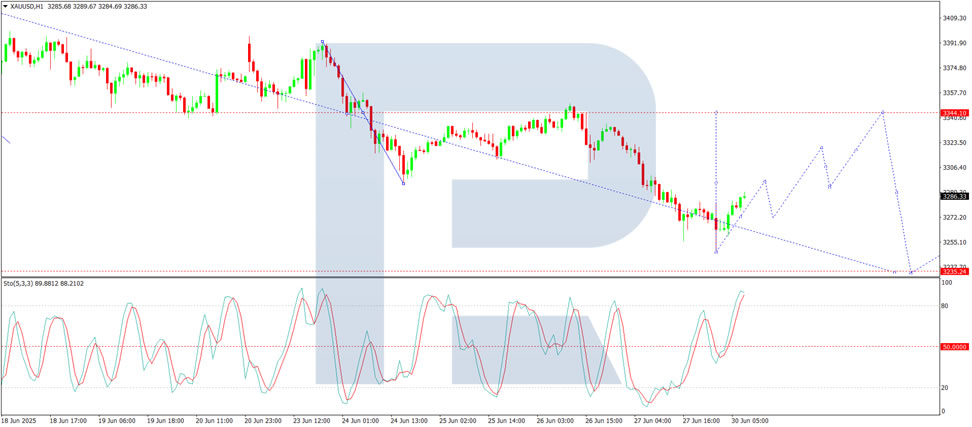
On the H1 chart, gold has begun a correction towards 3,297 USD. A subsequent drop to 3,270 USD cannot be ruled out. The market is forming a consolidation range around 3,270 USD. Should an upward breakout occur from this range, the correction could extend to 3,319 USD, with the upward wave potentially continuing towards 3,344 USD (testing from below). The Stochastic oscillator confirms this outlook, with its signal line above 50 and moving sharply towards 80, indicating short-term upward momentum within the correction phase.
Conclusion
Gold remains under pressure as geopolitical risks recede and trade optimism rises, diminishing its safe-haven appeal. Technical indicators suggest a likely correction towards 3,344 USD before further downside towards 3,233 USD. In the short term, market sentiment will remain tied to upcoming US employment data and its implications for the Fed’s policy trajectory.