
Sample Category Title
EUR/GBP Daily Outlook
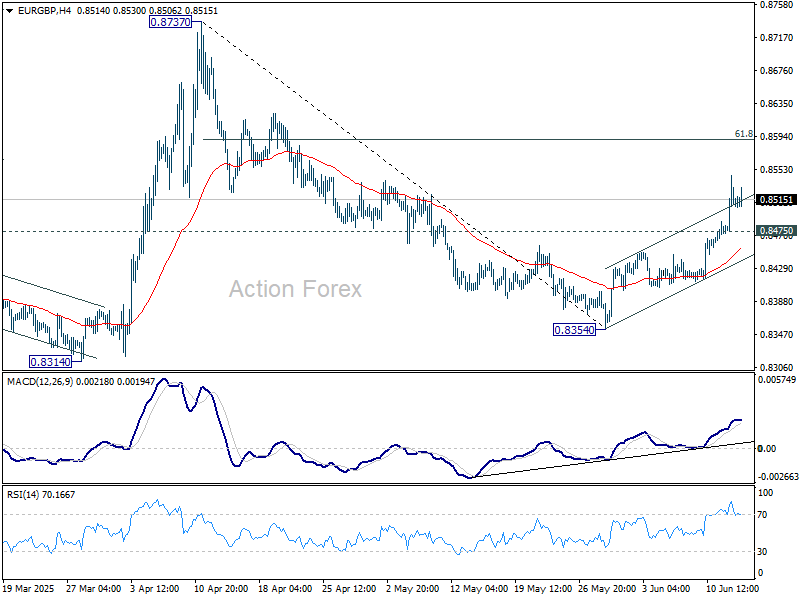
Daily Pivots: (S1) 0.8474; (P) 0.8511; (R1) 0.8546; More...
Intraday bias in EUR/GBP remains on the upside for the moment. Current rebound from 0.8354 is in progress for 61.8% retracement of 0.8737 to 0.8354 at 0.8591. Firm break there will pave the way to 0.8373 resistance. On the downside, below 0.8475 minor support will turn intraday bias neutral first.
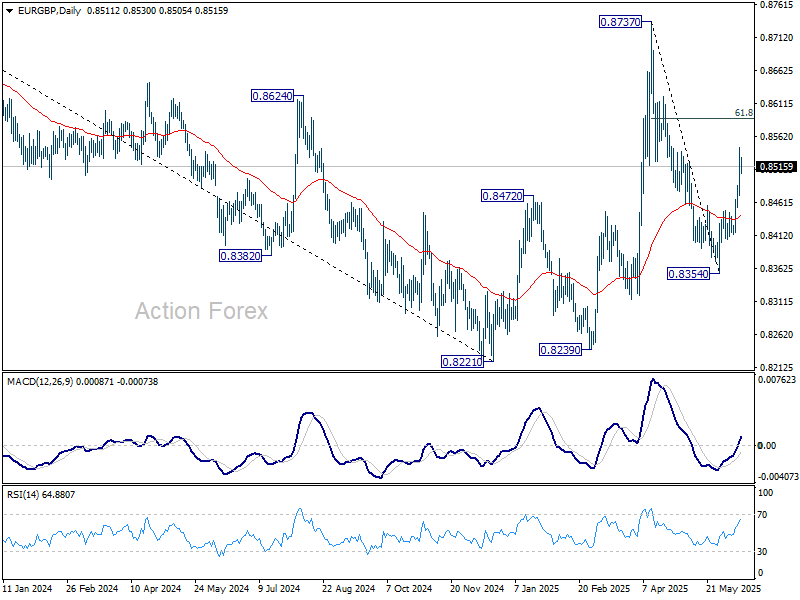
In the bigger picture, price actions from 0.8221 medium term bottom are merely forming a corrective pattern. Nevertheless, there is no clear momentum to break through 0.8201 key support (2022 low) yet. Hence, range trading is expected between 0.8221/8737 for now.
EUR/AUD Daily Outlook
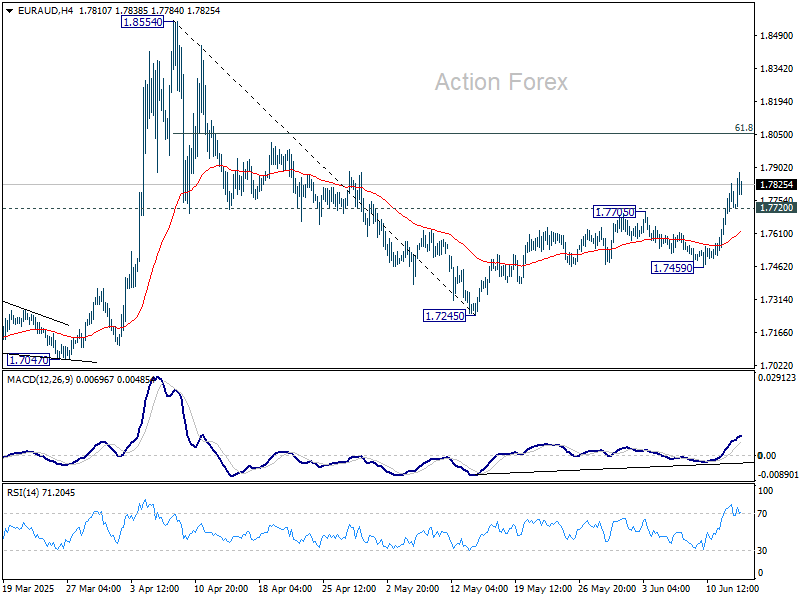
Daily Pivots: (S1) 1.7648; (P) 1.7740; (R1) 1.7828; More...
Intraday bias in EUR/AUD remains on the upside at this point. Rebound from 0.7245 is in progress for 61.8% retracement of 1.8554 to 1.7245 at 1.8054. Firm break there will pave the way to 1.8554. On the downside, below 1.7720 minor support will turn intraday bias neutral again first.
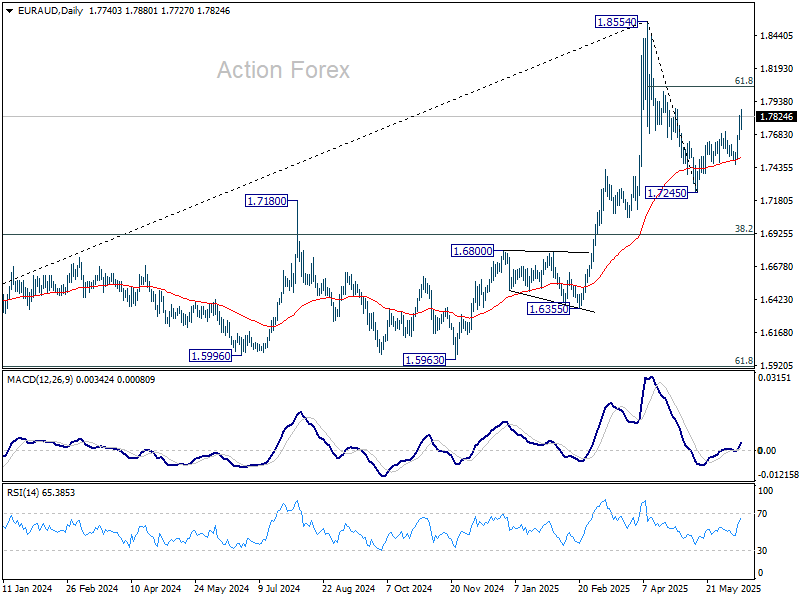
In the bigger picture, with 55 W MACD staying well below signal line, 1.8554 is likely a medium term top already. Price actions from there are seen as a corrective pattern only. While deeper pullback might be seen, downside should be contained by 38.2% retracement of 1.4281 (2022 low) to 1.8554 at 1.6922 to bring rebound. Up trend from 1.4281 is still expected to resume at a later stage.
EUR/CHF Daily Outlook
Daily Pivots: (S1) 0.9372; (P) 0.9402; (R1) 0.9417; More....
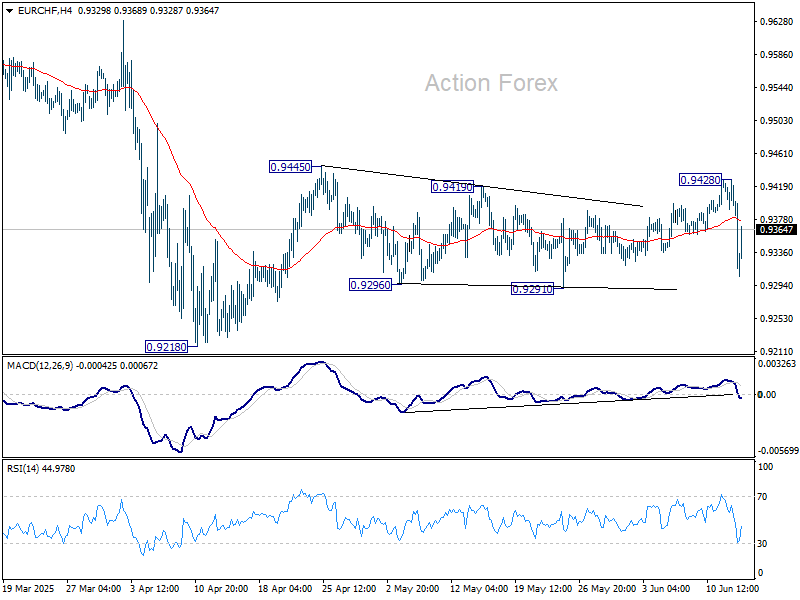
EURCHF reversed after hitting 0.9428 but recovered quickly ahead of 0.9291 support Intraday bias is turned neutral first. On the upside, break of 0.9428 will resume the rebound from 0.9218 through 0.9445 resistance. However, break of 0.9291 will bring retest of 0.9218 instead.
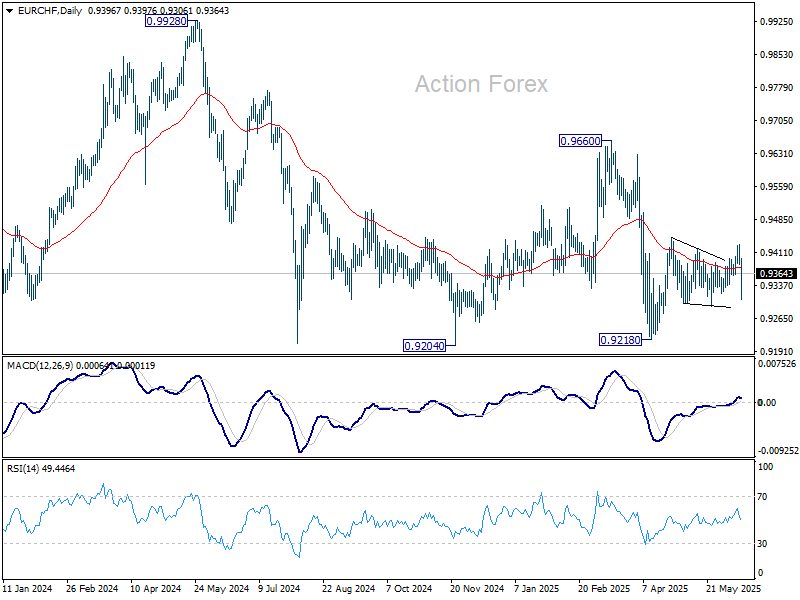
In the bigger picture, prior rejection by long-term falling channel resistance (now at 0.9527) retains medium term bearishness. That is, down trend from 1.2004 (2018 high) is still in progress. Firm break of 0.9204 (2024 low) will confirm resumption. This will remain the favored case as long as 0.9660 resistance holds.
AUD/USD Daily Report
Daily Pivots: (S1) 0.6495; (P) 0.6515; (R1) 0.6552; More...
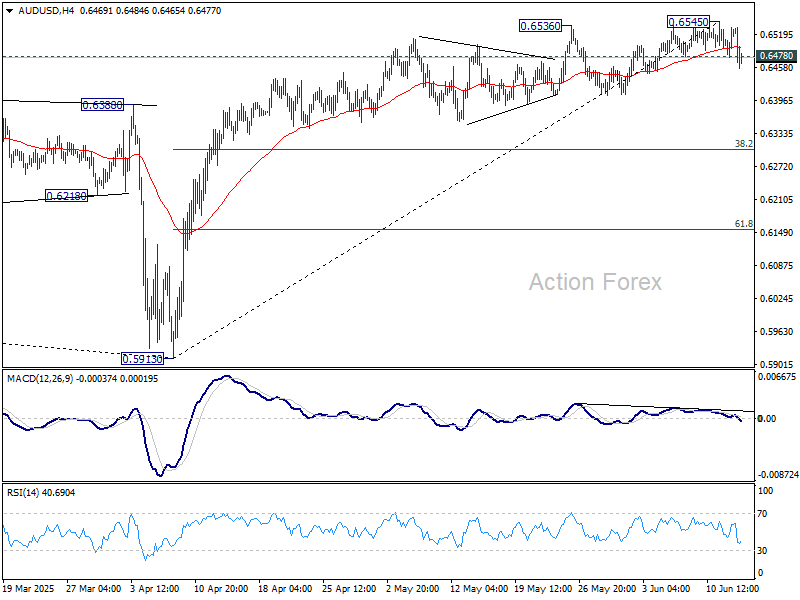
AUD/USD's break of 0.6478 support indicates short term topping at 0.6545, on bearish divergence condition in 4H MACD. Intraday bias is back on the downside for 55 D EMA (now at 0.6416). Firm break there will target 38.2% retracement of 0.5913 to 0.6545 at 0.6304. On the upside, break of 0.6545 will resume the rise from 0.5913 instead.
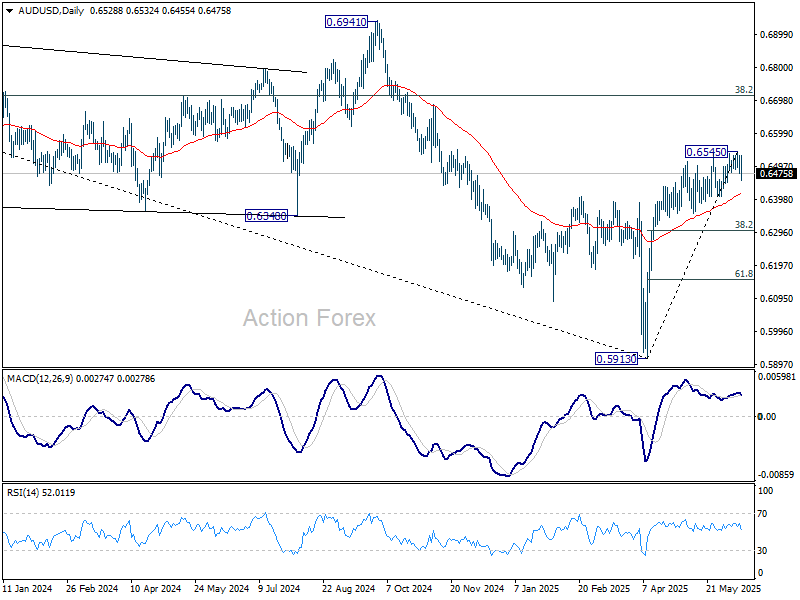
In the bigger picture, AUD/USD is still struggling to sustain above 55 W EMA (now at 0.6443) cleanly, and outlook is mixed. Sustained trading above 55 W EMA will indicate that rise from 0.5913 is at least correcting the down trend from 0.8006 (2021 high), with risk of trend reversal. Further rise should be seen to 38.2% retracement of 0.8006 to 0.5913 at 0.6713. However, rejection by 55 W EMA will revive medium term bearishness for another fall through 0.5913 at a later stage.
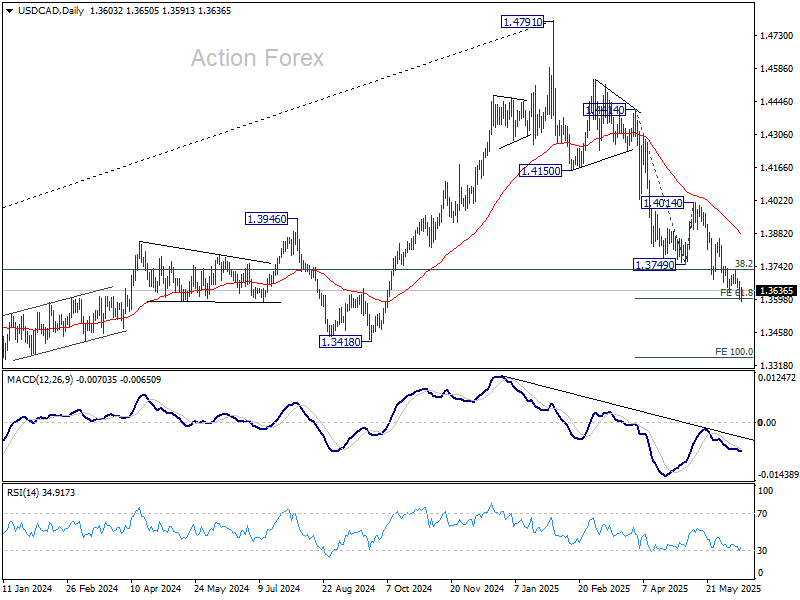
USD/CAD Daily Outlook
Daily Pivots: (S1) 1.3576; (P) 1.3626; (R1) 1.3653; More...
Intraday bias in USD/CAD remains on the downside at this point. Decisive break of 61.8% projection of 1.4414 to 1.3749 from 1.4014 at 1.3603 will pave the way to 100% projection at 1.3349. On the upside, through, break of 1.3727 resistance will turn bias back to the upside for stronger rebound.
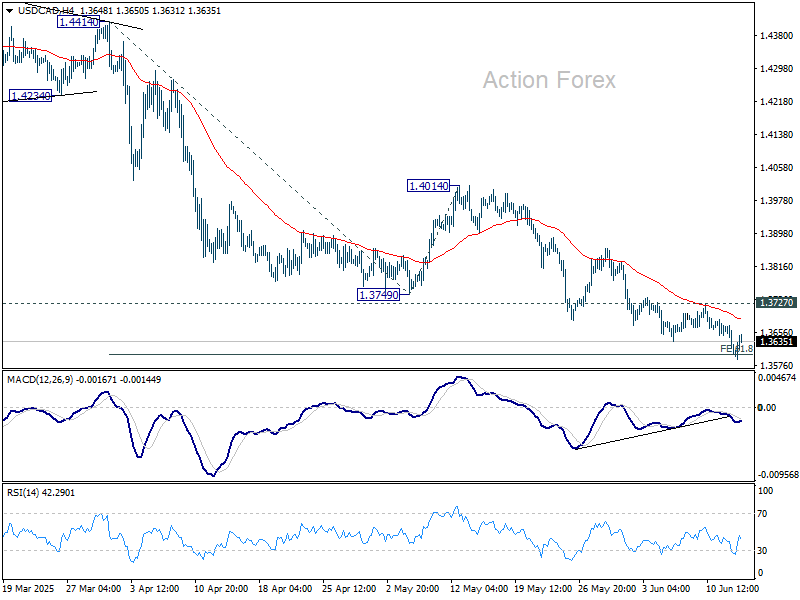
In the bigger picture, price actions from 1.4791 medium term top could either be a correction to rise from 1.2005 (2021 low), or trend reversal. In either case, further decline is expected as long as 1.4014 resistance holds. Firm break of 38.2% retracement of 1.2005 (2021 low) to 1.4791 at 1.3727 will pave the way back to 61.8% retracement at 1.3069.
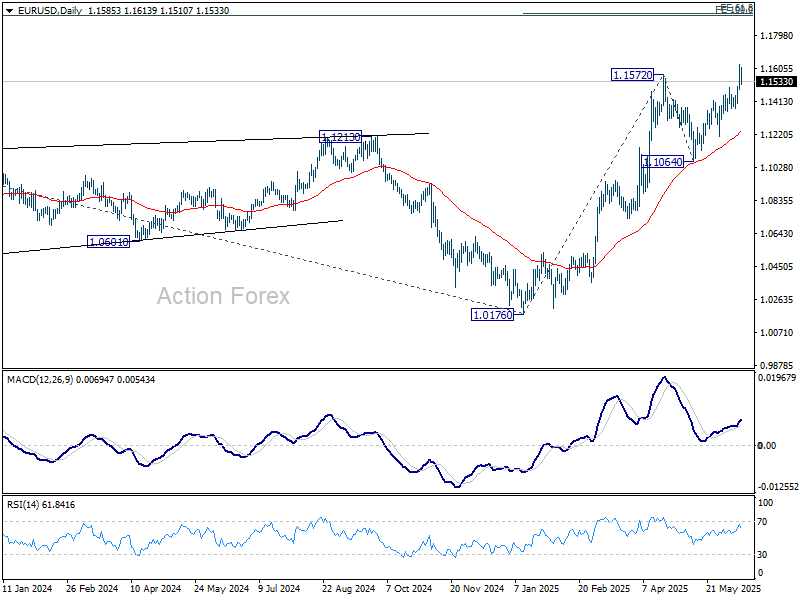
EUR/USD Daily Outlook
Daily Pivots: (S1) 1.1503; (P) 1.1567; (R1) 1.1649; More...
Intraday bias in EUR/USD is turned neutral first with current retreat. Further rally is expected as long as 1.1372 support holds. Above 1.1630 will resume the rally from 1.0176 to 61.8% projection of 1.0176 to 1.1572 from 1.1064 at 1.1927. However, break of 1.1372 support will indicate short term topping, and turn bias to the downside for deeper pullback.
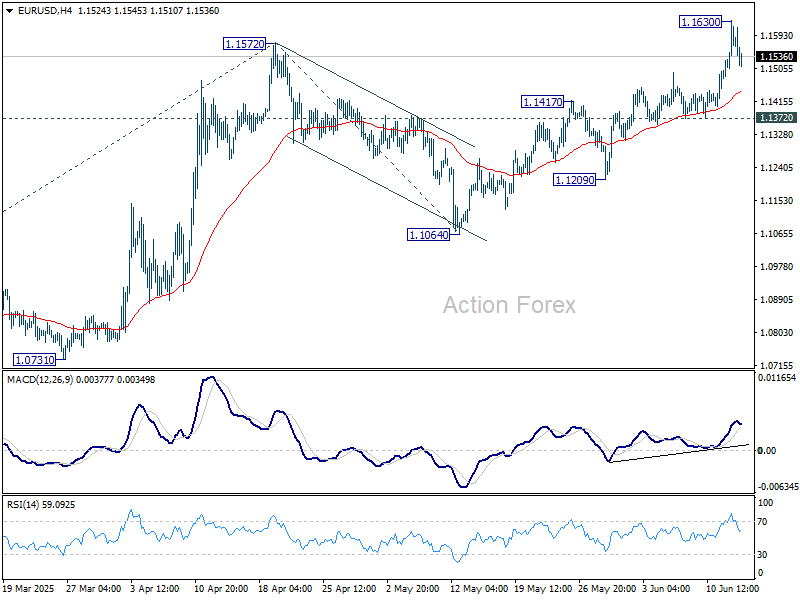
In the bigger picture, rise from 0.9534 long term bottom could be correcting the multi-decade downtrend or the start of a long term up trend. In either case, further rise should be seen to 100% projection of 0.9534 to 1.1274 from 1.0176 at 1.1916. This will now remain the favored case as long as 1.1604 support holds.
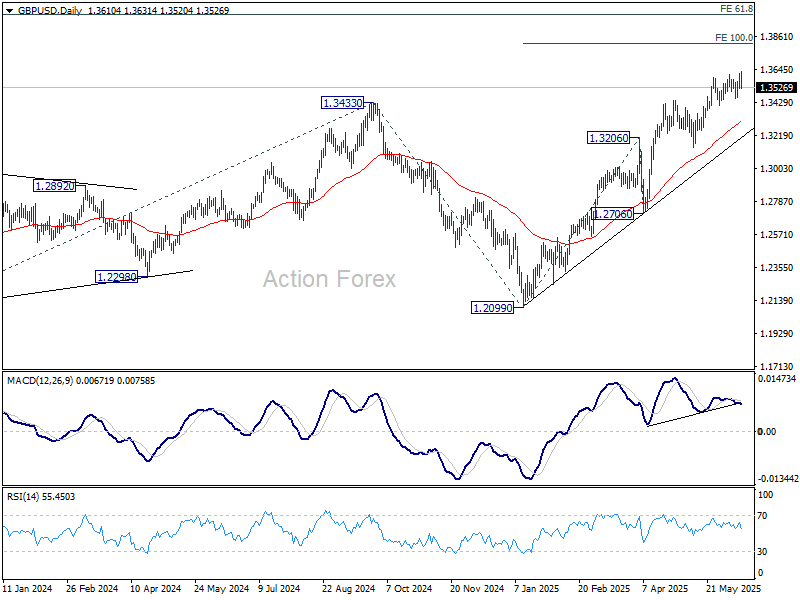
GBP/USD Daily Outlook
Daily Pivots: (S1) 1.3549; (P) 1.3587; (R1) 1.3650; More...
GBP/USD edged higher to 1.3631 but quickly retreated. Intraday bias remains neutral first. Firm break of 1.3631 will resume the rally from 1.2099 and target 100% projection of 1.2099 to 1.3206 from 1.3138 at 1.3813. On the downside, break of 1.3455 support should confirm short term topping, and bring deeper correction to 55 D EMA (now at 1.3309) instead.
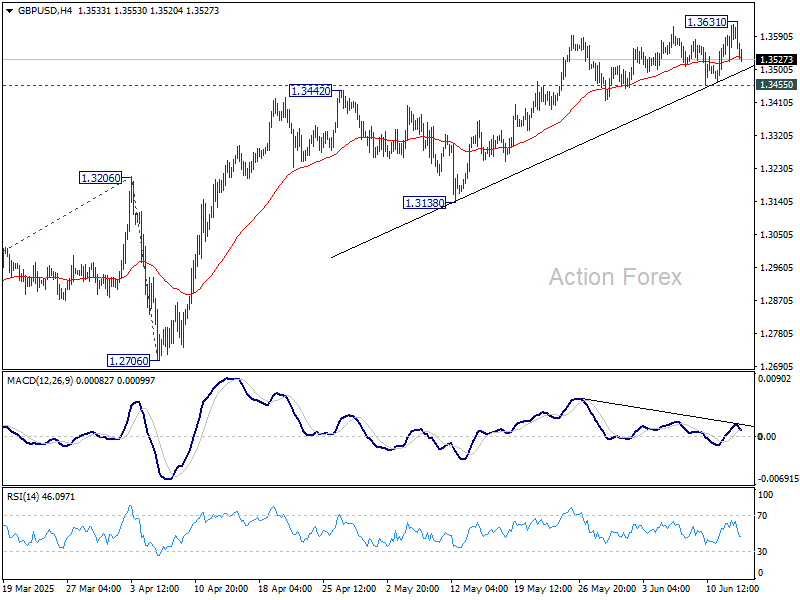
In the bigger picture, up trend from 1.3051 (2022 low) is in progress. Next medium term target is 61.8% projection of 1.0351 to 1.3433 from 1.2099 at 1.4004. Outlook will now stay bullish as long as 55 W EMA (now at 1.2913) holds, even in case of deep pullback.
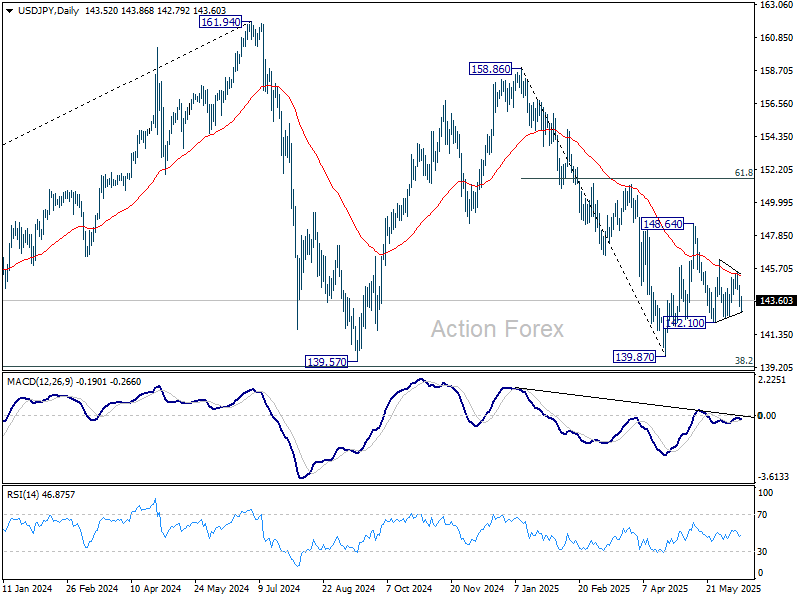
USD/JPY Daily Outlook
Daily Pivots: (S1) 142.94; (P) 143.75; (R1) 144.32; More...
Intraday bias in USD/JPY remains neutral as sideway trading continues. On the downside, break of 142.10 support will resume the fall from 148.64 to retest 139.87 low. On the upside, above 145.46 will turn bias to the upside for 146.27 first. Firm break there will target 148.64 resistance.
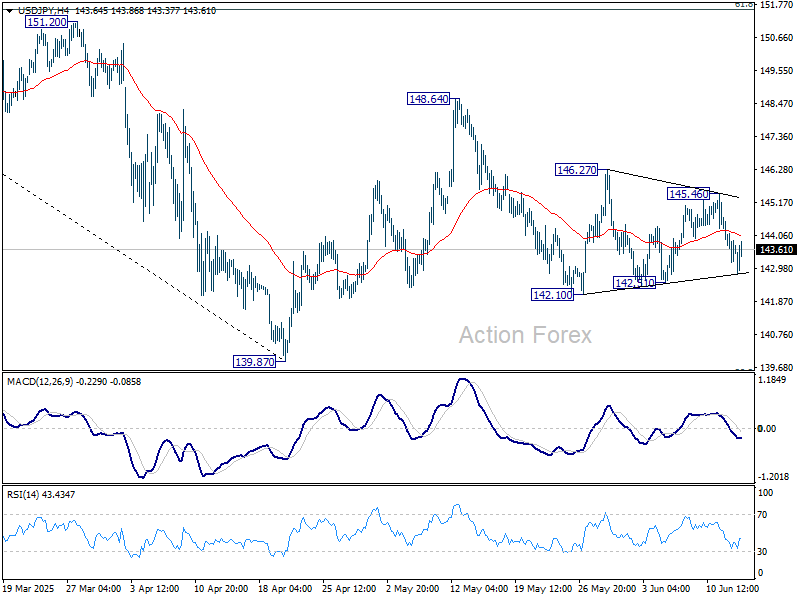
In the bigger picture, price actions from 161.94 are seen as a corrective pattern to rise from 102.58 (2021 low), with fall from 158.86 as the third leg. Strong support should be seen from 38.2% retracement of 102.58 to 161.94 at 139.26 to bring rebound. However, sustained break of 139.26 would open up deeper medium term decline to 61.8% retracement at 125.25.
Oil Prices Surged More Than 13% at Some Point
Markets
Add trade uncertainty, geopolitical tensions and underwhelming economic data in a bowl, mix it and top it off with solid demand for one of the most closely watched long-term US bond auctions in recent history. The outcome: significantly lower core bond yields. US yields fell another 4.4-7.6 bps in a bull flattening move yesterday. Optimism, if any, after the US and China reinstated the Geneva trade truce quickly faded after Trump’s renewed threat to impose unilateral trade tariffs in two weeks or so. On the geopolitical front, tensions with Iran are running increasingly high. Suspense has been growing over the last couple of days and culminated in Israel bombing Iranian nuclear facilities overnight. Two top military commanders were killed along with several prominent scientists. Iran already started a retaliatory response. Oil prices surged more than 13% at some point. Brent pared some of those gains but still trades around $75/b, the highest since early April. Around a month ago, Brent was struggling not to drop below $60/b. Yesterday’s economic data included slower than expected PPIs and an unexpected increase in jobless claims to 248k. Both of secondary importance but coming after the slight miss in the CPI the day before nevertheless picked up as an argument for some bond buying. And then finally the 30-year US bond sale. Demand was solid and the auction stopped through the WI yield, triggering some kind of a relief rally on the part of the curve that represents all the kinds of US risk markets need to deal with lately: inflation, public finances, growth, institutional. German bunds attracted a (safe haven) bid too, pushing yields down 2.9-7.3 bps in a similar bull flattener. Dollar weakness lifted EUR/USD towards the highest level since 2021 north of 1.16 before paring losses to below that level in the close. The overnight risk-off is helping the greenback a hand as well, maybe via higher oil prices (the US turned from net energy importer to self-reliant to a net exporter), but we’re not so sure this is a durable driver. The geopolitical theme tends to have a short shelf live for markets and it doesn’t offset all of the other lingering dollar negatives. But it can set the tone for today of course. Stock markets are a sea of red in Asian dealings and are set for a lower open in Europe and the US. Treasuries extend gains and Bunds will probably do the same at the cash market open. The German fiscal narrative moved to the background these last couple of weeks but that doesn’t mean things are idle. The Financial Times reported that Germany seeks to fast-track spending from its €500bn infrastructure fund by addressing the poor state of its railway first. This became the symbol of Germany’s years of underinvestment. No longer: €22bn infrastructure investments earmarked for 2025 (of which €10.5bn for railways) would grow to €35bn a year until 2029. FYI: this comes on top of the de facto unlimited defense spending pledge Germany made early March. As this week draw to a close, attention already shifts to the next with the Fed policy meeting taking center stage. Rates will remain unchanged, despite pressure from the White House, including president Trump (arguing for a 100 bps cut) and VP Vance. The WH’s growing frustration is causing speculation in markets that Trump could soon (shortly after the Fed decision?!) nominate Powell’s successor. The idea is that acting as a shadow Fed chair, he could then already start talking markets towards lower rates when taking over the helmet in May next year.
News & Views
The June KPMG and REC UK jobs survey compiled by S&P Global on the UK labour market showed mixed signals. The report points to a further reduction in UK recruitment activity in May with survey members reporting that weaker confidence around the outlook and concerns over costs had dampened staff hiring. Permanent placements fell at a slightly sharper rate. At the same time, the decline in temp billings was the slowest in six months. On the supply side of the labour market, candidate supply expands at sharpest rate since end of 2020 amid reports of redundancies and fewer job opportunities. Vacancies still declined at a solid pace suggesting lower demand, but the downturn eased during the survey period. Pay growth strengthened again, but remained below trend.
The government of Poland on its website published some economic variables that will be used as the basis for its next year’s budget. The government expects annual inflation to ease to 3% in 2026, compared to the NBP’s 3.4% in its March inflation report. The government left the 2026 growth forecast unchanged at 3.6%. Average wage is seen at 6.7% for the overall national economy and at 6.9% (from 7.7% in the April forecast) for the corporate sector. The government sees registered unemployment at 4.9%.
Oil Jumps as Middle East Boils
Oil jumped as much as 13% after Israel launched a major and unprecedented attack on Iran, targeting nuclear and military facilities.
While the news isn’t entirely surprising—there had been reports of Israel preparing action and the U.S. ordered Americans to leave the region earlier this week—the Israeli strikes could mark the beginning of wider regional tensions. If Israel continues operations beyond its borders, the Middle East could heat up fast.
Latest: Israel says Iran’s nuclear program poses an existential threat and vows that its operation will continue for as long as necessary. Iran has already launched hundreds of drones in retaliation and could go further. But how much further?
Back in October 2024, Israel had launched a major strike on Iranian nuclear facilities. At the time, Iran responded with drone attacks that were mostly intercepted and perceived more as a warning than a retaliation. Tensions eventually eased and markets quickly settled. A similar de-escalation is possible now—but not guaranteed. Judging by the price action, the market’s response to last night’s attack has been very strong.
The price of US crude jumped as much as 13%, trading past $77 per barrel in the early hours of today, while Brent also surged past $76pb. Prices have since pulled back slightly, but tensions are far from over.
One scenario is de-escalation, which could bring oil back below $70 per barrel, around the 200-day moving average, shifting the market's attention back to supply-demand dynamics, trade disruptions, and renewed pressure on Russian oil.
The other scenario is broader escalation, potentially pushing oil prices toward $90–$100 per barrel—hopefully only temporarily.
Beyond oil, if tensions disrupt transit through the Strait of Hormuz, LNG flows could also be hit—as roughly one-fifth of global LNG passes through the strait. So far, there's no major price action on that front. Let’s hope tensions ease before broader disruptions emerge.
US and Iran are expected to meet in Oman this Sunday to discuss Iran’s nuclear program—so this weekend could bring fresh developments.
Naturally, rising geopolitical tensions are powering haven assets. Gold is up 1%, trading just below its all-time high, while the USDCHF is flirting with the 0.80 support level despite broad US dollar strength.
Yet, that US dollar rebound follows a sharp drop—recent lows not seen since April 2022—on the back of another round of soft inflation data released yesterday. US producer prices rose less than expected in May, easing concerns that inflation would spike in response to tariffs.
The US 2-year yield slipped below 3.90% on rising expectations of a dovish Federal Reserve (Fed), though Fed funds futures still price less than a 30% chance of a July rate cut. On the long end, the 10-year is seeing haven flows on Mid-East tensions, and the 30-year also found demand—particularly after yesterday’s $22bn auction attracted strong interest, suggesting that markets have absorbed latest US debt worries. America can keep spending—markets will finance it. What a wonderful world.
In equities: soft inflation and falling yields supported US equities yesterday, but futures are sharply lower this morning. Oil and defense stocks will likely benefit from rising tensions, but the rest of the market should remain under pressure.
Looking beyond geopolitics and risk-off mood, US equity valuations look stretched, especially compared to bond yields. The equity risk premium—the difference between equity and Treasury returns—has fallen to its lowest since 2002 for the S&P500, and is now negative. That means investors currently get better returns from US Treasuries than from the S&P 500, which yields around 3.60%.
That relatively low return is partly due to the relentless rally in Big Tech and partly due to yields hitting multi-decade highs. Excluding the Magnificent 7, the rest of the S&P 493 yields about 5%—but even then, they offer only a minor risk premium over Treasuries, which are supposed to be ‘low risk.’ How low that risk really is, of course, is debatable. But history shows the US has always managed to make markets digest its debt.
Anyhow, many investors may prefer to take risk off the table ahead of what could be a volatile weekend in terms of geopolitical headlines.