Sample Category Title
Platinum Wave Analysis
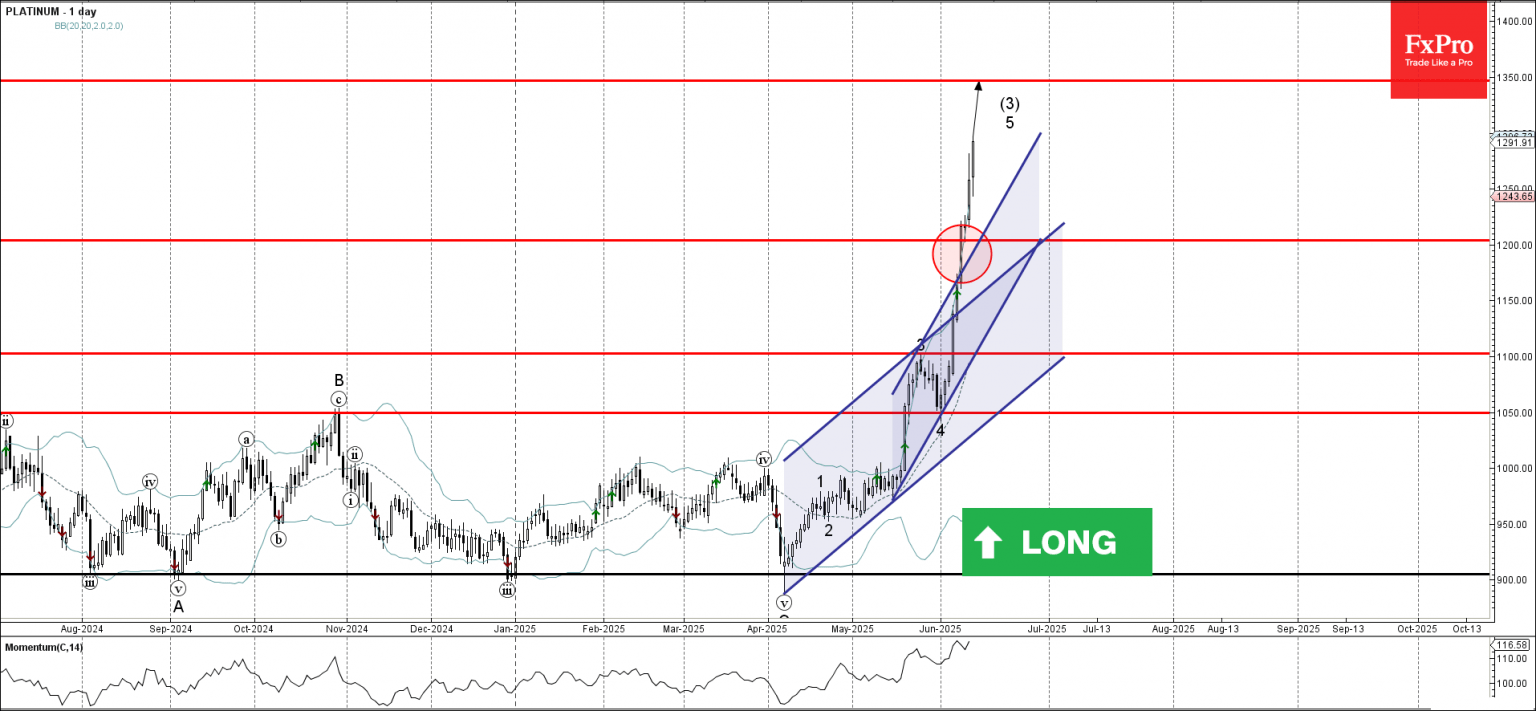
Platinum: ⬆️ Buy
- Platinum broke resistance zone
- Platinum to rise to resistance level 1350.00
Platinum continues to rise strongly after the recent breakout of the resistance zone between the key resistance level 1200.00 and the resistance trendline of the accelerated up-channel from May.
Platinum previously broke another up channel from April – which signalled the acceleration of the active impulse waves 5 and (3).
Platinum can be expected to rise to the next resistance level 1350.00 (target price for the completion of the active impulse waves 5 and (3).
June Flashlight for the FOMC Blackout Period: Why Change Policy Now?
Summary
- Despite the ongoing tumult around trade policy, the near-term outlook for monetary policy is steady-as-she-goes. We expect the FOMC will leave its target range for the fed funds rate unchanged at 4.25%-4.50% at the conclusion of its upcoming meeting on June 17-18.
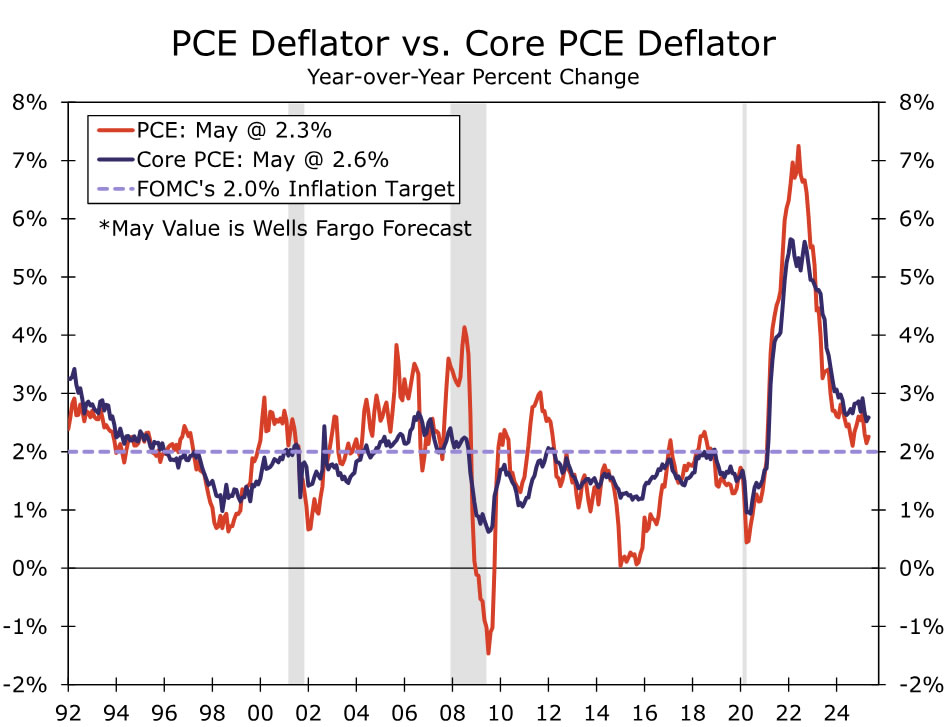
- "Hard" data show economic activity continues to hold up amid elevated policy uncertainty. Consumer spending started the second quarter with strong momentum, employment continued to expand at a healthy clip in May and the unemployment rate has held steady since March at a level consistent with the FOMC's estimate of full employment. The latest readings on consumer and producer prices point to core PCE inflation inching up to 2.6% on a year-ago basis in May, up from 2.5% in April and still above the FOMC's target of 2%.
- Changes to trade policy have ushered in upside risks to both unemployment and inflation. But, with current data showing activity remaining resilient, we expect the post-meeting statement and Chair Powell's press conference will convey that the Committee is still in no hurry to adjust policy. We believe the FOMC will need to see more pronounced softening in the labor market to begin cutting the fed funds rate again this year. We expect to see this softening in the coming months and look for 75 bps of easing by year end.
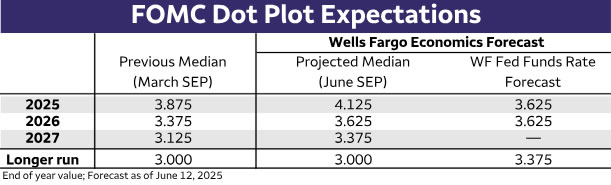
- An update to the Summary of Economic Projections (SEP) will provide a fresh look at what Committee members think lies ahead for the economy and the fed funds rate. We expect the median projection for the fed funds rate at year-end will move up 25 bps to 4.125%, although we would not be surprised if the median dot for 2025 were left unchanged at 3.875%. The same can be said for the 2026 dot moving up 25 bps to 3.625%.
- Elsewhere in the SEP, we expect to see projections for inflation at the end of 2025 move a few tenths higher in light of the changes to tariff rates since the March SEP. Estimates for GDP growth are likely to be revised down to only a little over 1% following the first quarter's decline and lingering challenges to growth in the second half of the year. Yet, the median estimate for the unemployment rate may very well remain unchanged at 4.4%, as slower growth in the labor supply and an ongoing reluctance among businesses to cut workers keeps the jobless rate from moving up significantly this year.
The Economy Remains "Solid" While Inflation Is Still "Somewhat Elevated"
When the Federal Open Market Committee (FOMC) voted unanimously on May 7 to keep its target range for the federal funds rate unchanged at 4.25%-4.50%, the Committee noted in its post-meeting statement that "recent indicators suggest that economic activity has continued to expand at a solid pace." It also stated that "labor market conditions remain solid." When it releases its next post-meeting statement on June 18, we think the FOMC may note economic activity has expanded at a "moderate" pace, while continuing to characterize the labor market as "solid."
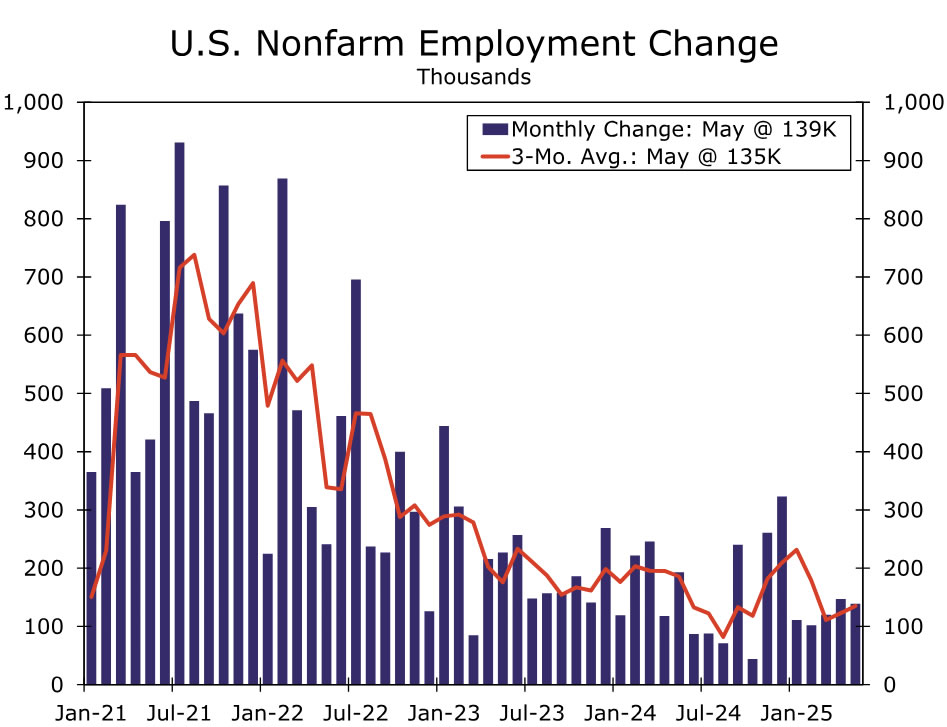
For example, recently released data show that real personal consumption expenditures (PCE) continued to grow in April. Although the 0.1% increase in real PCE is obviously not very strong, it followed a robust gain of 0.7% in March. In other words, real consumer spending started off the second quarter with strong momentum. Additionally, employment continued to expand in May. Factoring in downward revisions to March and April data, nonfarm payrolls increased an average of 135K the past three months, while the unemployment rate has held steady at 4.2% since March (Figure 1).
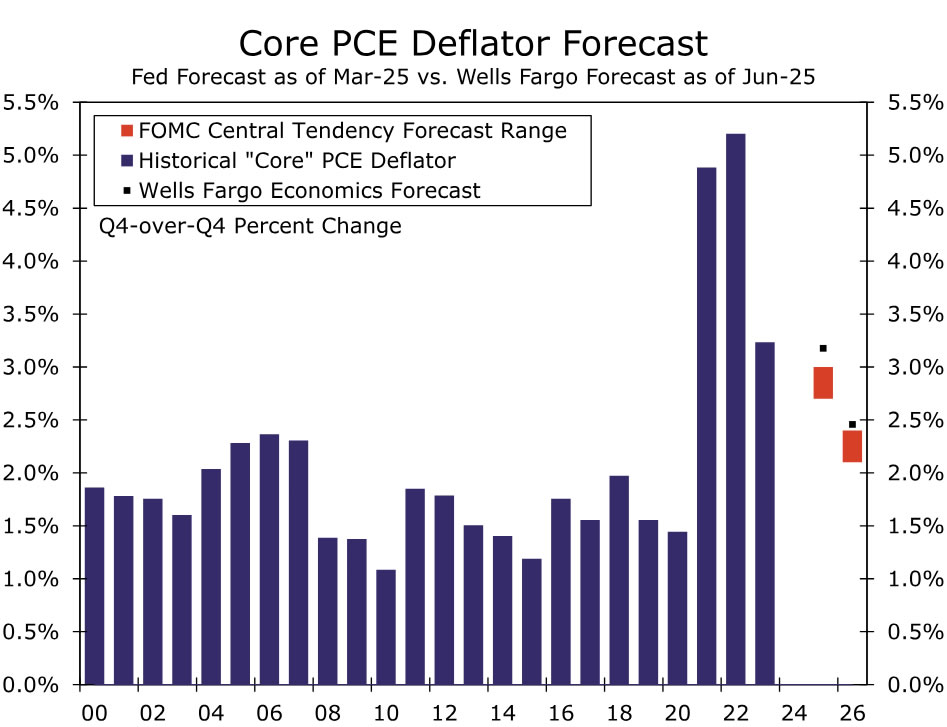
Turning to the other side of its dual mandate, the FOMC noted in its last statement that "inflation remains somewhat elevated." The most recent reading on the year-over-year change in the core PCE deflator, which most Fed officials consider to be the best measure of the underlying rate of consumer price inflation, came in at 2.5% in April. The May CPI report came in softer-than-expected and was welcome news for the FOMC. That said, we believe it is too early for the FOMC to declare victory and say that the significant increase in tariffs over the past few months will have no material impact on consumer price growth. Most of the tariff increases occurred over the March-May period, and we doubt enough time has elapsed for the full effects of these policy changes to be felt on pricing. Furthermore, based on the May CPI and PPI reports, we expect core PCE inched up to 2.6% in May, still above the FOMC's target of 2% (Figure 2). Given these crosscurrents, we see little reason for the FOMC to make a change to the current stance of monetary policy at this time.
Recent comments by Fed officials seem to indicate the Committee is content with the current stance of monetary policy. For example, Chair Powell said in his May 7 press conference that "we don’t think we need to be in a hurry. We think we can be patient." More recently, Chicago Fed President Austan Goolsbee noted that the bar for a near-term rate cut is "a little higher." Goolsbee's sentiment is instructive. Not only is he a voting member of the FOMC this year, but most observers consider Goolsbee to be "dovish." If a dovish member of the FOMC thinks it probably would not be appropriate to ease policy at this time, it is hard to envision the hawkish members arguing for a rate cut on June 18. Most market participants seem to agree that the Committee will remain on hold at its next meeting. As of this writing, the implied probability of a 25 bps rate cut on June 18 is essentially 0%.
Uncertainty Remains Elevated
Moreover, a change in the monetary policy stance when the economic outlook remains highly uncertain, due in part to the ever-evolving outlook for U.S. trade policy, does not seem likely. At the conclusion of the FOMC meeting on March 19, which happened before President Trump announced his "Liberation Day" tariffs on April 2, the Committee said "uncertainty about the economic outlook has increased." The FOMC's statement on May 7 read "uncertainty about the economic outlook has increased further" (emphasis ours). Uncertainty may not have increased even more relative to the last FOMC meeting, but it clearly has not diminished by a significant degree, in our view. Therefore, we expect the statement on June 18 will note that uncertainty remains elevated.
This uncertainty is manifested in the outlooks for unemployment and inflation, the two goals of the Fed's dual mandate. On March 19 the FOMC said, as it has in other recent statements, that it "is attentive to the risks to both sides of its dual mandate." The Committee included that sentence in its May 7 statement but added the following clause: "and judges that the risks of higher unemployment and higher inflation have risen." We think the FOMC will continue to note in its June 18 statement that the risks of higher unemployment and higher inflation remain elevated.
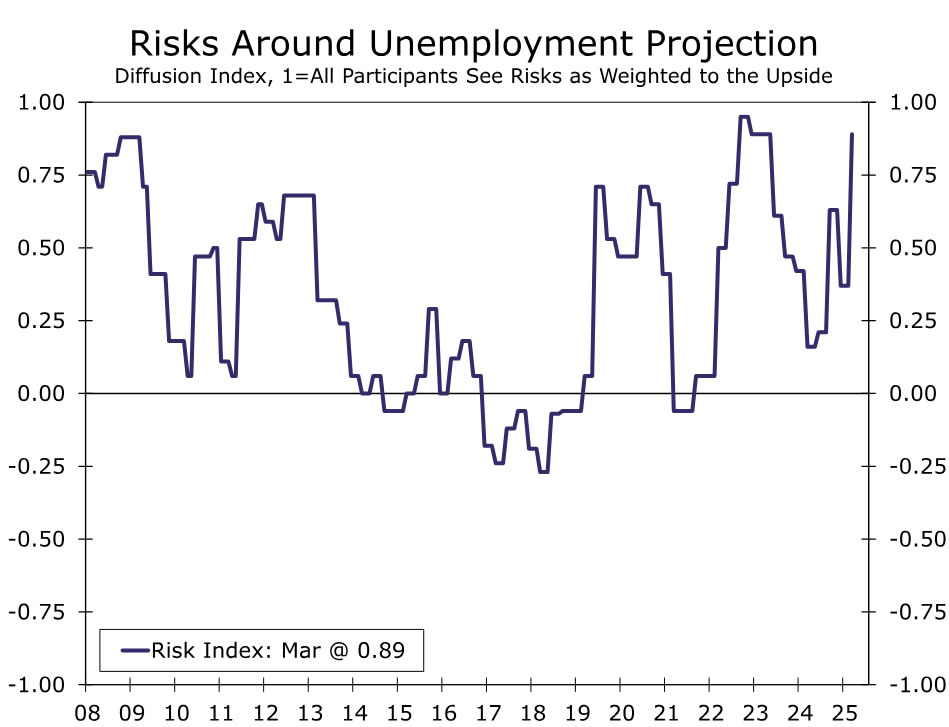
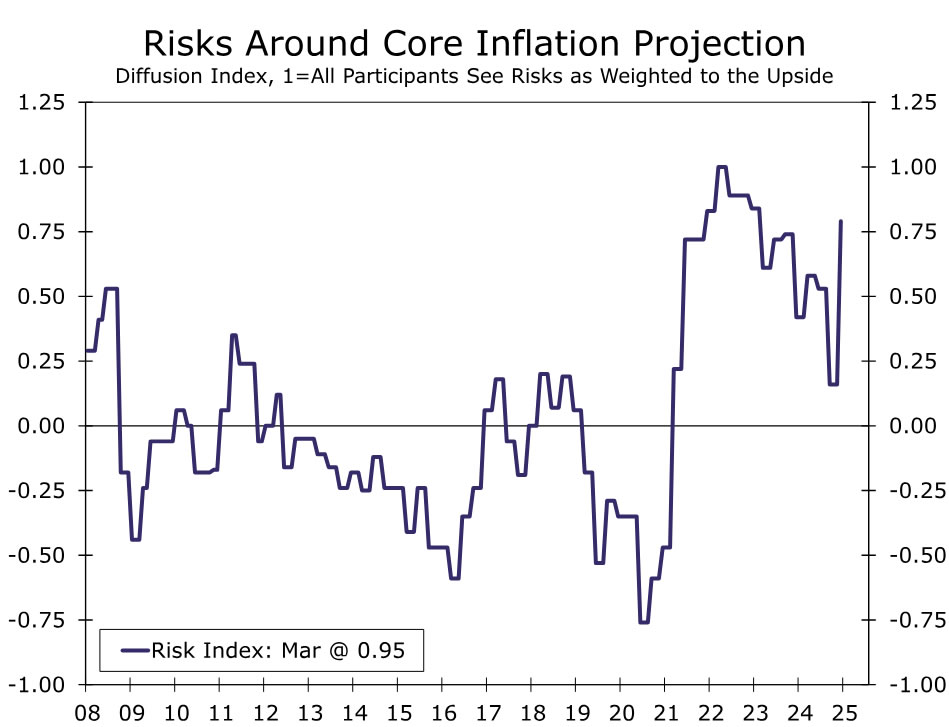
As part of its quarterly Summary of Economic Projections (SEP), the FOMC includes an assessment of the risks to its macroeconomic forecasts. When the last SEP was released on March 19, the number of FOMC members indicating that the risks to their individual unemployment rate projections were "weighted to the upside" jumped significantly relative to the December SEP (Figure 3). Additionally, the risks to the core PCE inflation forecasts were also "weighted to the upside" (Figure 4). We expect these measures of risk in the June SEP will remain elevated, if not move higher.
Upside risks to both unemployment and inflation produce a conundrum for the FOMC. On one hand, the Committee would want to respond to an upside surprise to unemployment with policy easing. On the other hand, higher-than-expected inflation would induce the FOMC to respond with policy tightening. Given the heightened level of uncertainty, the FOMC is likely to deem that the best course of action, at least at the present time, may be simply to keep the stance of policy unchanged and watch incoming data to determine if a change in policy is warranted.
Outlook for the Dots
Given the uncertainty surrounding the economic outlook, we do not expect significant changes to the dot plot, which portrays the monetary policy expectations of the individual FOMC members. In March, the median FOMC member thought that 50 bps of rate cuts by the end of 2025 would be appropriate (Figure 5). While we would not be surprised to see the median dot for this year remain unchanged, we believe it is more likely that median dot will shift higher to indicate only 25 bps of easing before the end of the year. As discussed earlier, the Fed speak does not suggest the FOMC is in any hurry to cut rates at its next few meetings, and it would take only two dots moving up to change the median from 50 bps to 25 bps. That said, we think a meaningful number of members will continue to judge that 50 bps of policy easing by the end of 2025 would be appropriate. In the March dot plot, nine Committee members judged that 50 bps of rate cuts would be appropriate by the end of this year, while two members chose 75 bps of policy easing.
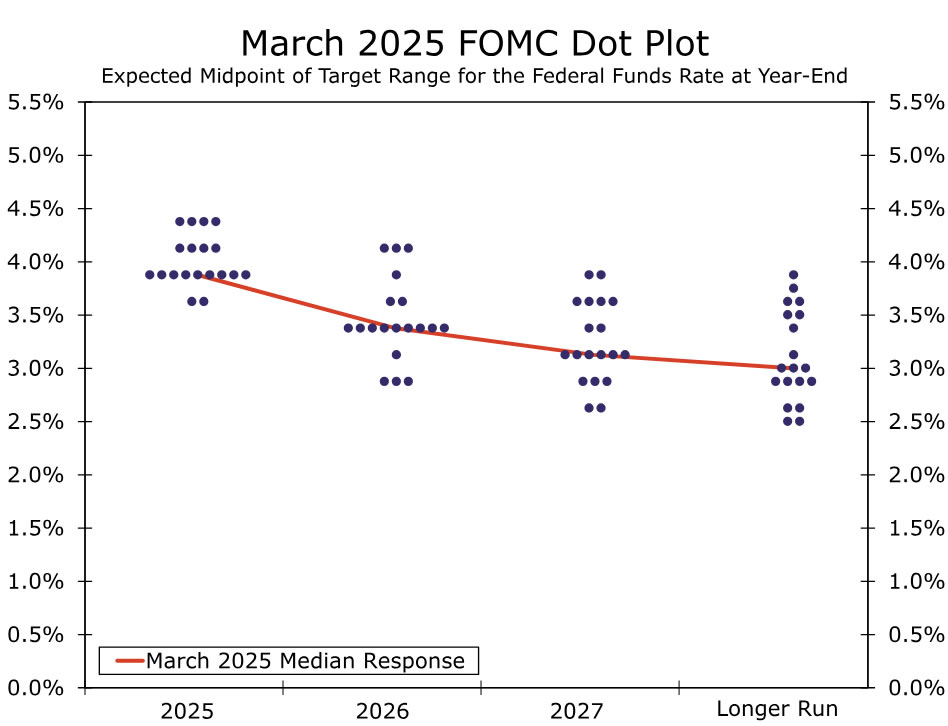
The dots for 2026 are more dispersed, as is typical for longer-dated forecasts. In March, nine FOMC members, which included the median, judged that a cumulative easing of 100 bps from the target range for the federal funds rate at that time would be appropriate by year-end 2026. We anticipate the median dot for next year to shift up 25 bps to 3.625%. If realized, that shift would signal 75 bps of cumulative easing by the end of next year. Like the 2025 dot, we see the risks to this view as skewed toward the 2026 median projection remaining unchanged at 3.375%.
The slightly higher expectations for the fed funds rate indicated by the dot plot are likely to come as FOMC participants see inflation deviating further from target this year. While some policymakers assumed higher tariffs in their 2025 inflation projections in the March SEP, a number of officials have noted in their public comments that changes to tariffs have generally been larger than they expected. Thus, we would expect to see the median projections for both headline and core PCE inflation in 2025 to move a few tenths higher in the June SEP, to 3.0% and 3.1%, respectively (Figure 6). In contrast, GDP projections for 2025 are likely to be revised down to just a little over 1%. Not only are the changes to trade policy and lingering uncertainty challenging for growth in the coming months, but the 0.2% annualized decline in Q1 GDP has created a tough starting point for growth this year. Yet, we expect the median estimate for the unemployment rate to remain unchanged at 4.4%, as slower growth in the labor supply and an ongoing reluctance to cut workers keeps the jobless rate from moving much beyond the Committee's estimates for full employment.
Sunset Market Commentary
Markets
One way to put it is saying that you are prepared to roll the date forward for countries/blocs which are negotiating in good faith. US Treasury Secretary Bessent framed it like this when asked about the approaching end date (July 8) to the 90-day pause for reciprocal tariffs on all countries expect China (early August deadline) in the House Ways and Means Committee. It’s the positive reading of the current trade truce. You emphasize the potential reward and boost confidence. US President Trump said that the same but highlighted the negative side of the coin. He plans to send letters in about a week and half, two weeks to countries/blocs informing them how high unilateral tariff rates will be after July 9. He stresses the punishment for dragging your feet in trade negotiations. And while this timeline still allows for last-minute efforts to avoid the worst possible outcome, it put markets back on alert when it comes to trade wars. Today’s biggest victim is the US dollar. The trade-weighted suffers from a US institutional crisis. The trade-weighted greenback (DXY) set a minor new low for the year (<98; weakest since April 2022). EUR/USD pierced the previous YtD high a 1.1573 to change hands above 1.16 for the first time since October 2021. We stick to our buy-the-dip call with medium term target at 1.2349 (full retracement on 2021-2021 EUR/USD-decline). Risk sentiment hit a snag as well. Main European indices lose up to 1% with key US benchmarks showing opening losses of 0.2%-0.5%. Breaking with the “Sell America” trade today are US Treasuries. US yields drop 6 to 7 bps across the curve with the belly of the curve outperforming the wings. Investors fear recession risks which will prompt the Fed faster-than-expected in action. They feel vindicated by yesterday’s CPI inflation numbers which in May showed no signs whatsoever yet from tariff-related price pressure. Categories in focus like furniture, cars (new & used), apparel or clothing all showed month-on-month prices declines. It’s too early to tell whether it’s because companies not raising prices (yet) or whether they are running down inventories built up in the run-up to Liberation Day. Today’s producer price inflation rose less-than-feared as well (0.1% M/M for headline and core vs 0.2% & 0.3% expected respectively). Contrary to yesterday’s CPI, there was a significant upward revision to April PPI data, making today’s report somewhat more mixed. US weekly jobless claims stabilized just below 250k. Since end 2021, claims only passed that level on six occasions. Today’s Treasury’s performance lifts some pressure of tonight’s scrutinized $22bn 30-yr Bond auction in light of deteriorating public finances under Trump’s big beautiful bill. We’d err against buying into the US Treasury rally, especially at the longer end of the curve as Treasuries continue losing their safe haven appeal. German Bunds and UK Gilts performed well as well today, both in a bull flattening move. EUR/GBP extends the rally which started after a weak UK labour market report earlier this week, rising from 0.8480 to 0.8525.
News & Views
The Norges Bank (NB) published Its Reginal Network Contacts Survey ahead of next week’s policy meeting (June 19). Contacts expect growth to remain firm in Q2 and Q3 (0.4% quarterly). International trade barriers are increasing uncertainty, but only a few contacts expect this will lead to lower growth in the period to autumn. Increased defense investment and higher aquaculture output are reported to boost growth. Contacts also expect higher sales of durable goods and further growth in tourism, supporting the household related services. Construction still has the weakest expectations (-0.3% in Q2), but some expect residential construction to pick up somewhat through autumn. The share of contacts reporting capacity constraints is little changed, while the share reporting labour shortages declined slightly. Contacts expect annual wage growth of 4.5% in 2025 and 4% in 2026. The ongoing solid growth outlook suggests that the NB shouldn’t be in a rush to cut it policy rate (4.5%). Markets still see a first cut only at the September meeting. The Norwegian krone trades little changed in a daily perspective (EUR/NOK 11.57).
Indian inflation declined more than expected in May, from 3.36% Y/Y to 2.82% Y/Y (lowest since February 2019) and remaining below the Reserve Bank of India’s%-target for a fourth consecutive month. The easing in inflation was mainly driven by a further decline in food prices. The RBI last week cut its policy rate by a bigger than expected 50 bps to 5.5%, which it labeled as a frontloading move. It also lowered its inflation forecast for the 2025-26 financial year to 3.7%, but at the same time changed its policy stance to neutral, from accommodative. It this respect, the RBI indicated that, after the recent cumulative easing of 100 bps since February, it saw only limited scope to further support growth. The rupee eases modestly today with USD/INR trading near 85.6.
EUR/AUD Mid-Day Outlook
Daily Pivots: (S1) 1.7554; (P) 1.7617; (R1) 1.7735; More...
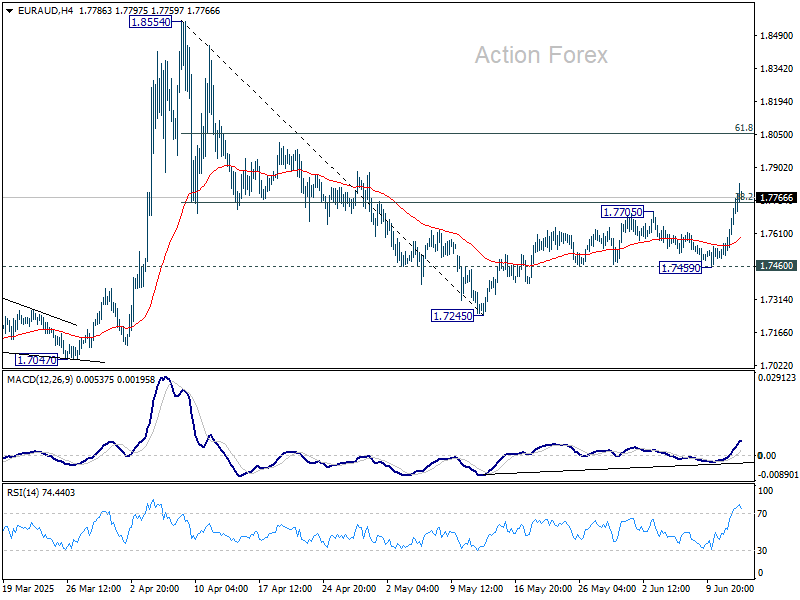
EUR/AUD's rise from 1.7245 continues today and break of 38.2% retracement of 1.8554 to 1.7245 at 1.7745 suggests that fall from 1.8554 has ready completed as a correction. Further rally should be seen to 61.8% retracement at 1.8054 next. For now, further rally is expected as long as 1.7459 support holds, in case of retreat.
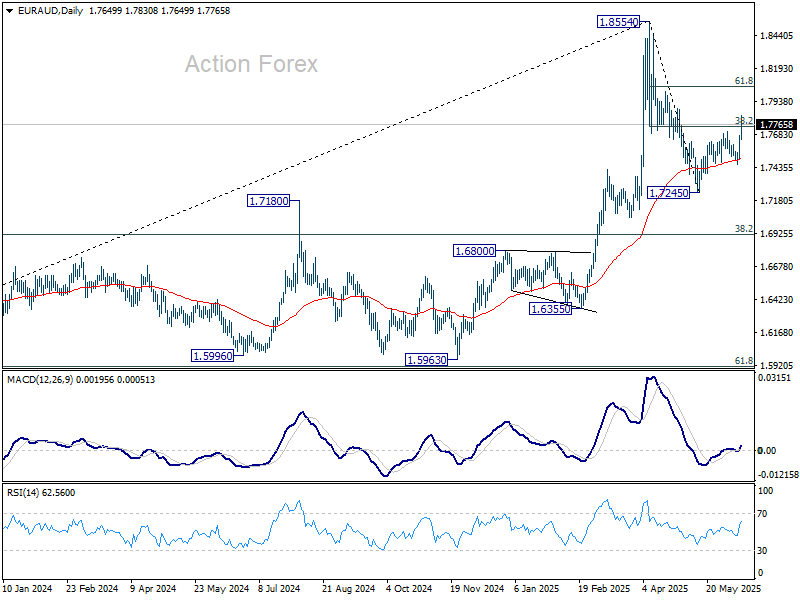
In the bigger picture, with 55 W MACD staying well below signal line, 1.8554 is likely a medium term top already. Price actions from there are seen as a corrective pattern only. While deeper pullback might be seen, downside should be contained by 38.2% retracement of 1.4281 (2022 low) to 1.8554 at 1.6922 to bring rebound. Up trend from 1.4281 is still expected to resume at a later stage.
EUR/GBP Mid-Day Outlook
Daily Pivots: (S1) 0.8461; (P) 0.8475; (R1) 0.8494; More...
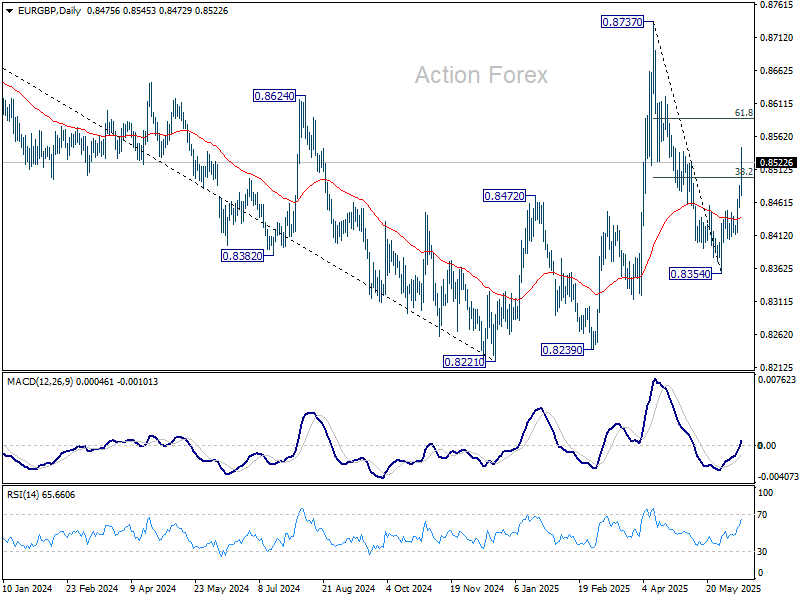
EUR/GBP's rise from 0.8354 accelerates higher today and broke 38.2% retracement of 0.8737 to 0.8354 at 0.8500 decisively. Fall from 0.8737 might have already completed. But even if not, further rise should still be seen to 61.8% retracement at 0.8591. On the downside, below 0.8475 minor support will turn intraday bias neutral again first.
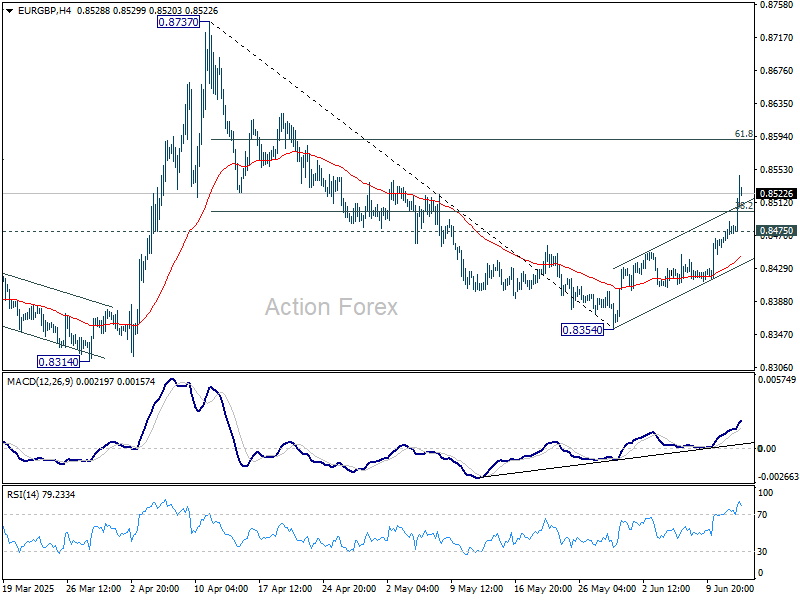
In the bigger picture, price actions from 0.8221 medium term bottom are merely forming a corrective pattern. Nevertheless, there is no clear momentum to break through 0.8201 key support (2022 low) yet. Hence, range trading is expected between 0.8221/8737 for now.
USD/CAD Mid-Day Outlook
Daily Pivots: (S1) 1.3651; (P) 1.3671; (R1) 1.3691; More...
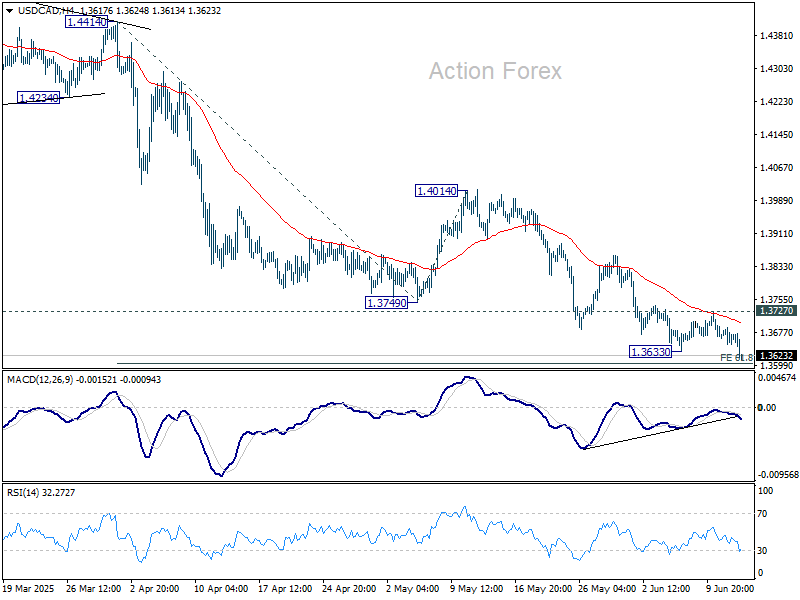
USD/CAD's decline resumed by breaking through 1.3633 support and intraday bias is back on the downside. Decisive break of 61.8% projection of 1.4414 to 1.3749 from 1.4014 at 1.3603 will pave the way to 100% projection at 1.3349. ON the upside, through, break of 1.3727 resistance will turn bias back to the upside for stronger rebound.
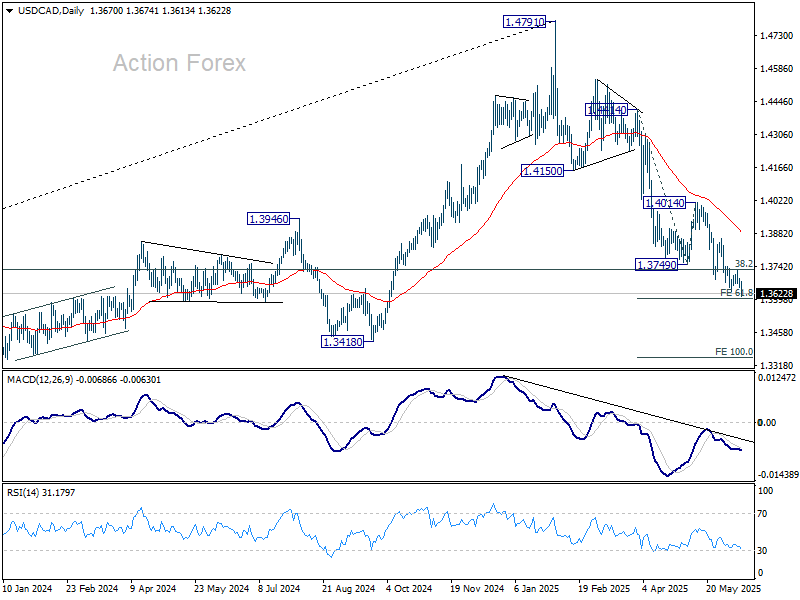
In the bigger picture, price actions from 1.4791 medium term top could either be a correction to rise from 1.2005 (2021 low), or trend reversal. In either case, further decline is expected as long as 1.4014 resistance holds. Firm break of 38.2% retracement of 1.2005 (2021 low) to 1.4791 at 1.3727 will pave the way back to 61.8% retracement at 1.3069.
USD/JPY Mid-Day Outlook
Daily Pivots: (S1) 144.13; (P) 144.80; (R1) 145.27; More...
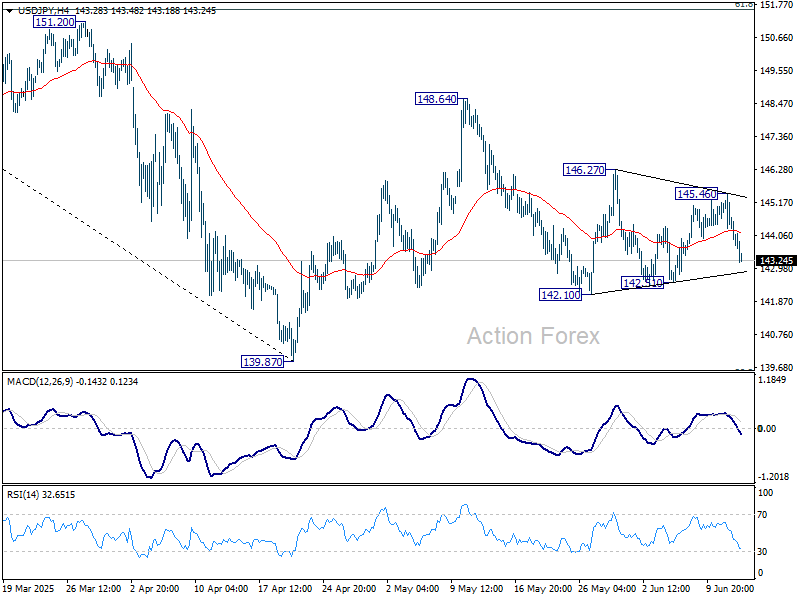
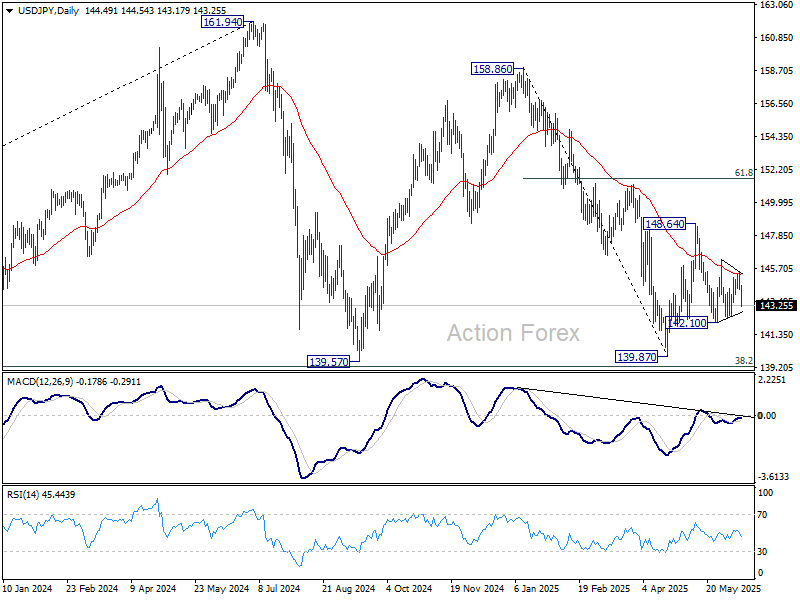
USD/JPY remains bounded in range and intraday bias stays neutral. On the downside, break of 142.10 support will resume the fall from 148.64 to retest 139.87 low. On the upside, above 145.46 will turn bias to the upside for 146.27 first. Firm break there will target 148.64 resistance.
In the bigger picture, price actions from 161.94 are seen as a corrective pattern to rise from 102.58 (2021 low), with fall from 158.86 as the third leg. Strong support should be seen from 38.2% retracement of 102.58 to 161.94 at 139.26 to bring rebound. However, sustained break of 139.26 would open up deeper medium term decline to 61.8% retracement at 125.25.
USD/CHF Mid-Day Outlook
Daily Pivots: (S1) 0.8180; (P) 0.8209; (R1) 0.8234; More….
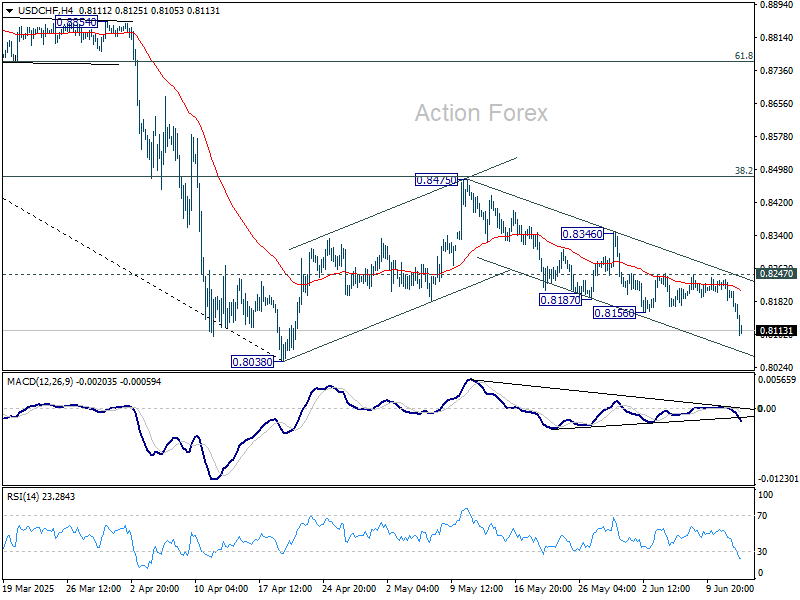
USD/CHF's fall from 0.8475 resumed by breaking through 0.8156. Intraday bias is back on the downside for retesting 0.8038 low. Strong support could be seen there to break rebound, but further fall is in favor as long as 0.8247 resistance holds. Firm break of 0.8038 will resume larger down trend.
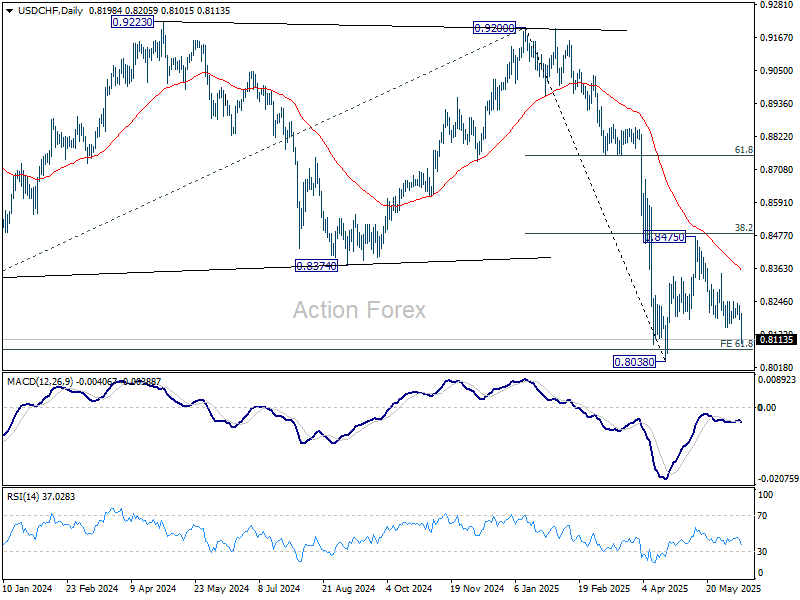
In the bigger picture, long term down trend from 1.0342 (2017 high) is still in progress and met 61.8% projection of 1.0146 (2022 high) to 0.8332 from 0.9200 at 0.8079 already. In any case, outlook will stay bearish as long as 55 W EMA (now at 0.8696) holds. Sustained break of 0.8079 will target 100% projection at 0.7382.
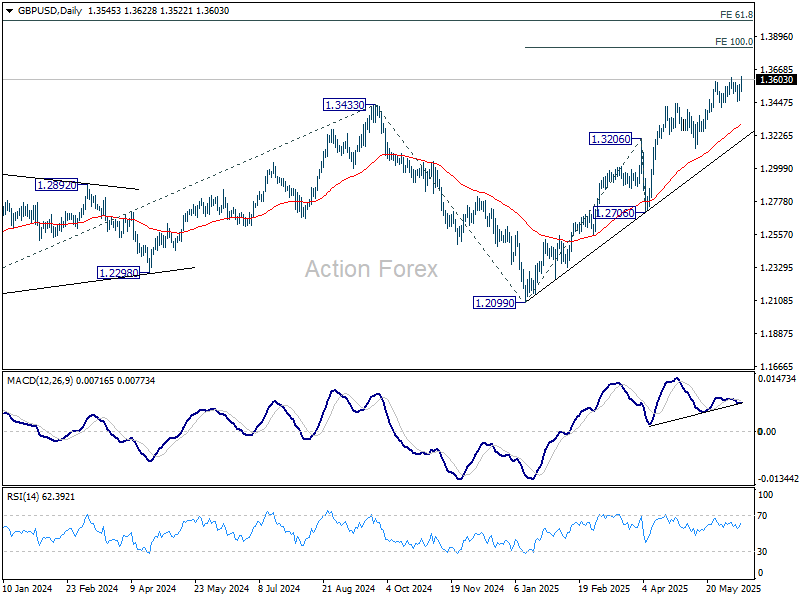
GBP/USD Mid-Day Outlook
Daily Pivots: (S1) 1.3486; (P) 1.3526; (R1) 1.3589; More...
Focus is now on 1.3615 resistance in GBP/USD. Decisive break there will resume the rally from 1.2099 and target 100% projection of 1.2099 to 1.3206 from 1.3138 at 1.3813. On the downside, break of 1.3455 support should confirm short term topping, and bring deeper correction to 55 D EMA (now at 1.3300) instead.
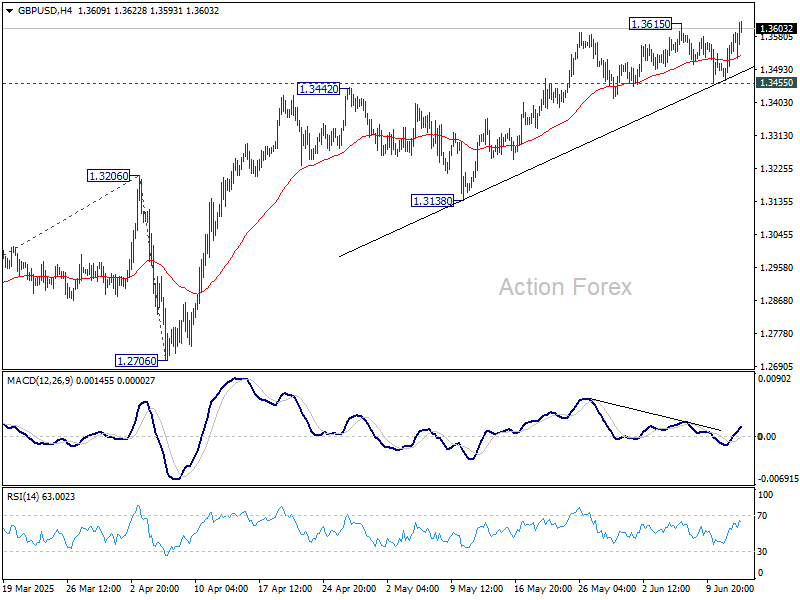
In the bigger picture, up trend from 1.3051 (2022 low) is in progress. Next medium term target is 61.8% projection of 1.0351 to 1.3433 from 1.2099 at 1.4004. Outlook will now stay bullish as long as 55 W EMA (now at 1.2913) holds, even in case of deep pullback.