
Sample Category Title
ECB Villeroy and Šimkus emphasize flexibility as policy hits neutral zone
Comments from two ECB Governing Council members today reinforced a cautious stance as the easing cycle appears to have reached a natural pause, following eight consecutive rate cuts.
French member Francois Villeroy de Galhau emphasized flexibility, telling Franceinfo radio that future policy will depend on how inflation evolves, stressing a preference for “pragmatism and agility.”
Lithuanian member Gediminas Šimkus echoed a similar tone, stating that policy has now reached a “neutral level”. It is critical for ECB to maintain the freedom, "not to commit to one direction or another". He warned of growing uncertainty, particularly around upcoming US trade decisions as the 90-day tariff truce nears expiry on July 9.
S&P 500 Maintains Uptrend — But for How Long?
As the chart of the S&P 500 (US SPX 500 mini on FXOpen) shows, price movements in June continue to form an upward trend (highlighted in blue).
The bullish momentum is being supported by:
→ News of a potential trade agreement between the United States and China;
→ The latest inflation report. Data released yesterday showed that the Consumer Price Index (CPI) slowed from 0.2% to 0.1% month-on-month.
President Donald Trump described the inflation figures as “excellent” and said that the Federal Reserve should cut interest rates by a full percentage point. In his view, this would stimulate the economy — and serve as another bullish driver.
However, as illustrated by the red arrow, the index pulled back yesterday from its highest level in three and a half months, falling towards the lower boundary of the channel. This decline was triggered by concerning developments in the Middle East. According to media reports, the US is preparing a partial evacuation of its embassy in Iraq, following statements by a senior Iranian official that Tehran may strike US bases in the region if nuclear talks with Washington fail.
Technical Analysis of the S&P 500 Chart
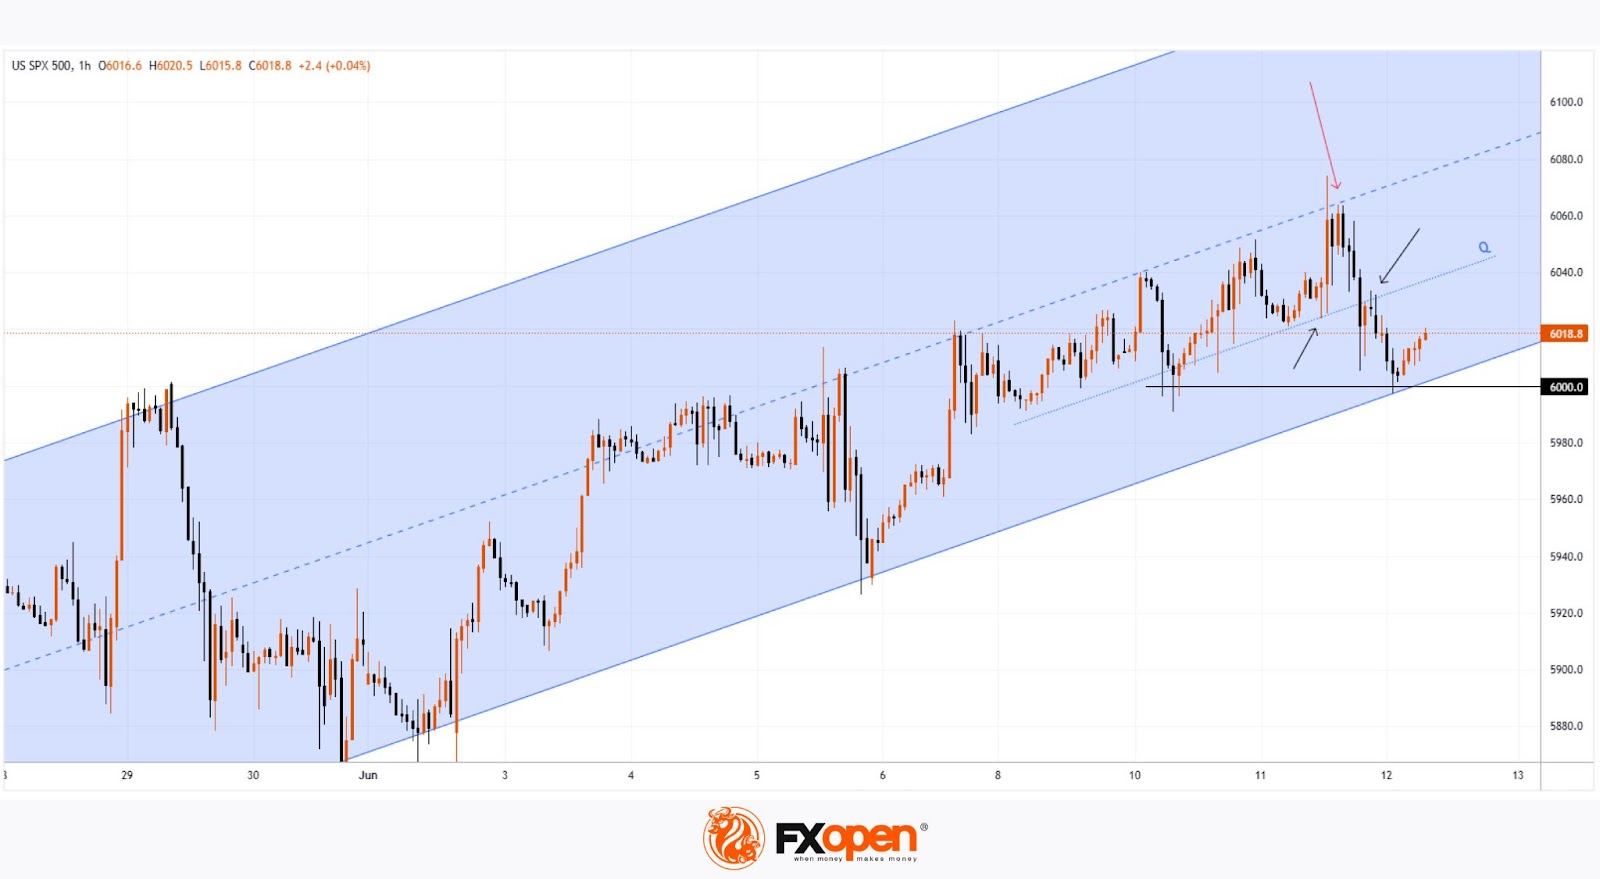
Currently, the price remains near the lower boundary of the ascending channel, reinforced by the psychologically significant 6,000-point level.
However, note that line Q — which divides the lower half of the channel into two quarters — has flipped from support to resistance (as indicated by black arrows). This suggests increasing bearish pressure, and there is a possibility that sellers may soon attempt to push the price below the channel support.
Be prepared for potential spikes in volatility on the E-Mini S&P 500 (US SPX 500 mini on FXOpen) chart as markets await the release of the Producer Price Index (PPI) at 15:30 GMT+3 today.
Trade global index CFDs with zero commission and tight spreads. Open your FXOpen account now or learn more about trading index CFDs with FXOpen.
This article represents the opinion of the Companies operating under the FXOpen brand only. It is not to be construed as an offer, solicitation, or recommendation with respect to products and services provided by the Companies operating under the FXOpen brand, nor is it to be considered financial advice.
GBP/JPY Daily Outlook
Daily Pivots: (S1) 195.38; (P) 195.81; (R1) 196.33; More...
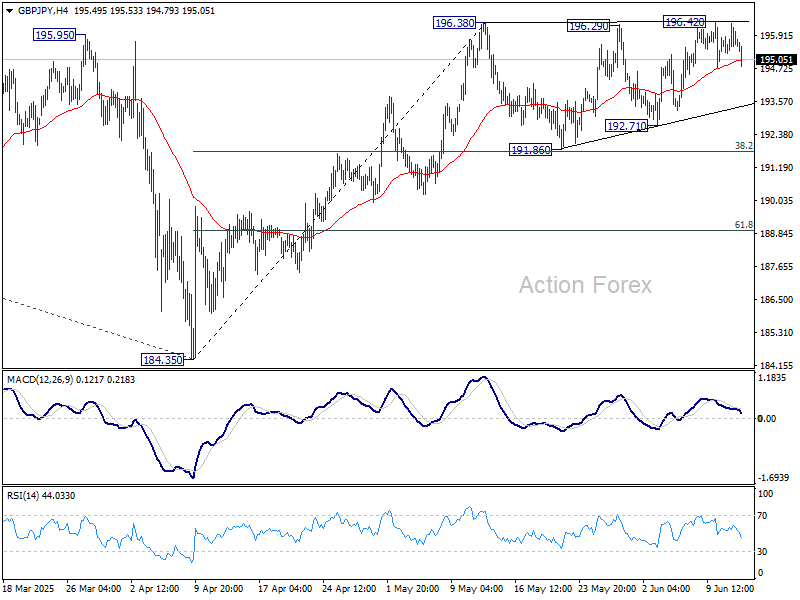
GBP/JPY is extending the consolidation pattern from 196.38 and intraday bias remains neutral. Further rise is in favor as long as 191.86 support holds. Firm break of 196.38 will resume whole rally from 184.35 to 199.79 resistance, and possibly further to 100% projection of 180.00 to 199.79 from 184.35 at 204.14.
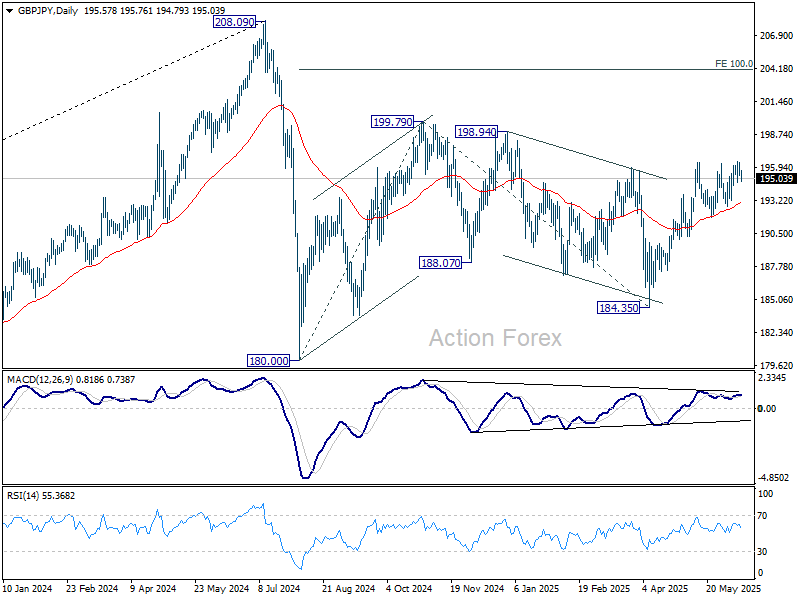
In the bigger picture, price actions from 208.09 are seen as a correction to rally from 123.94 (2020 low). Strong support should be seen from 38.2% retracement of 123.94 to 208.09 at 175.94 to contain downside. However, sustained break of 175.94 will bring deeper fall even still as a correction.
EUR/JPY Daily Outlook
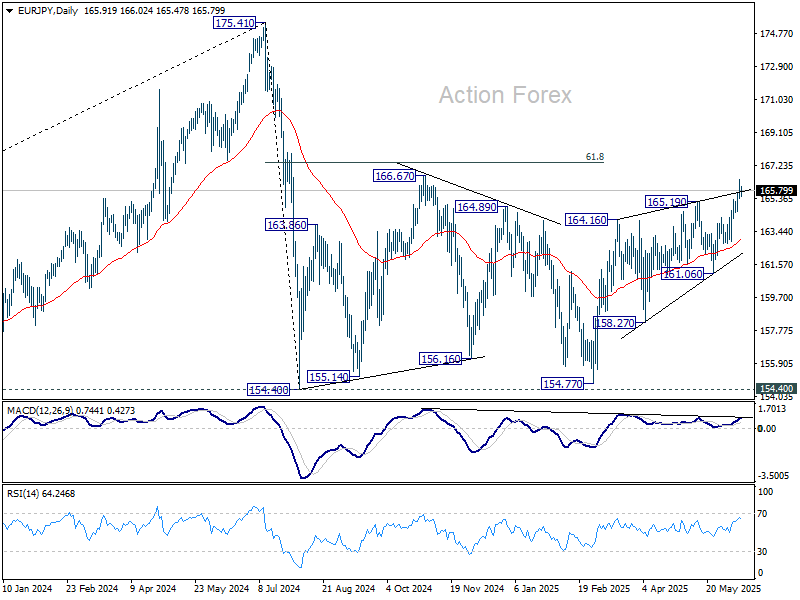
Daily Pivots: (S1) 165.52; (P) 165.98; (R1) 166.57; More...
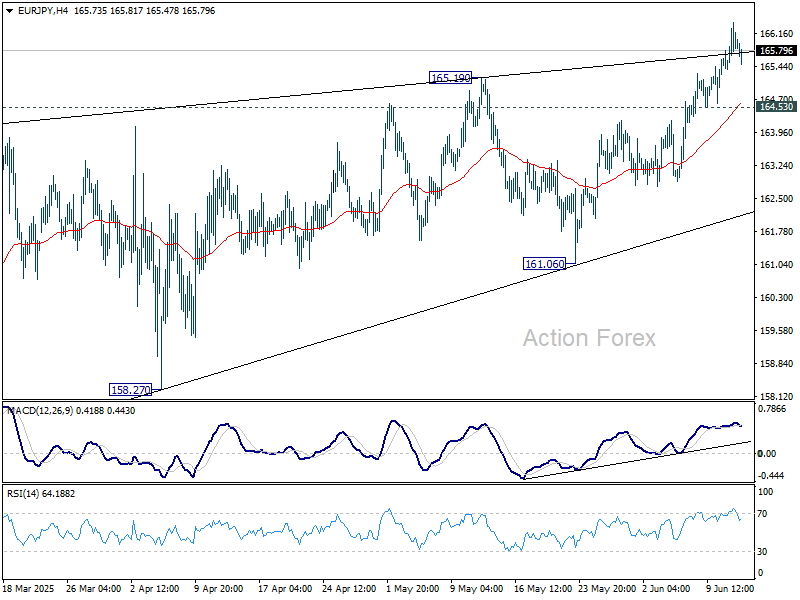
Intraday bias in EUR/JPY stays on the upside, as rise from 154.77 is in progress. Next target is 166.67 resistance, and then 61.8% retracement of 175.41 to 154.77 at 167.38. On the downside, below 164.53 minor support will turn intraday bias neutral again first.
In the bigger picture, price actions from 175.41 are seen as correction to up trend from 114.42 (2020 low). Strong support should be seen from 38.2% retracement of 114.42 to 175.41 at 152.11 to contain downside. However, sustained break of 152.11 will bring deeper fall even still as a correction.
EUR/GBP Daily Outlook
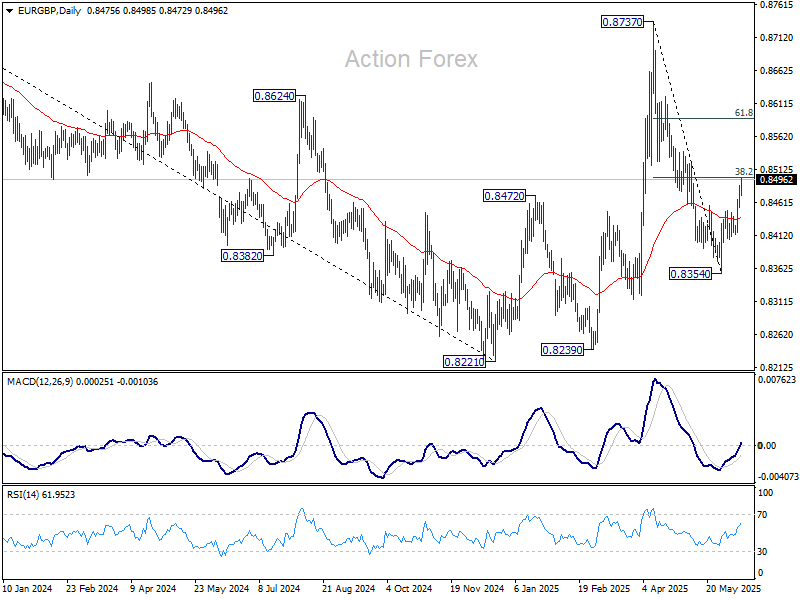
Daily Pivots: (S1) 0.8461; (P) 0.8475; (R1) 0.8494; More...
Intraday bias in EUR/GBP remains on the upside as rebound from 0.8354 extends higher today. Sustained break there will target to 61.8% retracement at 0.8591, even still as a corrective move. On the downside, though, break of 0.8413 will bring retest of 0.8354 low instead.
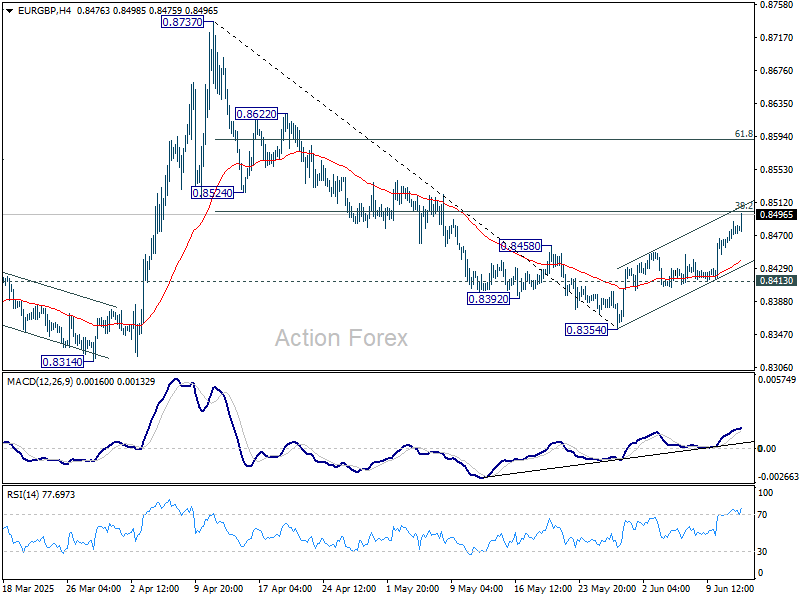
In the bigger picture, price actions from 0.8221 medium term bottom are merely forming a corrective pattern. Nevertheless, there is no clear momentum to break through 0.8201 key support (2022 low) yet. Hence, range trading is expected between 0.8221/8737 for now.
EUR/AUD Daily Outlook
Daily Pivots: (S1) 1.7554; (P) 1.7617; (R1) 1.7735; More...
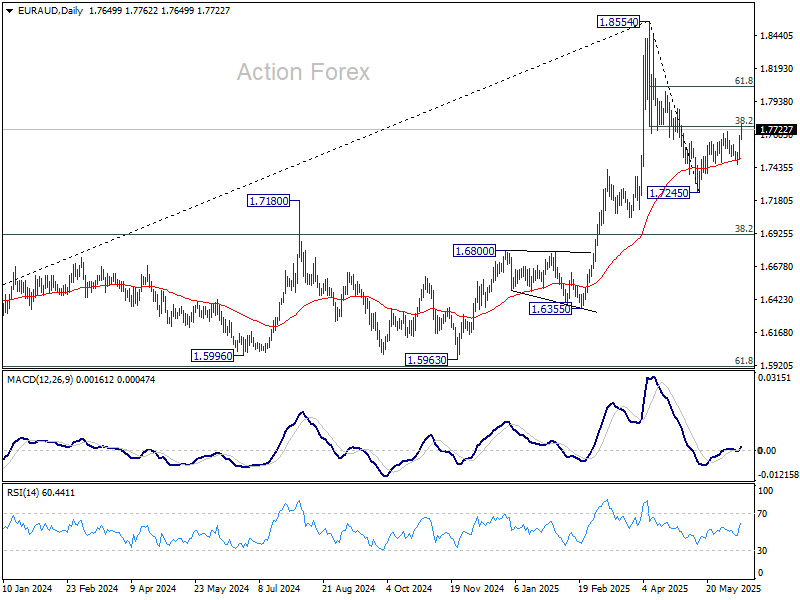
EUR/AUD's rebound from 1.7245 is resuming by breaking through 1.7705 and intraday bias is back on the upside. Decisive break of 38.2% retracement of 1.8554 to 1.7245 at 1.7745 will add to the case that fall from 1.8554 has already completed as a correction. Further rally should be seen to 61.8% retracement at 1.8054 next. This will now remain the favored case as long as 1.7460 support holds.
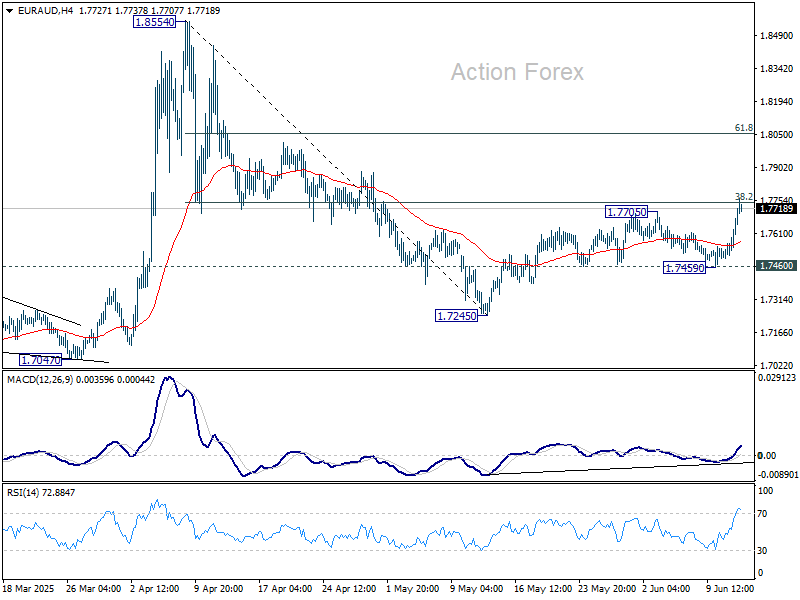
In the bigger picture, with 55 W MACD staying well below signal line, 1.8554 is likely a medium term top already. Price actions from there are seen as a corrective pattern only. While deeper pullback might be seen, downside should be contained by 38.2% retracement of 1.4281 (2022 low) to 1.8554 at 1.6922 to bring rebound. Up trend from 1.4281 is still expected to resume at a later stage.
EUR/CHF Daily Outlook
Daily Pivots: (S1) 0.9401; (P) 0.9415; (R1) 0.9442; More....
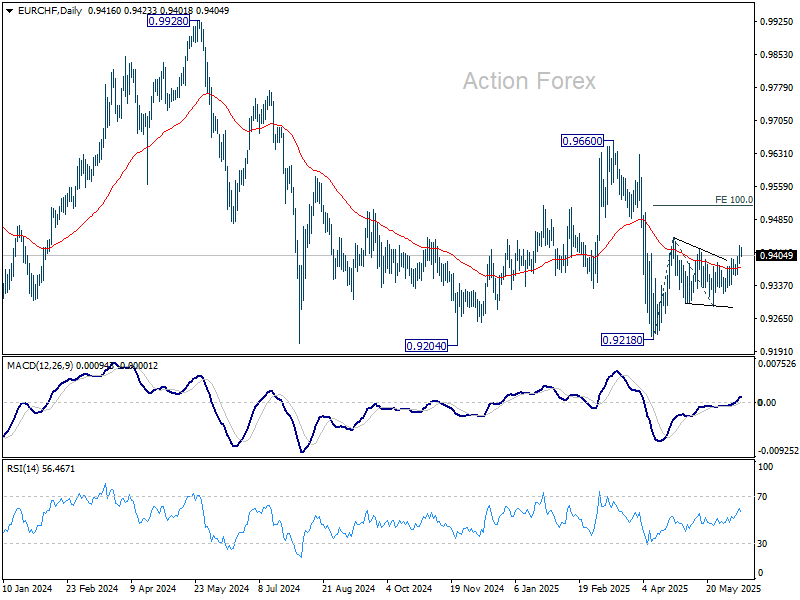
Breach of 0.9419 resistance suggests that EUR/CHF's rebound from 0.9218 might be resuming. Intraday bias is mildly on the upside for 0.9445 resistance first. Firm break there will target 100% projection of 0.9218 to 0.9445 from 0.9291 at 0.9518. On the downside, though, break of 0.9362 will turn bias back to the downside for 0.9291 support instead.
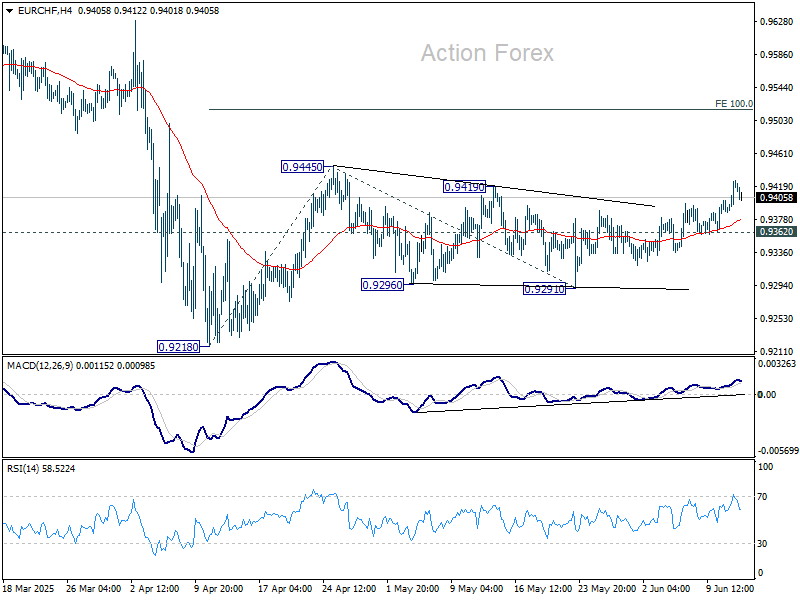
In the bigger picture, prior rejection by long-term falling channel resistance (now at 0.9527) retains medium term bearishness. That is, down trend from 1.2004 (2018 high) is still in progress. Firm break of 0.9204 (2024 low) will confirm resumption. This will remain the favored case as long as 0.9660 resistance holds.
DXY Headed for 98 April Low
Markets
Slightly lower-than-expected US inflation (May) and a decent $39bn 10-yr auction yesterday caused UST outperformance over Bunds. Yields dropped between 1 and 7.2 bps in a bull steepening move. The US 2-yr yield called off its adventure north of 4% once again. The next Fed rate cut remains fully priced in for October but the September odds rose from 65% to more than 80%. Expectations for June haven’t budged with the status quo the near-certain outcome. US VP Vance in the wake of the CPI release called the Fed’s sideline-approach monetary malpractice while president Trump again argued for a full percentage point cut. European rates were on the rise, particularly at the long end of the curve, before the inflation numbers broke their momentum to a certain extent. Net daily changes varied between flat (2-yr) and +3.5 bps (30-yr) for Germany. The US dollar fell with EUR/USD testing but eventually closing just shy of 1.15. It was just a matter of time though. The pair is moving ahead in Asian dealings, filling bids at 1.152 currently. The April/multi-year high of 1.1573 is only a whisker away. DXY is headed for the 98 April low in a mirror move. UK Chancellor Reeves’ spending review outlined three years of expenditures to build roads, railways, houses and energy projects but that didn’t inspire sterling bulls. The pound extended the drop that was instigated by Tuesday’s labour market report. EUR/GBP rose to its highest level in a month at around 0.848.
The economic calendar contains second-tier data only, including US PPIs and weekly jobless claims. CPIs yesterday showed no impact from US tariffs yet but that could be different for the more upstream producer prices. It should in theory offer a floor for (front-end) yields. Long-term bond markets are watching tonight’s $22bn 30-yr auction closely. It’s by far the most tricky sale this week and we wouldn’t draw any premature conclusions from the decent one on Tuesday (3-yr, short term) and yesterday (10-yr, the most wanted tenor on the curve). Some major funds have already declared a buyers’ strike. We hold a bearish bias on the US dollar with the technical picture increasingly looking worse. There remains a lot of US-grown uncertainty, first and foremost on trade. US Treasury Secretary Bessent before Congress yesterday hinted at an extension to the July 9 deadline (after which Liberation Day tariffs kick in again) if countries are negotiating in good faith. But president Trump overnight threatened to set unilateral tariff rates within two weeks, ahead of July 9. EUR/USD 1.1573 is the final meaningful hurdle for a full return to the 2021 high at 1.2349. Oil prices in commodity markets are worth following closely. Tensions between the US and Iran are rising. A 60-day deadline set by Trump to strike a nuclear deal expires today. The US’ warning to consider military options if diplomacy fails was met with a retaliatory tone by Iran. Brent crude shot up $4 on the barrel intraday before closing just south of $70, still the highest since the Liberation Day crash.
News & Views
Executive Director of Markets at the Bank of England, Vicky Saporta, indicated that banks should prepare for using the BOE’s routine liquidity facilities for liquidity management and not just as a backstop. These facilities aside from a short-term repo also contain a long-term (six months) repo facility. The BoE raised the weekly amount available for the term repo facility to £35 bln from £25 bln and total liquidity to be provided by the facility could go as high a £840 bln. The need for banks to switch to more repo funding comes as the BoE’s quantitative tightening (not reinvesting existing bonds and active sales) is reducing liquidity with markets gradually returning to the ‘preferred minimum range of reserves’. According to Saporta, the BoE might reach this level as soon as the second quarter of next year. "Firms must now fully consider the changing liquidity environment and their plans to source reserves within that," Saporta is quoted.
The government of Polish Prime Minister Tusk yesterday survived a confidence vote in Parliament (243-210). Tusk asked for the vote after the candidate of the Polish opposition, Karol Nawrocki, at the June 1 election became president. The vote is seen reconfirming the mandate of the new government and as well as the support of the coalition partners who are internally divided on the execution of the government program. In attempt of a new start, Tusk also announced a cabinet reshuffle. Even so, It is still expected that it will remain a bumpy road for the government going into the next parliamentary elections that are scheduled for late 2027. The zloty yesterday nevertheless rebounded to currently again trade near EURPLN 4.25.
Sterling Slides on Poor UK GDP, While Dollar Struggles Under Trade Uncertainty
Sterling came under renewed pressure at the start of European session, triggered by a deeper-than-expected contraction in UK GDP for April. Services sector, the economy’s dominant component, posted its first monthly decline since October. Nine out of 14 services subsectors registered falls, pointing to broad-based weakness. It's a disappointing start to Q2 and follows weaker-than-expected labor data earlier in the week.
The string of soft UK economic releases is likely to reinforce BoE’s case for policy easing. Market expectations for a rate cut in August are now firming, with investors betting that the BoE will continue its gradual loosening cycle. While the central bank has maintained a cautious stance thus far, the data flow increasingly supports action sooner rather than later, especially if core inflation continues to moderate alongside cooling wages and tepid output growth.
Meanwhile, Dollar remains the worst-performing major currency this week, despite receiving a brief reprieve from a strong 10-year Treasury auction on Wednesday. Market attention is now on today’s 30-year auction, which could provide further clues about investor confidence in US fiscal stability. A solid reception would help calm nerves around rising debt issuance.
However, the broader macro backdrop, particularly trade uncertainty, continues to weigh heavily on the greenback. Hopes that this week’s US-China talks would deliver material de-escalation were dashed after no tariffs were rolled back as part of the so-called framework deal. Instead, the absence of concrete outcomes, coupled with hints that the US may further delay its self-imposed 90-day tariff review deadline, has left markets in limbo.
Testifying before Congress, US Treasury Secretary Scott Bessent struck a more conciliatory tone, suggesting that Washington may extend the negotiation window with key trading partners—including the EU—if they are seen to be acting in "good faith". While this may avert immediate tariff escalation, it also signals that trade talks could drag on well into the second half of the year. That lack of resolution is weighing on sentiment and feeding into a mild risk-off tone across markets.
In terms of weekly currency performance, Euro is the clear outperformer, while Yen and Swiss Franc are also benefiting from safe-haven flows. At the other end of the spectrum, Dollar leads the laggards, followed by the Aussie and Sterling. The Loonie and Kiwi are trading more neutrally. Overall, markets are showing a tilt toward risk aversion.
Technically, an immediate focus is now on 38.2% retracement of 0.8737 to 0.8354 at 0.8500. in EUR/GBP. Decisive break there will suggest that fall from 0.8737 has completed at 0.8354. Even as a corrective bounce, rise from there would target 61.8% retracement at 0.8591.

In Asia, Nikkei closed down -0.65%. Hong Kong HSI is down -0.89%. China Shanghai SSE is up 0.03%. Singapore Strait Times is up 0.21%. Japan 10-year JGB yield fell -0.002 to 1.458. Overnight, DOW closed down -0.00%. S&P 500 fell -0.27%. NASDAQ fell -0.50%. 10-year yield fell sharply by -0.062 to 4.412.
UK GDP contracts -0.3% mom in April, as services drag
The UK economy contracted -0.3% mom in April, a sharper decline than the expected -0.1%. The main drag came from the services sector, which fell -0.4% mom and contributed most to the monthly GDP drop. Production also shrank -0.6% mom. In contrast, construction provided a rare bright spot, rising 0.9% mom, though not enough to offset broader weakness.
Despite the poor April print, the broader picture remains more constructive. GDP expanded 0.7% in the three months to April compared to the prior three-month period, with services up 0.6%, production up 1.1%, and construction up 0.5%.
Japanese business confidence sours amid tariff fears and profit warnings
Business sentiment in Japan deteriorated sharply in Q2, with the Ministry of Finance’s survey revealing a broad-based loss of confidence across industries.
The overall index for large firms slipped into negative territory at -1.09, down from Q1’s modest 2.0. Large manufacturers saw sentiment weaken further from -2.4 to -4.8, while large non-manufacturers experienced a steep drop from 5.2 to -5.7, suggesting that economic uncertainty is spreading beyond export-heavy sectors.
The survey also highlighted a growing sense of earnings pessimism. Large manufacturers now expect recurring profits to decline -1.2% in the fiscal year ending March 2026, a downgrade from the -0.6% fall seen in the previous survey. Particularly alarming is the auto sector's outlook, with automakers and parts suppliers projecting a severe -19.8% drop in profits.
This highlights the mounting concern over the impact of steep US tariffs, which threaten to hit Japan’s flagship export industry hard and weigh on broader economic momentum.
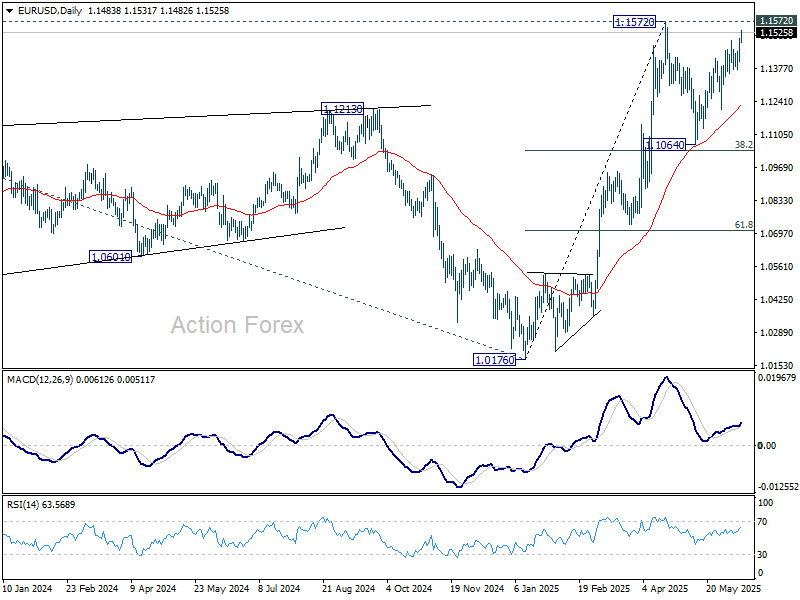
EUR/USD Daily Outlook
Daily Pivots: (S1) 1.1429; (P) 1.1465; (R1) 1.1524; More...
EUR/USD's rise from 1.1064 resumed by breaking through 1.1494 and intraday bias is back on the upside for 1.1572 high. Strong resistance could be seen there to bring another fall, to extend the near term consolidation pattern. Firm break of 1.1404 support will turn intraday bias back to the downside for 1.1209 first. However, decisive break of 1.1572 will resume whole rise from 1.0176.
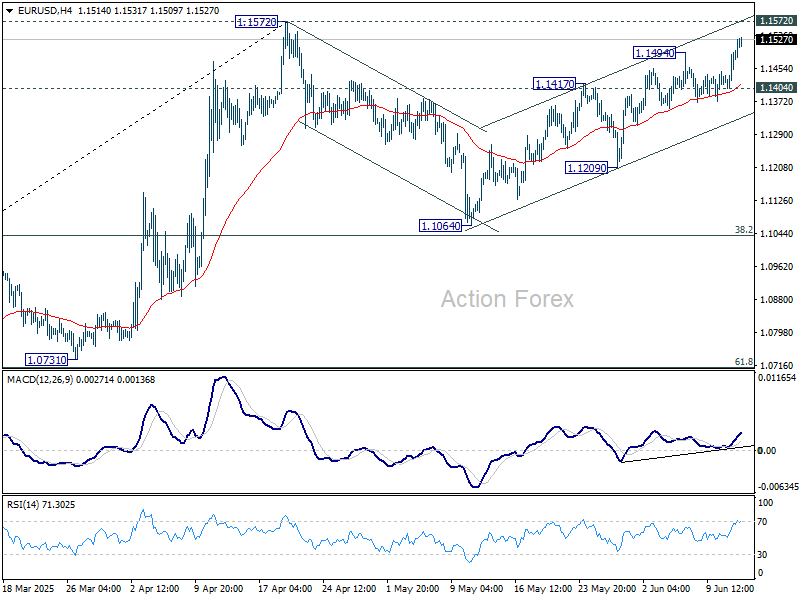
In the bigger picture, rise from 0.9534 long term bottom could be correcting the multi-decade downtrend or the start of a long term up trend. In either case, further rise should be seen to 100% projection of 0.9534 to 1.1274 from 1.0176 at 1.1916. This will now remain the favored case as long as 55 W EMA (now at 1.0894) holds.
EUR/USD Rallies Past 1.1500 as USD Tumbles on Fresh Tariff Threat
The relief that the US and China may have reached some kind of agreement that could relax Chinese exports of rare earth metals to the US—in exchange for allowing more Chinese students to study at US universities, was short-lived, as many sticky points remain uncertain beyond these cited concessions. Trump apparently expects the tariffs to stay as they were set in Geneva, meaning 10% on US exports to China and 55% on Chinese exports to the US, while there’s no news regarding US technology exports to China. In summary, it looks like the US got what it wanted in the critical rare earth area, but China is walking away from the table with little more than a few student visas... I don’t think this smells good.
Even less so, as there are rumours that the EU will hardly ink a deal before the July deadline, and Trump has threatened other Asian nations with fresh tariffs, saying his administration will send letters within two weeks to inform them of unilateral tariffs as a pressure tactic. US Treasury Secretary Bessent, on the other hand, suggested that they could extend the deadline by 90 more days if they believe “good faith” efforts are being made.
So, optimism is waning. The Hang Seng Index is down after yesterday’s peak, the Nikkei is trading lower, the CSI 300 is flat, stocks in Australia are showing toppish signs near February highs, while US and European futures all point to a bearish start today.
Yesterday, the S&P 500 advanced to a fresh high since February after the US CPI update printed weaker-than-expected inflation numbers on both a monthly and yearly basis. That fueled dovish Federal Reserve (Fed) expectations and sent the US 2-year yield lower, boosting stock valuations. The 10-year yield also eased to 4.40% following a relatively strong 10-year bond auction. But the post-CPI rally was short-lived as investors quickly moved to the sidelines ahead of today’s much-watched 30-year bond auction, which could—maybe—remind investors about the US’ exploding and unsustainable debt levels.
But if today’s auction goes well, there’s a chance that US debt concerns ease—yes, yes, markets are not always rational. And easing debt worries, if not accompanied by souring trade headlines, could support equities. A weak auction, on the other hand, could revive debt concerns, send long-term yields higher, and weigh on mood—especially alongside wobbly trade headlines.
USD tumbles
The US dollar is significantly lower following the CPI release and renewed tariff and debt concerns. The EURUSD finally cleared the 1.15 offers and is consolidating above that level, while CAble is back above the 1.35 mark. Reeve’s announcement of spending details had little market impact— no surprise is a good surprise, here. The USDJPY is breaking below its 50-DMA support on broad USD weakness, while gold is up for a second session as the yellow metal regains safe-haven demand amid waning trade optimism.
Good news from tech
Oracle jumped 7.5% in after-hours trading on a set of better-than-expected quarterly results and a bullish AI-driven outlook. The company said its Cloud Infrastructure revenue rose 52% year-on-year and is expected to grow over 70% in fiscal 2026. Capex is projected to exceed $21 billion in fiscal 2025—up sharply from under $7 billion the prior year—highlighting that AI investments remain undeniably strong.
Nvidia, a major barometer of AI investments, topped near the $145 per share level yesterday and should feel the positive momentum from supportive AI news—and more! Because Jensen Huang is paving the way toward a potentially massive new revenue stream: quantum computing. Speaking in Paris yesterday, he said the industry is reaching an inflection point and could already help ‘solve some interesting problems’ in the coming years, marking a notable shift from his previous stance in January that useful quantum computers were probably ‘decades away.’ That day, he sent quantum stocks tumbling. Yesterday, he sent some of them rallying. Quantum Computing Inc. jumped more than 25%, though not all names held onto their gains. Defiance’s Quantum ETF ended the day slightly lower, after hitting a fresh all-time high. Still, the pace remains exciting for tech investors.
Back to Nvidia: their chips could support quantum tech, and their entire quantum algorithm stack will reportedly be available and accelerated on the Grace Blackwell 200 chip, writes Bloomberg. Huang also said Europe’s computing capacity will grow tenfold over the next two years and announced a partnership with France’s Mistral AI to build an AI cloud together. Nasdaq’s Europe Tech Index hit a fresh high yesterday.