Sample Category Title
USD/CHF Daily Outlook
Daily Pivots: (S1) 0.8067; (P) 0.8138; (R1) 0.8174; More….
Intraday bias in USD/CHF remains on the downside, with immediate focus now on 0.8038 low. Strong support could be seen there to bring rebound, and above 0.816 support turned resistance will turn intraday bias neutral first. However, firm break of 0.8038 will resume larger down trend. Next target will be 61.8% projection of 0.9200 to 0.8038 from 0.8475 at 0.7757.
In the bigger picture, long term down trend from 1.0342 (2017 high) is still in progress and met 61.8% projection of 1.0146 (2022 high) to 0.8332 from 0.9200 at 0.8079 already. In any case, outlook will stay bearish as long as 55 W EMA (now at 0.8696) holds. Sustained break of 0.8079 will target 100% projection at 0.7382.
Markets Slide as Israel Strikes Iran, Safe Havens Climb
Asia-Pacific equities slumped today after Israel launched a military strike on Iran, targeting nuclear facilities and escalating geopolitical tensions in the region. The strike, which came without US support, was followed by a sharp vow of retaliation from Tehran. The immediate reaction saw oil prices spike nearly 9%, as traders rushed to price in potential supply disruptions across the Middle East. The risk-off mood gripped markets across asset classes, dragging equities lower and boosting safe havens.
Gold, Swiss Franc, and Yen all climbed as investors sought shelter from the rising uncertainty. Meanwhile, Dollar also found some renewed strength as it recovered, after broader weakness earlier in the week triggered by softer-than-expected inflation data and rising odds of a September Fed rate cut.
On the other hand, Kiwi led the declines, pressured by both heightened risk aversion and a sharp contraction in local manufacturing activity. Kiwi was followed closely by Aussie and Sterling. Loonie managed to hold mid-pack, underpinned partially by the surge in oil prices. Euro also traded with relative calm, despite the Middle East tensions, as ECB’s message this week has helped anchor expectations that easing cycle may be drawing to a close.
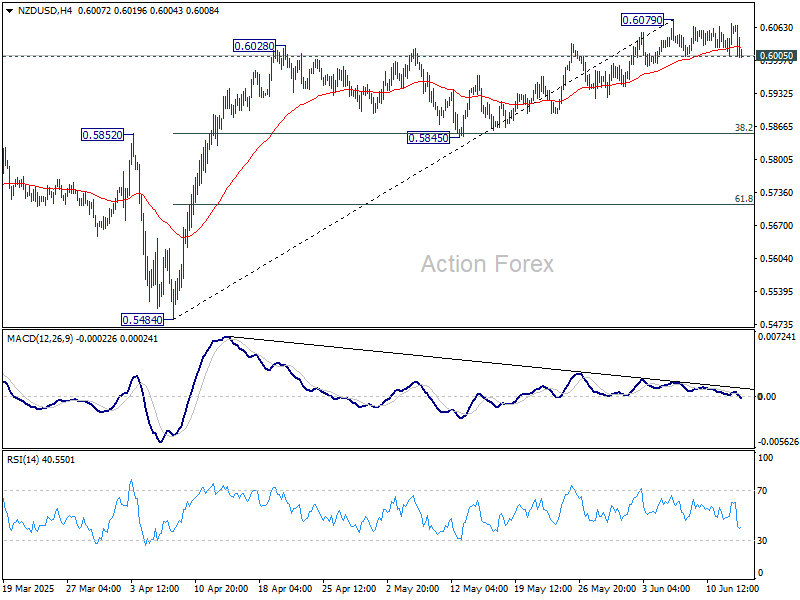
Technically, NZD/USD's upside momentum has been rather week with the choppy rise from 0.5845. Firm break of 0.6005 support should confirm short term topping. It would be a bit early to conclude the that rally from 0.5484 has completed. But even as correction, fall from 0.6079 would extend to 0.5845 cluster support (38.2% retracement of 0.5484 to 0.6079 at 0.5852).
In Asia, at the time of writing, Nikkei is down -1.15%. Hong Kong HSI is down -0.98%. China Shanghai SSE is down -0.83%. Singapore Strait Times is down -0.45%. Japan 10-year JGB yield is down -0.05 at 1.41. Overnight, DOW rose 0.24%. S&P 500 rose 0.38%. NASDAQ rose 0.24%. 10-year yield fell -0.055 to 4.357.
Looking ahead, Eurozone industrial production and trade balance are the main features in European session. Later in the day, Canada will release manufacturing sales and wholesale sales. US will publish U of Michigan consumer sentiment.
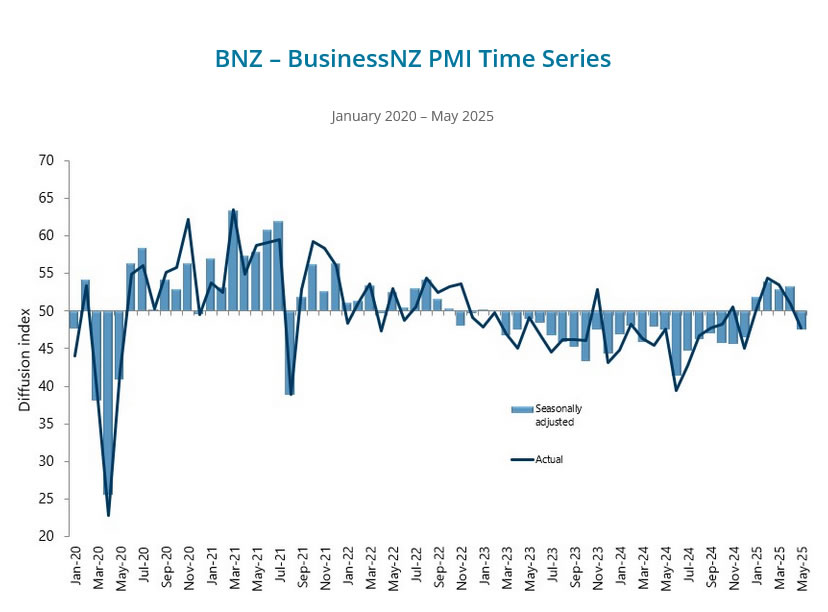
NZ BNZ manufacturing fall to 47.5, slumps back into contraction
New Zealand’s manufacturing sector slipped sharply back into contraction in May, with the BusinessNZ Performance of Manufacturing Index plunging from 53.3 to 47.5. The reading not only marks a decisive reversal from April's expansion but also sits well below the historical average of 52.5.
Key components of the index showed broad-based weakness: production dropped from 53.0 to 48.7, employment tumbled from 54.6 to 45.7, and new orders fell sharply from 50.8 to 45.3—all signaling deteriorating activity across the sector.
The sharp decline was echoed in business sentiment, with 64.5% of survey respondents offering negative comments—up from 58% in April. The commentary reflects a growing sense of pessimism as manufacturers grapple with falling demand, weak forward orders, and subdued consumer spending. Rising input costs, ongoing economic uncertainty, and stalled investment plans are compounding pressures.
BNZ’s Senior Economist Doug Steel said that “the New Zealand economy can claw its way forward over the course of 2025, but the PMI is yet another indicator that suggests an increased risk that the bounce in GDP reported for Q4, 2024 and Q1, 2025 could come to a grinding halt”.
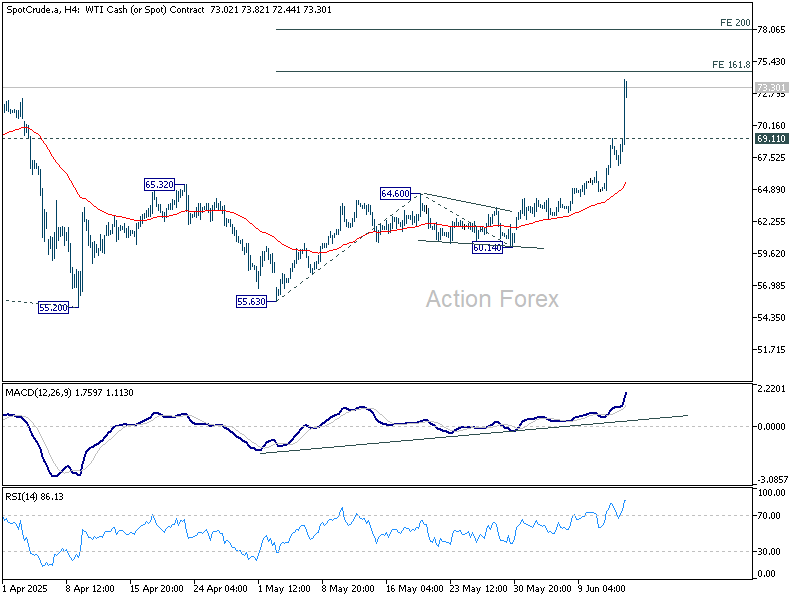
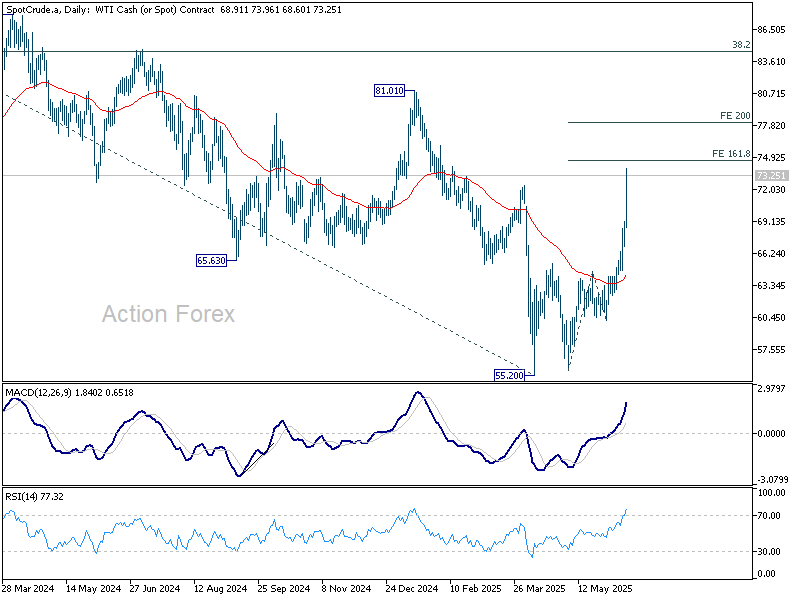
WTI oil soars on Israel-Iran escalation, but resistance looms near 78
Crude oil prices surged sharply following news that Israel had launched direct airstrikes against Iran, targeting its nuclear and ballistic missile infrastructure. WTI crude is now trading more than 30% above its April low of 55.20, as geopolitical tensions in the Middle East reignite supply risk concerns.
Israeli Prime Minister Benjamin Netanyahu confirmed that the military had struck Iran’s Natanz enrichment site, leading nuclear scientists, and the core of its missile program, vowing to continue operations “for as many days as it takes to remove this threat.”
The military action was carried out without coordination with Washington. US Secretary of State Marco Rubio emphasized that Israel acted unilaterally and that the US was not involved in the strikes.
Technically, despite the sharp rally in WTI oil, strong resistance is expected between 74.65 and 78.08 to limit upside 161.8% projection of 55.63 to 64.60 from 60.14. at 74.65 and 200% projection at 78.08), on overbought condition. Break of 69.11 resistance turned support would indicate that the current buying wave has likely peaked.
Still, the path forward depends heavily on how geopolitical events unfold. Should the conflict escalate further or draw in regional actors, a break above the resistance zone could open the door to a test of 81.01, a level that marks the potential start of a broader bullish reversal in the longer-term oil trend.
USD/CHF Daily Outlook
Daily Pivots: (S1) 0.8067; (P) 0.8138; (R1) 0.8174; More….
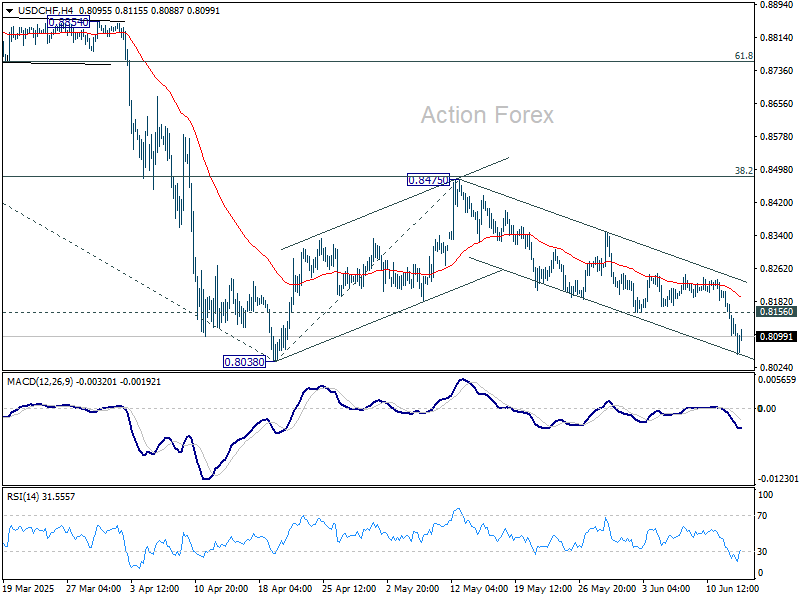
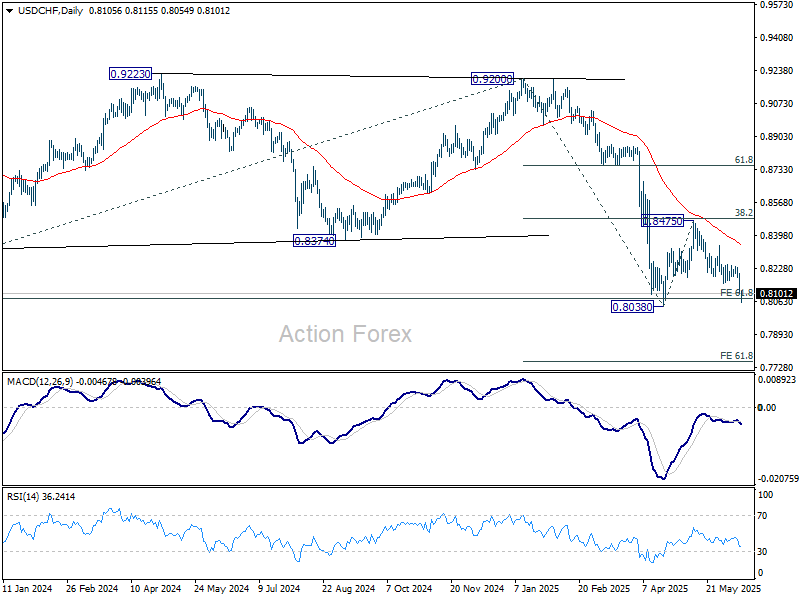
Intraday bias in USD/CHF remains on the downside, with immediate focus now on 0.8038 low. Strong support could be seen there to bring rebound, and above 0.816 support turned resistance will turn intraday bias neutral first. However, firm break of 0.8038 will resume larger down trend. Next target will be 61.8% projection of 0.9200 to 0.8038 from 0.8475 at 0.7757.
In the bigger picture, long term down trend from 1.0342 (2017 high) is still in progress and met 61.8% projection of 1.0146 (2022 high) to 0.8332 from 0.9200 at 0.8079 already. In any case, outlook will stay bearish as long as 55 W EMA (now at 0.8696) holds. Sustained break of 0.8079 will target 100% projection at 0.7382.
Cliff Notes: Necessary Relief
Key insights from the week that was.
In Australia, the Westpac-MI Consumer Sentiment index posted a slight increase of 0.5% in June. At 92.6, the headline index remains well above the deep lows over 2022-24, but still some way below the neutral threshold of 100, consistent with a degree of ‘cautious pessimism’. Offshore developments are still weighing on consumer’s minds, with 77% of respondents recalling news on the topic as ‘unfavourable’. While the lower-inflation environment has certainly aided sentiment, the real per capita income decline of recent years means consumers remain hesitant to increase discretionary spending. Indeed, views on family finances versus a year ago and expectations for the year-ahead remain almost 14% and 7% below their respective long-run averages; meanwhile, the ‘time to buy a major household item’ sub-index is still 19% below its long-run average.
It is also notable that the more constructive outlook for inflation has seen consumers become more confident in the prospects for interest rate cuts – a sentiment we share. This week, we revised down our forecasts for inflation, incorporating a faster unwind of population growth in the near-term and downside risks to activity; we now expect underlying (trimmed mean) inflation to fall below the mid-point of the target band for a time. As discussed by Chief Economist Luci Ellis, these developments are likely to see the RBA’s policy easing cycle extend into the first half of 2026, seeing the cash rate trough at the lower end of our estimate of the neutral range at 2.85%.
Emphasising the downside risks to activity growth, the latest NAB business survey was weak. The business conditions index, having been trapped in a consistent downtrend for the past three years, fell to 0 in May. This is the weakest reading since the pandemic and suggests private demand may remain on a shaky footing through mid-year. Encouragingly, Australian businesses seem broadly unphased by offshore developments. Although, with the confidence index hovering around a neutral level of 0, the survey is hardly signalling a near-term rally in economic activity.
In the US meanwhile, both the CPI and PPI came in under expectations in May. Headline and core consumer prices rose 0.1% in the month, leaving the annual rates little changed at 2.4%yr for headline and 2.8%yr for core. The downward pressure in the month came from easing energy and services prices, while core goods prices were flat. The PPI also underperformed, rising just 0.1% following an upwardly revised -0.2% result in April. On an annual basis, PPI inflation rose 2.6% while the ex. food and energy measure gained 3.0%. Given how quickly the tariffs were walked back, it isn’t surprising there was little evidence of trade policy impacting prices for US consumers and businesses. Weakening consumer demand and an aggressive pull-forward of inventory stocking before May’s announcement are additional reasons to suspect that the tariff effect for inflation will be slow to come through, particularly at the consumer level.
Across the pond, UK labour market figures also came in softer than anticipated. The unemployment rate for April ticked up slightly to 4.6% but remains below the BoE’s forecast of 4.75% for the year. Wages growth also decelerated to 5.3%yr from a revised 5.6%yr, consistent with other indicators such as the Decision Maker Panel which points to a further deceleration in the year ahead. These developments jar with the recent acceleration in the CPI, making the BoE’s task of balancing growth and inflation difficult. Recall that at its last meeting, the committee was split three ways, with the decision to cut only narrowly winning. Another CPI print is due next week, but more than likely it will again point to sustained risks for inflation and consequently the need for a gradual approach to policy easing.
Finally to China. There, prices continued to decline, the CPI down 0.1%yr in May and the PPI 3.3%yr lower. These results reflect the ongoing expansion of excess capacity across the economy and soft consumer demand. Chinese trade data in the week also revealed a moderation in exports growth to 4.8%yr as exports to the US jolted lower; however, imports declining by 3.4%yr, keeping the trade surplus near record levels at USD103bn.
Elliott Wave Analysis: USDCHF Resumes Bearish Trend
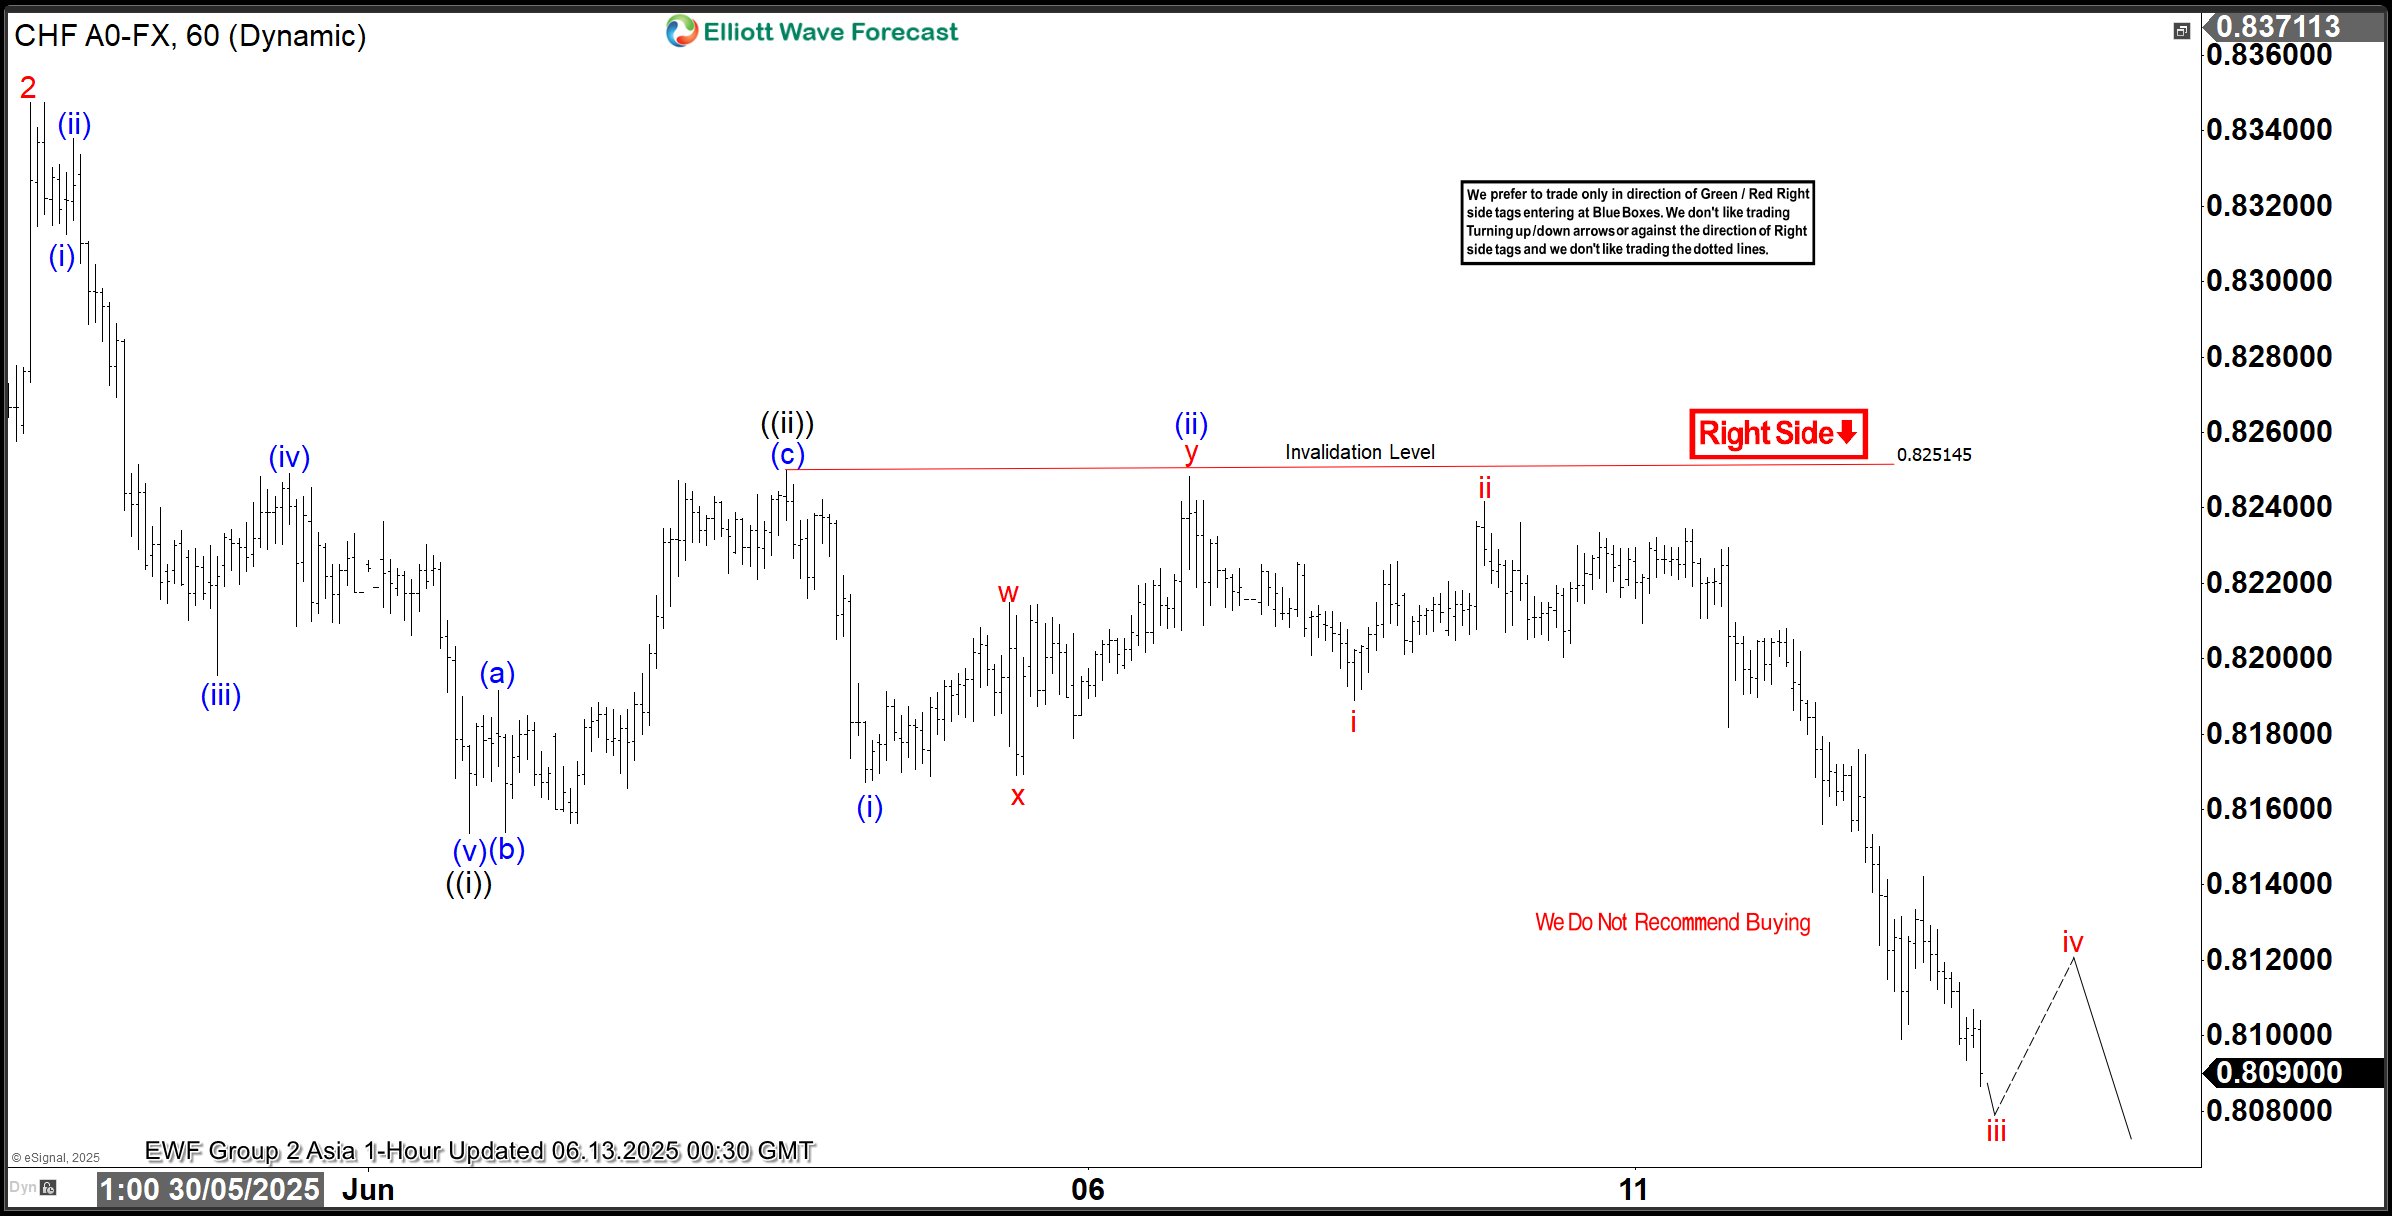
The USDCHF currency pair has been declining since its peak on May 13, 2025. It follows a pattern that technical analysts identify as an impulsive wave with an extended structure, often referred to as a “nest.” This analysis tracks the pair’s movement through a series of waves, as observed on the 1-hour chart. It provides insight into its short-term trajectory and potential future movements.
Starting from the May 13 high, the initial decline, labeled wave 1, concluded at 0.8184. This was followed by a corrective rally in wave 2, which peaked at 0.8347. From there, the pair resumed its downward trend in wave 3. The wave 3 has unfolded with further subdivisions, forming another impulsive pattern in a lesser degree. Specifically, from the wave 2 high, the first sub-wave (i) ended at 0.8312, followed by a brief rally in wave (ii) to 0.8338. The pair then extended lower in wave (iii), reaching 0.8195, before a corrective wave (iv) rallied to 0.8249. The subsequent decline in wave (v) completed at 0.8153, finalizing wave ((i)) of the larger structure.
Following this, a recovery rally in wave ((ii)) reached 0.8250 before the pair turned lower again in wave ((iii)). Within this segment, the first sub-wave (i) ended at 0.8167, and a corrective wave (ii) rallied to 0.8248. In the near term, as long as the pair remains below 0.8250, any rallies are expected to fail after 3, 7, or 11 swings, with the pair likely to extend lower. This analysis suggests continued bearish momentum, with traders advised to monitor key levels for confirmation of further downside.
USDCHF 60-Minute Elliott Wave Technical Chart
USDCHF Elliott Wave Technical Video
https://www.youtube.com/watch?v=24B8HFTaLW0
WTI oil soars on Israel-Iran escalation, but resistance looms near 78
Crude oil prices surged sharply following news that Israel had launched direct airstrikes against Iran, targeting its nuclear and ballistic missile infrastructure. WTI crude is now trading more than 30% above its April low of 55.20, as geopolitical tensions in the Middle East reignite supply risk concerns.
Israeli Prime Minister Benjamin Netanyahu confirmed that the military had struck Iran’s Natanz enrichment site, leading nuclear scientists, and the core of its missile program, vowing to continue operations “for as many days as it takes to remove this threat.”
The military action was carried out without coordination with Washington. US Secretary of State Marco Rubio emphasized that Israel acted unilaterally and that the US was not involved in the strikes.
Technically, despite the sharp rally in WTI oil, strong resistance is expected between 74.65 and 78.08 to limit upside 161.8% projection of 55.63 to 64.60 from 60.14. at 74.65 and 200% projection at 78.08), on overbought condition. Break of 69.11 resistance turned support would indicate that the current buying wave has likely peaked.
Still, the path forward depends heavily on how geopolitical events unfold. Should the conflict escalate further or draw in regional actors, a break above the resistance zone could open the door to a test of 81.01, a level that marks the potential start of a broader bullish reversal in the longer-term oil trend.
NZ BNZ manufacturing fall to 47.5, slumps back into contraction
New Zealand’s manufacturing sector slipped sharply back into contraction in May, with the BusinessNZ Performance of Manufacturing Index plunging from 53.3 to 47.5. The reading not only marks a decisive reversal from April's expansion but also sits well below the historical average of 52.5.
Key components of the index showed broad-based weakness: production dropped from 53.0 to 48.7, employment tumbled from 54.6 to 45.7, and new orders fell sharply from 50.8 to 45.3—all signaling deteriorating activity across the sector.
The sharp decline was echoed in business sentiment, with 64.5% of survey respondents offering negative comments—up from 58% in April. The commentary reflects a growing sense of pessimism as manufacturers grapple with falling demand, weak forward orders, and subdued consumer spending. Rising input costs, ongoing economic uncertainty, and stalled investment plans are compounding pressures.
BNZ’s Senior Economist Doug Steel said that “the New Zealand economy can claw its way forward over the course of 2025, but the PMI is yet another indicator that suggests an increased risk that the bounce in GDP reported for Q4, 2024 and Q1, 2025 could come to a grinding halt”.
USD/JPY Slides in Steep Move—Is a Deeper Pullback Brewing?
Key Highlights
- USD/JPY started a fresh decline below the 144.50 support level.
- It traded below a bullish trend line with support at 144.85 on the 4-hour chart.
- EUR/USD extended gains and traded above the 1.1550 resistance.
- GBP/USD is now consolidating gains near the 1.3600 zone.
USD/JPY Technical Analysis
The US Dollar started a fresh decline from the 145.50 zone against the Japanese Yen. USD/JPY traded below the 144.50 and 144.20 support levels.
Looking at the 4-hour chart, the pair settled below the 144.20 level, the 100 simple moving average (red, 4-hour), and the 200 simple moving average (green, 4-hour). Besides, it traded below a bullish trend line with support at 144.85.
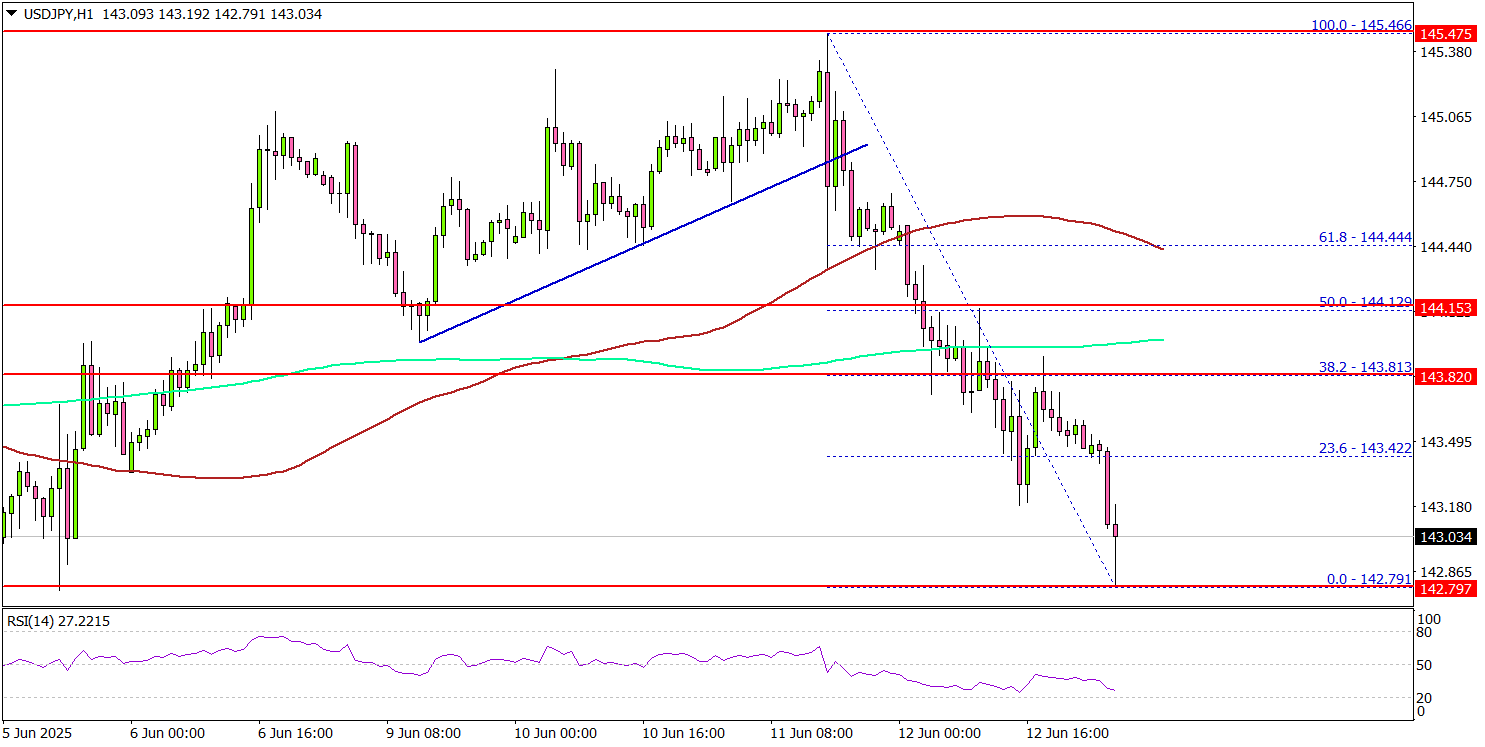
The pair tested the 142.80 zone and is currently consolidating losses. On the downside, immediate support is near the 142.80 level. The next key support sits near 142.20.
Any more losses could send the pair toward the 141.20 pivot level. The main support could be near 140.00. On the upside, the pair could face resistance near the 143.40 level. The next key resistance sits near the 144.20 level.
The first major resistance sits at 144.50. A close above the 144.50 level could set the pace for another increase. In the stated case, the pair could even clear the 145.50 resistance. The next major stop for the bulls could be near the 146.20 resistance.
Looking at EUR/USD, the pair started another increase, and the bulls seem were able to clear the 1.1550 level.
Upcoming Economic Events:
- Michigan Consumer Sentiment Index for June 2025 (Prelim) – Forecast 53.5, versus 52.2 previous.
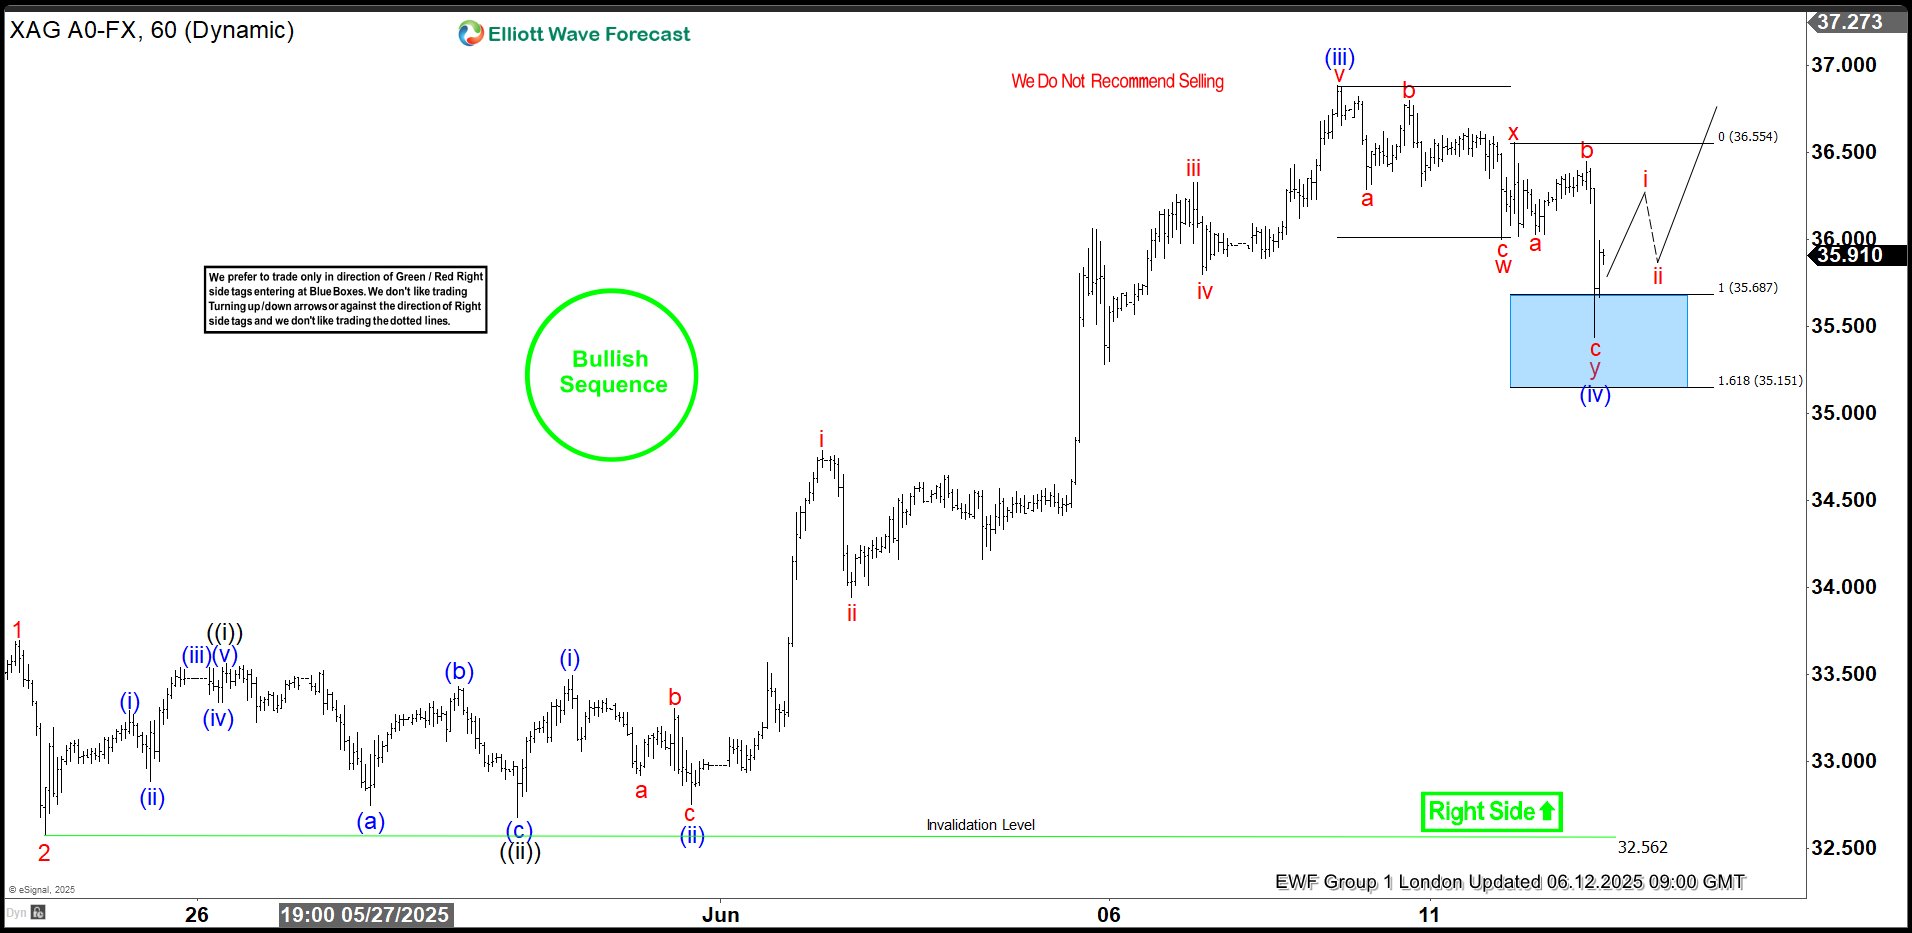
Silver (XAGUSD) Elliott Wave: Intraday Blue Box Buying Opportunity
Hello traders. As our members know, we have had many profitable trading setups recently. In this technical article, we are going to talk about another Elliott Wave trading setup we got in Silver (XAGUSD). The commodity has completed its correction exactly at the Equal Legs zone, also known as the Blue Box Area. In this article, we’ll break down the Elliott Wave Forecast and explain the logic behind the trading setup in detail.
SILVER Elliott Wave 4 Hour Chart 06.12.2025
The pull back has form of Elliott Wave Double Three pattern. Silver has reached the extreme zone at 35.687-35.151 (buying area). We expect buyers to appear there for another higher or 3 waves bounce at least. Once the price reaches the 50% Fibonacci retracement against the red x connector, we’ll make the position risk-free by moving the stop loss to breakeven and booking partial profits.
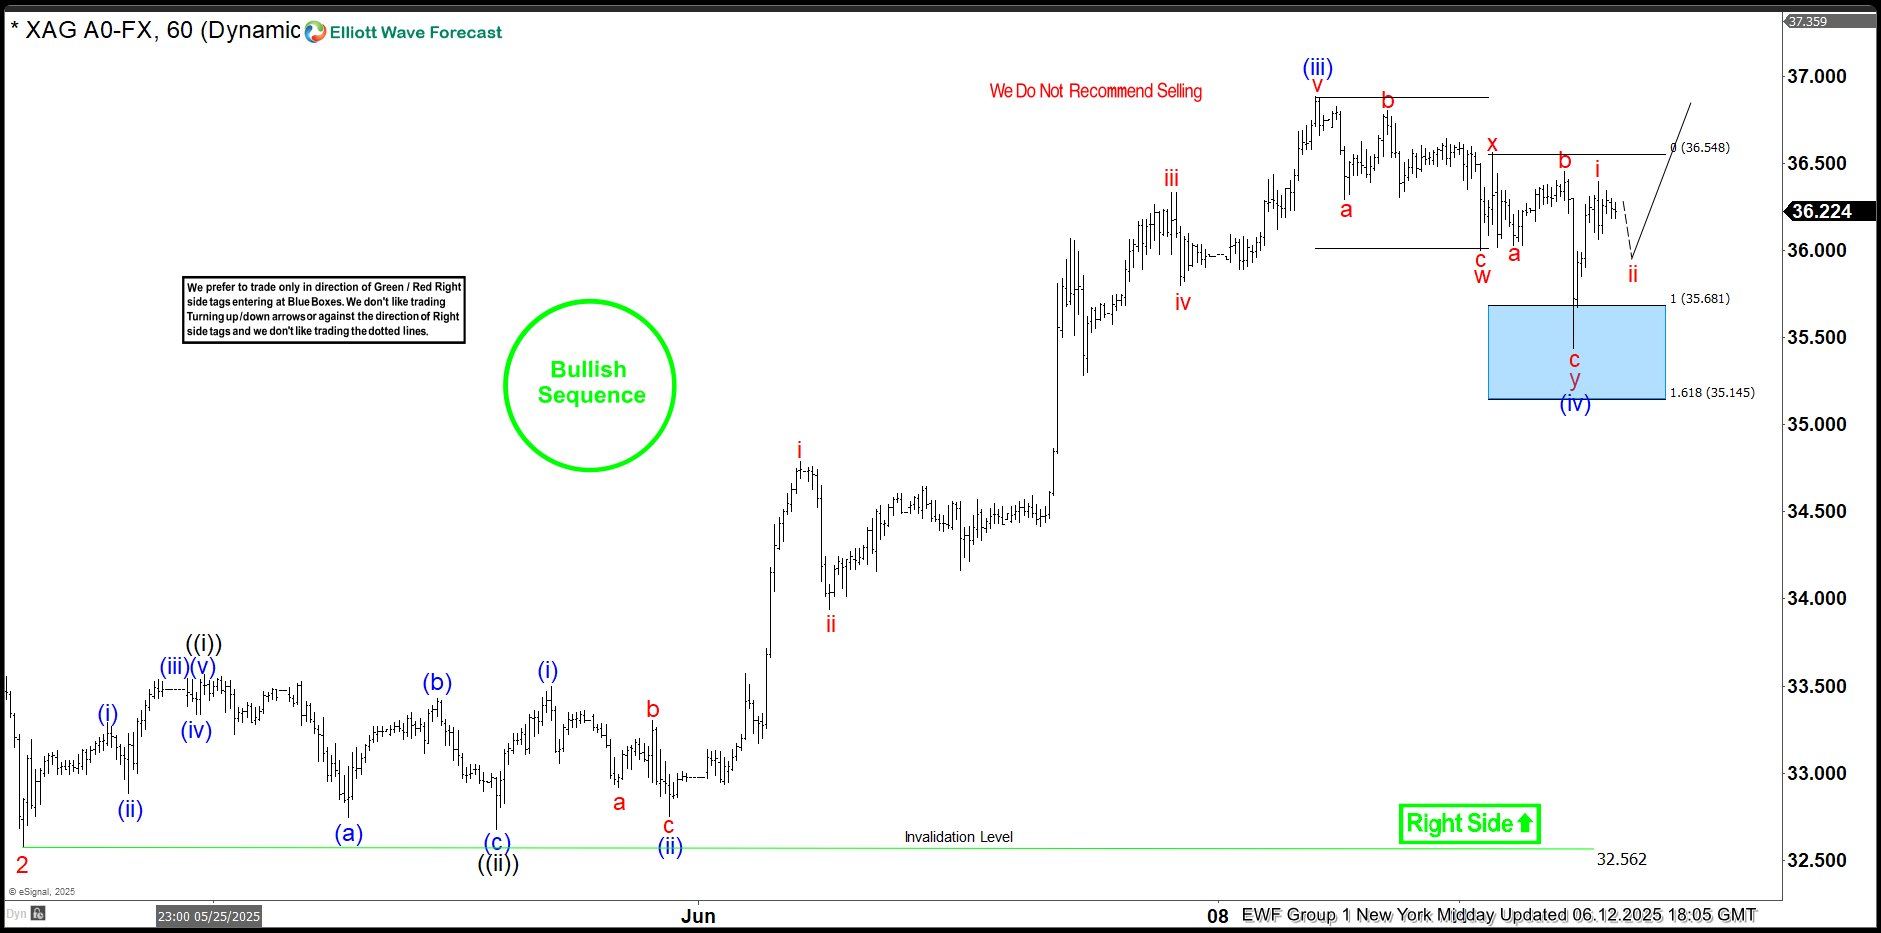
SILVER Elliott Wave 4 Hour Chart 06.12.2025
Silver found buyers as expected at the Blue Box area, making decent bounce. The price has reached and exceeded 50 fibs from the x red connector. Consequently, any long positions from the Blue Box should now be risk-free. We’ve set our stop loss at breakeven and have already secured partial profits. While above the last low 35.473, we count (iv) correction completed. Wave (v) can be in progress toward new highs, targeting 37.236-37.781.
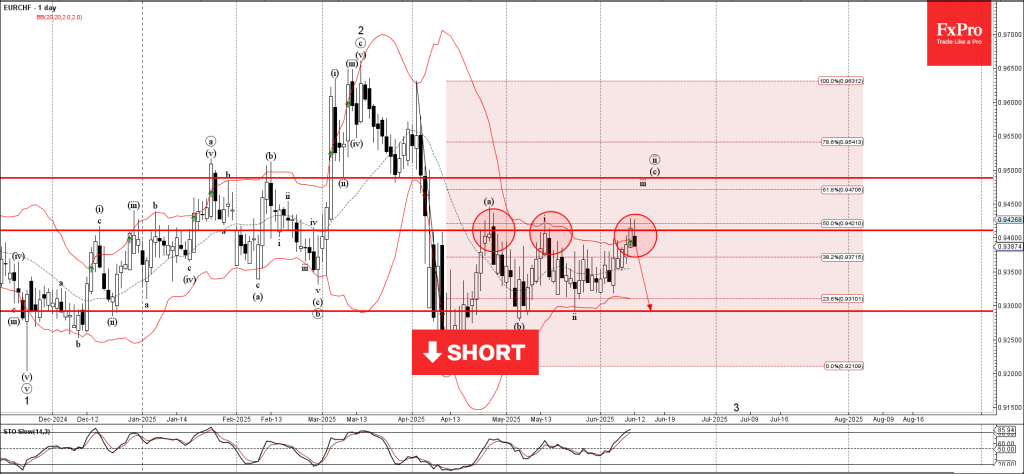
EURCHF Wave Analysis
EURCHF: ⬇️ Sell
- EURCHF reversed from the resistance zone
- Likely to fall to support level 0.9300
EURCHF currency pair recently reversed down from the resistance zone between the key resistance level 0.9410 (which has been reversing the price from April), the upper daily Bollinger Band and the 50% Fibonacci correction of the downward impulse from April.
The downward reversal from this resistance zone stopped the (c)-wave of the previous ABC correction ii.
Given the overbought daily Stochastic, EURCHF currency pair can be expected to fall to the next support level 0.9300 (which stopped earlier waves b and ii).
USDCHF Wave Analysis
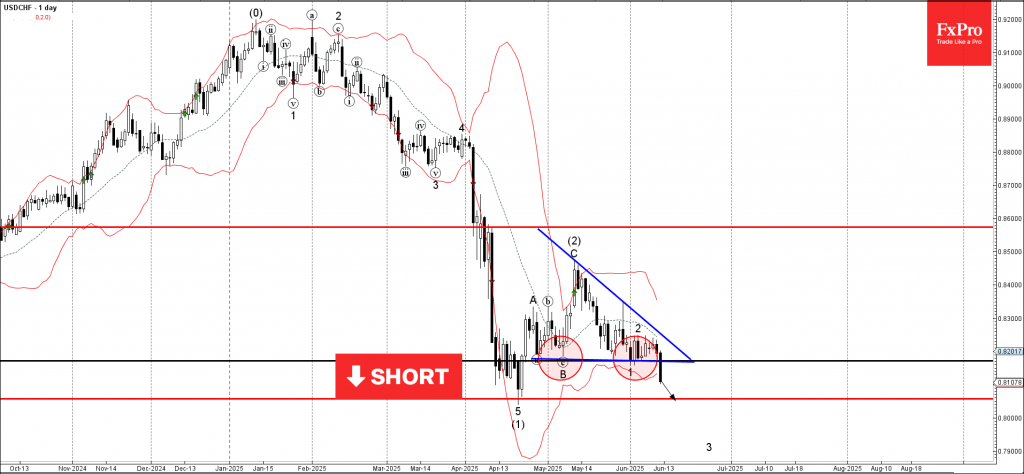
USDCHF: ⬇️ Sell
- USDCHF broke support level 0.8170
- Likely to fall to support level 0.8050
USDCHF currency pair recently broke the key support level 0.8170, which stopped the previous waves B and 1, as can be seen below.
The breakout of the support level 0.8170 coincided with the breakout of the daily Descending Triangle from the end of April.
USDCHF currency pair can be expected to fall to the next support level 0.8050 (low of the impulse wave (1) from April).