Sample Category Title
U.S. Fed to Holds Rates as Canada’s Retail Sales Show Resilience amid Tariffs
The U.S. Federal Reserve is widely expected to forego an interest rate cut again on Wednesday. The central bank has been on pause since December after cutting the fed funds rate by 100 basis points in the second half of 2024.
Policymakers will likely maintain a cautious approach given high levels of uncertainty about the impact of the ongoing trade war on growth and inflation. U.S. labour markets have shown signs of gradual cooling this year, and inflation surprised to the downside in April and May.
We continue to expect the Fed will ultimately cut interest rates later this year (starting in September), but for now remains in a wait and see mode—assessing the risk that elevated tariffs could eventually weigh more heavily on growth, but also push inflation higher.
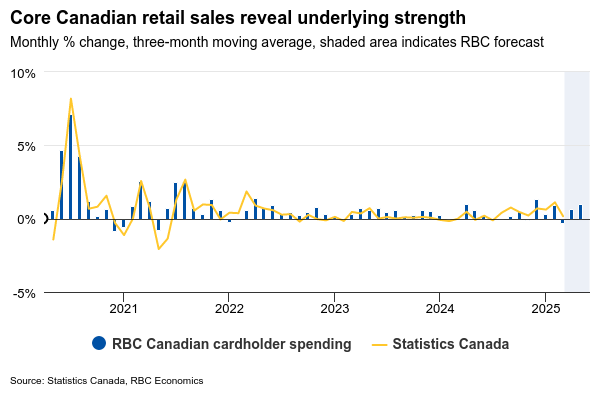
In Canada, Friday’s April retail sales will be closely watched for further signs that consumer spending is outperforming a sharp pullback in consumer confidence surveys this spring. Statistics Canada’s advance retail indicator for April showed pre-tax sales rose by 0.5%, building on a solid 0.8% gain in March. Those gains have been consistent with our RBC Canadian cardholder spending tracker, pointing to further strength in May.
Auto sales pulled back in April and May, but only partially reversed a jump in March (by our count) when buyers rushed to purchase cars ahead of threatened auto tariffs. Core retail sales, which exclude volatile components like gasoline and auto spending, remained relatively resilient in both months, according to our estimates, further hinting at underlying strength in consumer demand.
But, even with these encouraging near term trends, we expect household consumption to slow during the second half of the year. Despite the de-escalation of tariff rhetoric over the past month, persistent uncertainty continues to weigh on consumer confidence, which remains near historic lows even with May’s marginal rebound.
Moving forward, we anticipate consumers will likely remain cautious about big-ticket purchases, such as autos and homes, as ongoing uncertainty about tariff policies continue to dampen buyer sentiment.
Week ahead data watch
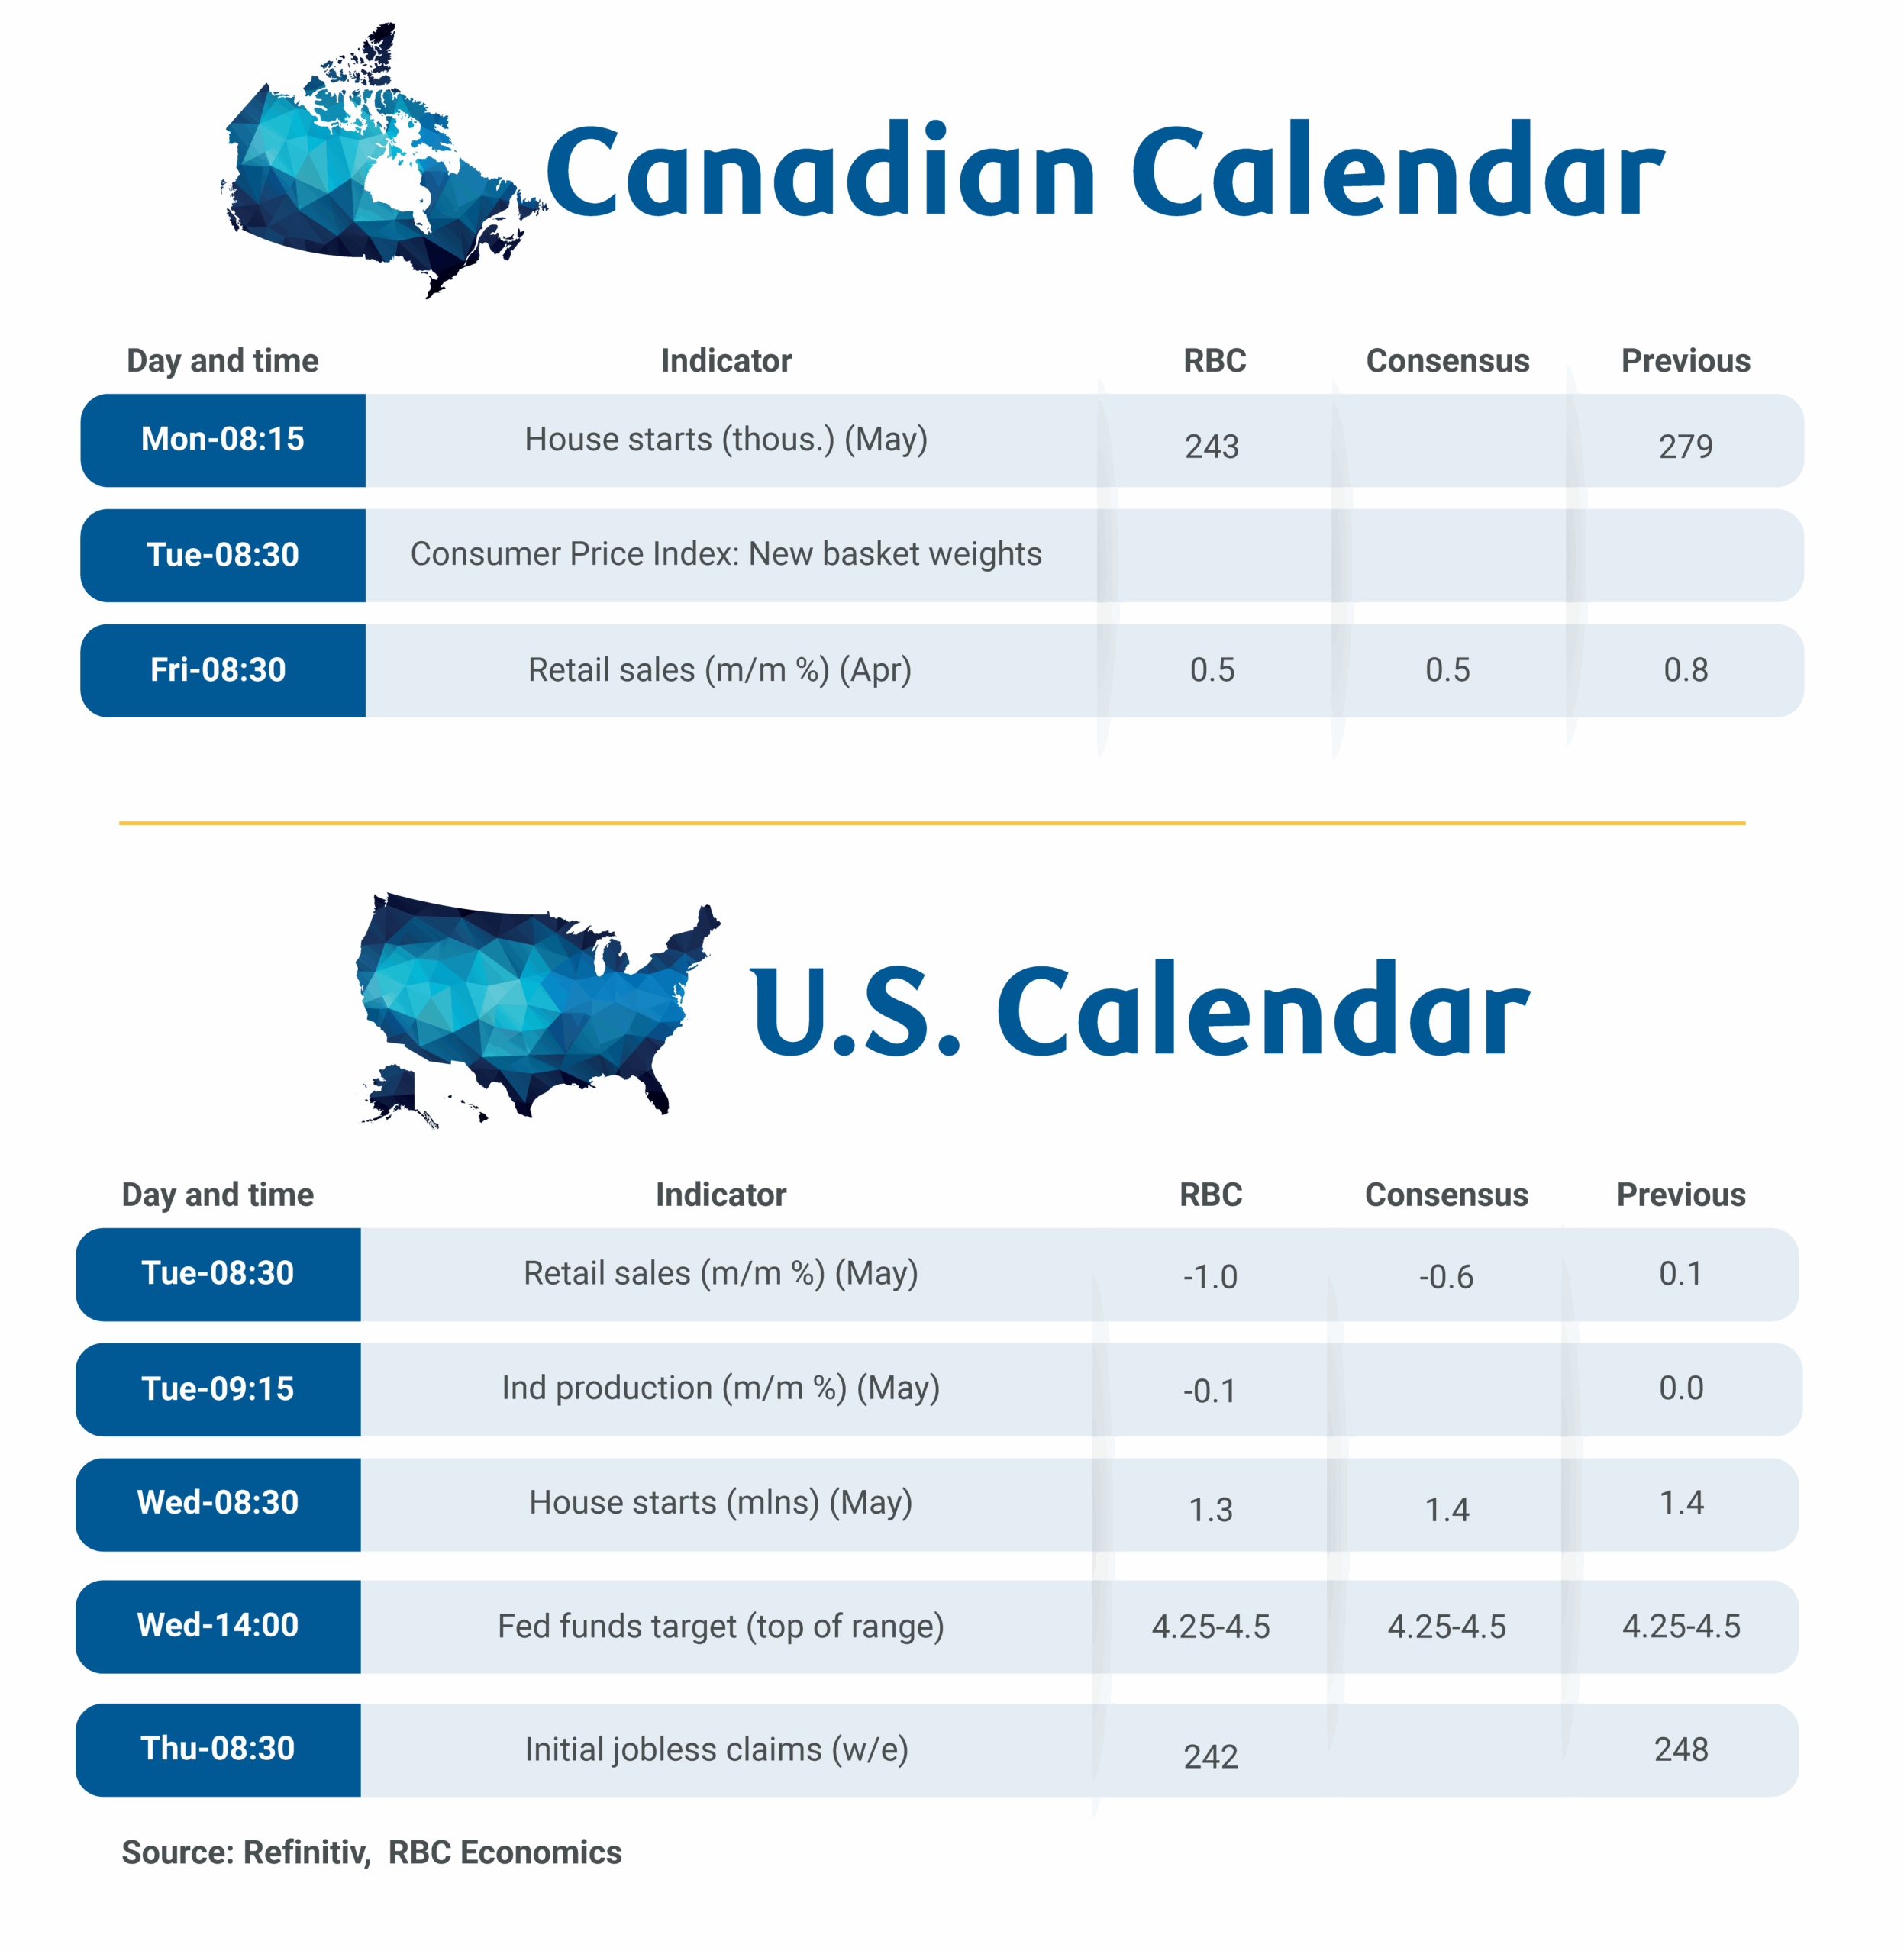
We expect May Canadian housing starts to pull back to 243,000-a 12.8% decline that would partially retrace a 30% surge in April.
U.S. retail sales likely fell by 1% in May following strong performance in April and a small uptick in March. Unit auto sales dropped another 9% in May on top of a 3% decline in the previous month, while lower-priced gas station sales further slowed headline sales. Meanwhile, control group sales likely inched up by 0.1%, insufficient to offset the 0.2% decline observed in the previous month.
Gold Ready to Update All-Time Highs
The insatiable appetite of central banks has resulted in an increase in the share of gold value in reserves to 20%. Precious metals have surpassed the euro’s 16% share. Only the US dollar is ahead with 46%. In 2022-2024, regulators increased their purchases to more than 1,000 tonnes annually. As a result, their combined gold reserves grew to 36,000 tonnes by the end of last year. They are now very close to the record set in 1965 of 38,000 tonnes.
The weakening of the US dollar and falling Treasury yields support the gold price. The reluctance of US inflation to accelerate under the influence of tariffs and the cooling of the economy increases the risks of resuming the Fed’s monetary expansion cycle as early as September. Until recently, the futures market has not been pricing a rate cut until October.
Geopolitics is playing in favour of the precious metal. Gold is a safe-haven asset and proved with its performance last night. Demand for it is growing as the risks of a new conflict in the Middle East increase. The future fate of the precious metal will depend on the resistance test at $3,400 per ounce.
Week Ahead – Markets Brace for Central Bank Barrage Amid Heightened Uncertainty
- Fed officials to stand pat as they await further clarity.
- A dovish BoJ could push rate hike expectations into 2026.
- Deflation fuels speculation about negative SNB rates.
- BoE may sound more dovish after disappointing UK data.
Fed expected to stand pat – Mind the dots
Risk appetite remained supported during the first half of the week as the US and China agreed on a framework to implement the accord reached in Geneva last month. However, despite the S&P 500 and the Nasdaq getting closer to their record highs due to hopes that tariffs will not distort the economic outlook that much, the dollar was unable to recharge.
Perhaps this was because investors lost their trust in the world’s reserve currency, or because they preferred to abstain from buying it ahead of the CPI data. Indeed, after the lower-than-expected CPI numbers were out, the dollar slipped further and accelerated its slide on Thursday after US President Trump said that he would send out letters in one to two weeks to other countries, outlining the terms that they could accept or reject. Equities pulled back and extended their slide after Israel attacked Iran’s nuclear facilities.
The latest development is an extra set of worries for investors as following Israel’s attack, Iran already responded launching more than 100 drones. The rally in oil prices and the gains in safe-haven assets suggest that there is elevated anxiety about whether there will be further escalation in the coming days.
All this uncertainty is leaving investors scratching their heads as to how the Fed may proceed from here onwards and thus, next week’s gathering may be eagerly awaited. Just after the relatively decent NFP report and ahead of the CPI numbers, investors were penciling in around 42bps worth of rate cuts by the Fed this year, which is one of the very few times they turned slightly more hawkish than the Fed itself. However, after the inflation data was out, they went back to factor in 55bps worth of cuts.
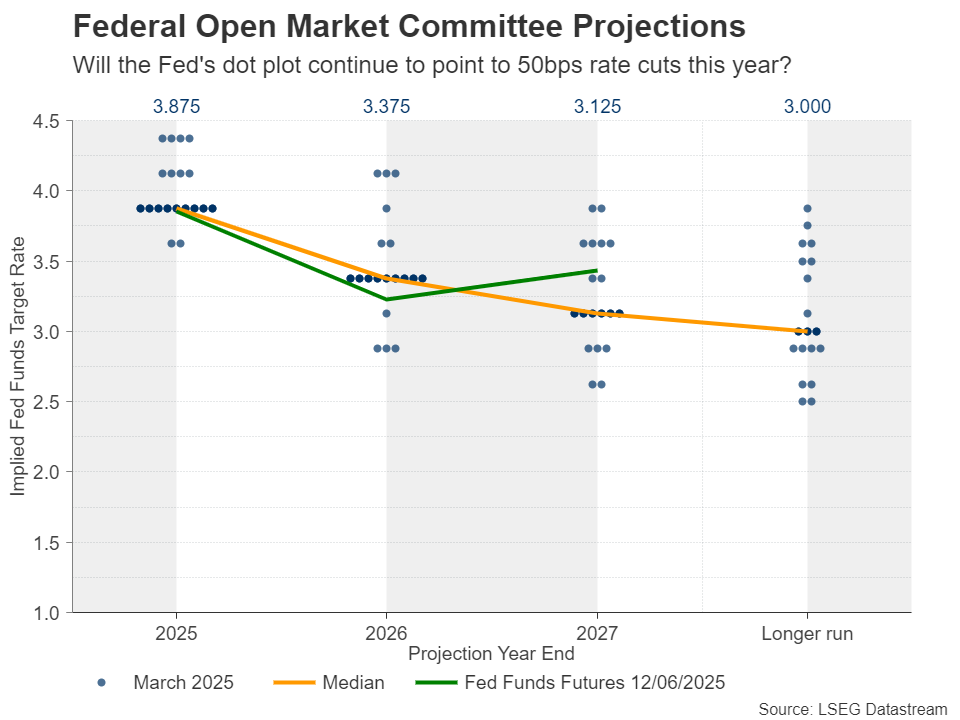
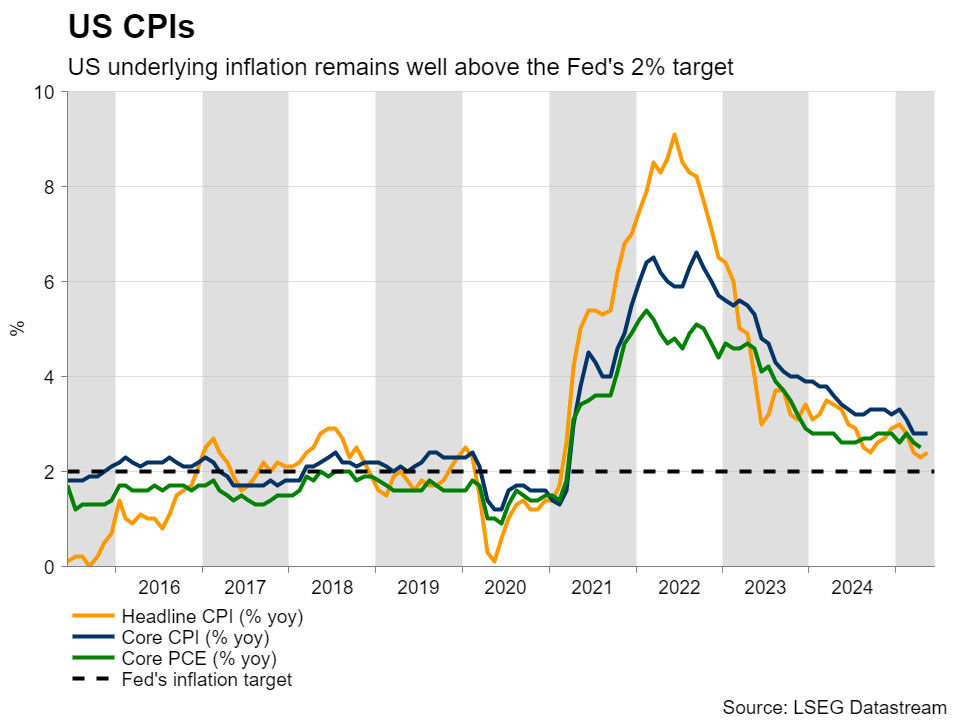
No action is expected on Wednesday and thus, the spotlight is likely to turn to the accompanying statement, Fed Chair Powell’s press conference, and the updated macroeconomic projections, including a new ‘dot plot’. With fears of a recession abating, policymakers have been signaling that they are in no rush to further lower interest rates, as the heightened uncertainty due to trade- and tariff-related developments could still impact employment and prices. Yes, inflation numbers for May came in lower than expected, but the headline rate actually rose to 2.4% y/y from 2.3%, and the core held steady at 2.8%, well above the Fed’s objective of 2%.
This corroborates the notion that policymakers should stay patient, but it is unclear whether they will continue to signal two rate cuts or switch to just one. According to Fed fund futures, there is a strong 95% chance for September action and then a follow-up cut in December.
So, if dot plot points to only one quarter-point rate cut by December, the dollar is likely to shoot higher. The dollar could also strengthen even if officials continue to point to two rate cuts, as long as they sound hawkish enough to convince market participants to push back the timing of when they expect the first one. This may be the most likely outcome. For the dollar to extend its prevailing slide in the aftermath of the decision, the Fed may need to convince investors to price in the next rate cut before September.
Will the BoJ push the next rate hike into 2026?
Ahead of the FOMC decision, during the Asian session on Tuesday, the BoJ will announce its own monetary policy decision. At its latest meeting, on May 1, the Bank held interest rates steady, and downgraded both its growth and inflation forecasts. At the press conference, Governor Ueda highlighted the uncertainty surrounding the trade landscape, noting that the timing of the next increase will depend on related developments.
The stickiness in Japan’s inflation allowed investors to price in a more-than-50% chance of another 25bps rate increase, but more recently, Governor Ueda repeated that uncertainty surrounding Japan is very high, while a former policymaker said just yesterday that US President Trump’s tariffs may have put an end to the BoJ’s rate-hike cycle.
Therefore, although the Bank is widely anticipated to remain on hold at this meeting, yen traders are likely to keep their gaze locked on the forward guidance. Policymakers are likely to keep the door to future hikes open due to elevated inflation, but should they place extra emphasis on proceeding cautiously and with no rush, investors could push the timing of the next rate hike into the first quarter of 2026. Something like that could weigh on the yen.
The National CPI data for May will be released during the Asian session on Friday.
SNB dilemma: To cut by 25 or 50bps?
On Thursday, it will be the turn of the SNB and the BoE to make their monetary policy decisions public.
Getting the ball rolling with the SNB, a rate cut is fully priced in, but the big question is whether the size will be 25 or 50 basis points. Currently, the Bank’s benchmark rate is at 0.25%, which means that Switzerland could become the first advance economy to return to a negative interest rates regime, should policymakers decide to proceed with the bolder reduction.
The latest CPI data revealed that consumer prices fell by 0.1% year-over-year in May, mainly driven by large declines in household goods and services, as well as in transport costs. This is the first deflationary month since March 2021, which combined with a subdued economic outlook, has prompted market participants to assign a 20% chance of a 50bps rate cut.
Thus, in contrast to the other Banks, the SNB’s rate decision could directly impact the market. In case officials choose to take interest rates into negative territory, the franc is likely to tumble as the decision would likely disappoint those expecting a smaller 25bps reduction. Otherwise, in the case of a 25bps cut, the franc is likely to gain, but only slightly.
Weak UK data make BoE rate cuts more likely
Flying to the UK, following the weak labor market report, Thursday’s data revealed that the economy contracted 0.3% month-over-month in April, with both the industrial and manufacturing production rates slipping into negative territory as well.
This was the worst monthly drop since October 2023, and despite the BoE sounding cautious about interest rates cuts when it last met due to sticky inflation, it raised bets that another 52bps worth of reductions may be needed before the turn of the year.
Yet, the Bank is expected to stand pat when it meets on Thursday, after cutting interest rates by 25bps at its previous decision. The next reduction is fully priced in for September, but a potential slowdown in Wednesday’s CPI data could intensify speculation for a dovish message on Thursday, which could push the pound lower. Yes, the British currency remains in an uptrend mode against its US counterpart, but this is because the US dollar is suffering more than the pound; not because the pound has shrugged off the latest streak of disappointing data. Sterling’s wounds are more evident in the euro/pound exchange rate.
New Zealand GDP and Australia’s jobs report also on tap
Elsewhere, New Zealand’s GDP for Q1 will be released during the Asian session Wednesday, and Australia’s employment report for May on Thursday. According to New Zealand’s Overnight Index Swaps (OIS) market, the RBNZ is expected to cut by another 25bps and end its rate-cut cycle, while the RBA, which started at a much later stage, is anticipated to deliver another 100bps by May 2026. Therefore, should the data further widen this divergence, the aussie/kiwi pair is likely to extend its prevailing downtrend.
Weekly Focus – Geopolitics Back in the Spotlight
With an Israeli attack on Iran early on Friday, geopolitics is strongly back to the agenda. This time around, the attack was larger in scale and more severe than the strikes we saw last year. Hence, Iranian retaliation is also expected to be stronger and has already started. Simultaneously, Israel is saying that the operation will last several days. We think one of the key determinants for markets will be whether Iran shows some restraint in their retaliation and abstains from targeting US bases in the region, or whether it chooses otherwise, and we witness the US getting absorbed into a new conflict in Middle East.
For energy markets going forward, the key thing is whether energy supply or trade will be disrupted by the recent escalation. On Friday, oil prices recovered rapidly from an initial spike above USD 78 level, as the Israeli strikes did not target Iranian oil facilities. In case future attacks would damage Iran's oil production sites, prices could react more strongly. The most severe scenario, though, is one where Iran would close traffic via the Strait of Hormuz. Such an attack would severely disrupt oil exports from the Gulf region, but the impacts would be even more pronounced for the global LNG trade. We think the risk of such an extreme measure is low, but it should not be completely ignored.
Speculating about a renewed global energy crisis is way too early at this point. Should Iranian oil production be temporarily disrupted, OPEC oil producers could choose to compensate for that. Also, the US has strategic oil reserves that they could choose to sell if the market started tightening too much. That said, a severe disruption in oil or gas trade as a result of the closure of the Strait of Hormuz would probably trigger a very steep rise in prices, with a strong negative impact on consumer and business sentiment. For now, we are not too concerned as inflation pressures have kept on moderating, read more on Global Inflation Watch - Price pressures moderated in May despite trade war, 11 June.
During an otherwise uneventful week, equity markets were range-bound until geopolitical risks started weighing on the sentiment towards the weekend. The US dollar gained against the euro on Friday, but EUR/USD remains one and half a figure higher on the week. Gold price reached new highs on Friday amidst rising geopolitical uncertainty.
Next week, focus turns to central banks. We start with the Bank of Japan on Tuesday. We expect the BoJ will keep monetary policy unchanged. Trade war uncertainty has pushed the pause button on the hiking cycle. Riksbank will announce their rate decision on Wednesday and Norges Bank will follow suit on Thursday (read more below).
On Wednesday, all eyes are on the FOMC. We expect the Fed to maintain its policy rate unchanged, in line with consensus and market pricing. We still expect the Fed to cut rates twice in 2025 in line with March dots, followed by three more cuts in 2026. We do not expect strong forward guidance from Powell, but see risks skewed towards modestly dovish market reaction. Read more on Research US - Fed preview: Still on the sidelines, 13 June.
On data front, we will keep an eye the monthly batch of Chinese data on Monday and the German ZEW index on Tuesday. Obviously, we will also closely monitor the developments in Middle East.
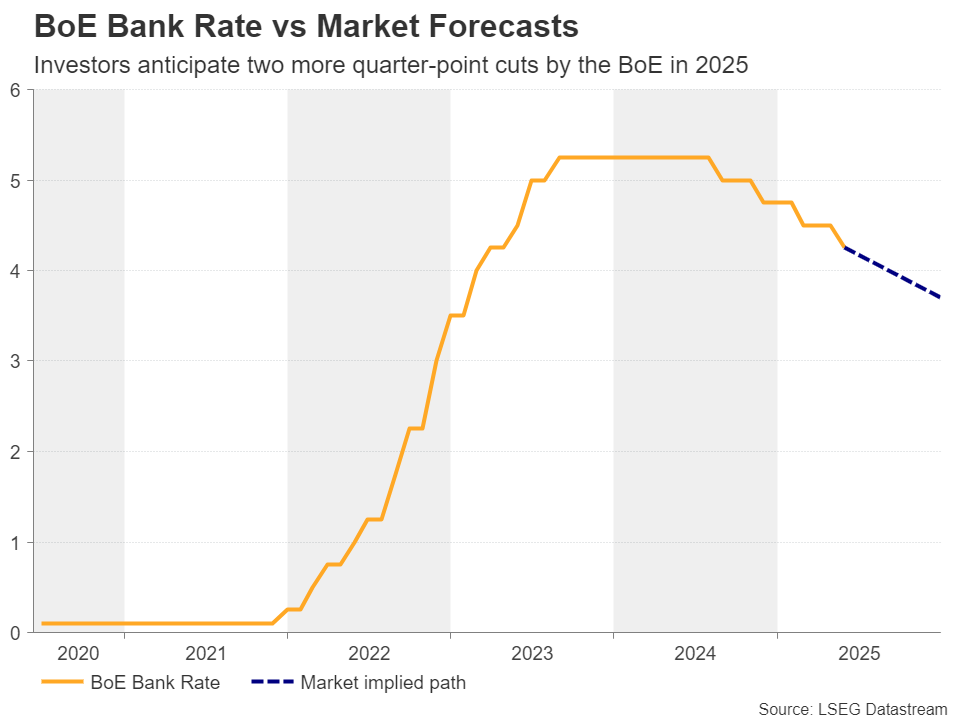
Bank of England Preview – Steady as She Goes
- We expect the Bank of England (BoE) to keep the Bank Rate unchanged at 4.25% on Thursday 19 June in line with consensus and market pricing.
- Data has surprised to the downside since the past meeting with the job market showing more pronounced signs of cooling. We think this will support the notion of further quarterly cuts.
- We expect the reaction in EUR/GBP to be muted. We stay negative on GBP.
We expect the Bank of England to keep the Bank Rate unchanged at 4.25% on Thursday 19 June in line with consensus and market pricing. We expect the vote split to be 7-2 with the majority voting for an unchanged decision and Dhingra and Taylor voting for a 25bp cut. Risks are tilted towards a 6-3 vote split. Note, this meeting will not include updated projections or a press conference following the release of the statement.
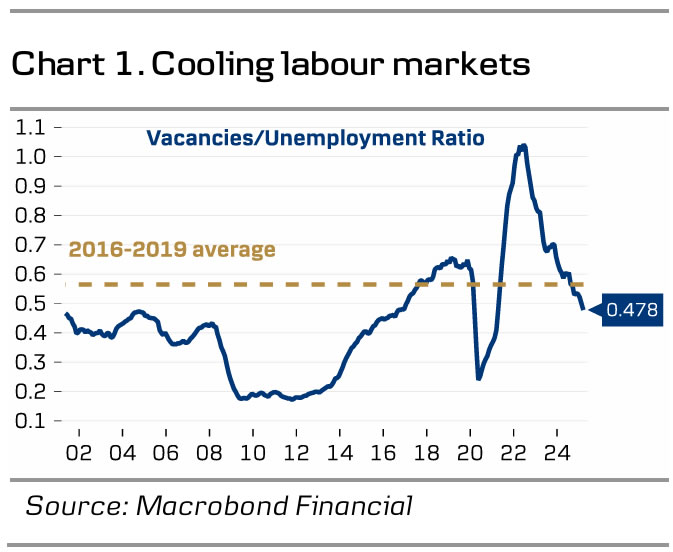
Overall, we expect the BoE to stick to its previous guidance repeating that a "gradual and careful approach to removing monetary policy restraint remains appropriate". Since the last meeting in May, data has generally surprised to the downside. Weakness in the labour market has become more pronounced over the past months with payrolls dropping consistently and unfilled vacancies continuing to edge lower. Private sector wage growth has likewise been lower than expected - although it remains at elevated levels. Growth has been weaker than expected at -0.3% m/m in April and poses as a downside risk to the MPC's projection of 0.1% q/q for Q2 2025. Service inflation remained to the high side at 5.4% y/y in April, but we note that the increase was largely due to the timing of Easter and an overestimation by the ONS of the increase in road tax, which will push the print lower again in May.
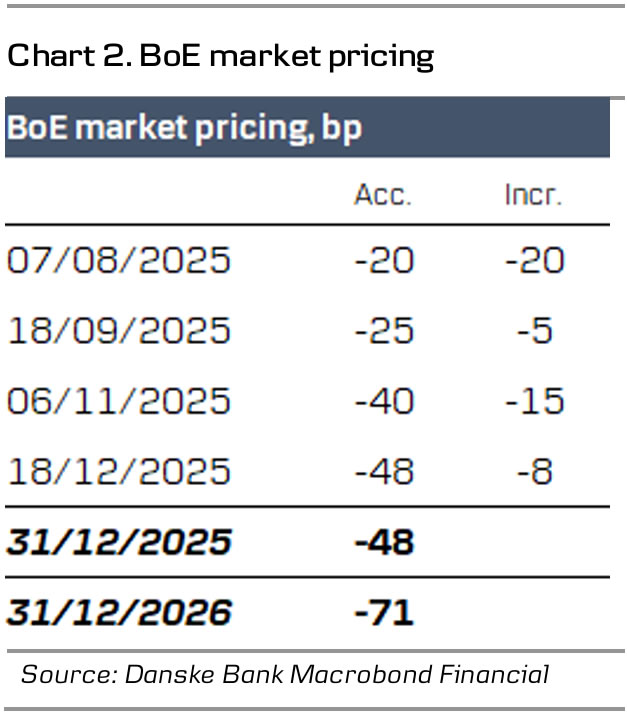
BoE call. We expect the BoE to stick to quarterly cuts, leaving the Bank Rate at 3.75% by YE 2025, which is aligned with market pricing. Markets are pricing 50bp for the remainder of the year. However, we highlight that the risk is skewed towards a swifter cutting cycle in 2025 and 2026 given the downside risks to growth.
Market reaction. We expect a muted market reaction as the BoE will refrain from altering its current guidance. More broadly, we stay negative on GBP. An investment environment characterised by elevated uncertainty and a positive correlation to a USD negative environment, in our view, favours a weaker GBP. Tentative signs of a weaker growth outlook for the UK economy also acts as a headwind for GBP. We therefore expect EUR/GBP to move higher towards 0.87 on a 6-12-month horizon.
Fed Preview: Still on the Sidelines
- We expect the Fed to maintain its monetary policy unchanged in the June meeting, in line with consensus and market pricing.
- We expect this year's GDP growth estimate to be revised down reflecting the impact from post-Liberation Day tariffs. Core inflation forecasts will also be likely adjusted slightly higher. 2026-27 forecasts will be less affected.
- We still expect the Fed to cut rates twice in 2025 in line with March dots, followed by three more cuts in 2026. We do not expect strong forward guidance from Powell, but see risks skewed towards modestly dovish market reaction.
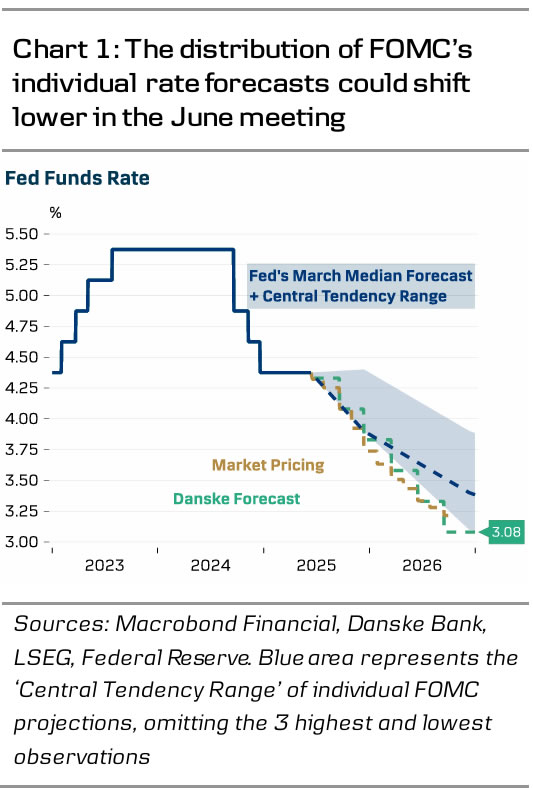
FOMC participants have remained mostly on the sidelines since the May meeting. Some have sounded open to the idea of cutting 1-2 more times during rest of 2025, but most have carefully avoided influencing financial conditions amid the tariff uncertainty. Current market pricing is just slightly below the Fed's March median 'dots' for 2025-26 despite the significant market volatility observed ever since (chart 1).
We expect a sizable downward revision to FOMC's median 2025 GDP forecast in the updated Summary of Economic Projections (SEP), reflecting the post-Liberation tariff impact. On a comparable Q4/Q4 basis, our forecast is only +0.9% for 2025 (consensus 1.0%, March SEP: 1.7%) and +1.8% for 2026 (consensus 1.7%, March SEP 1.8%).
Core PCE forecast could shift a bit higher for 2025. Lower energy prices might counteract some of the tariff impact for the headline PCE, although the latest jolt of geopolitical uncertainty blurs the outlook. We expect unemployment rate forecast to remain steady, as tighter supply from immigration is counteracting the demand-effect from slowing hiring.
We will keep a close eye on the Fed's assessment on the balance of risks. Back in March, FOMC participants reported that inflation risks had become increasingly skewed to the topside, but that GDP and unemployment risks were better balanced. In May, Powell verbally stated that both growth and inflation uncertainty had increased, but he avoided specifying which risk felt more pressing at the time.
Since May, incoming data has signalled that firms' increased tariff payments are on track to reach roughly USD190-200bn per year (or around 0.6% of GDP, see RtM USD, 27 May). Wage growth hovers just above 4% per year (according to Atlanta Fed) but realized inflation surprised to the downside in May across both goods and services (see Global Inflation Watch, 11 June). As firms are not yet passing through the rising costs to selling prices, the trade war is putting pressure on margins, which could tilt the Fed to feel more concerned about the labour market. Whether price hikes are delayed simply as a choice amid uncertainty, or due to lack of pricing power, remains to be seen.
We still think risks are skewed towards more, rather than less cuts, and we maintain our terminal rate forecast at 3.00-3.25% - somewhat below current market pricing. While we expect Powell to follow his colleagues' recent footsteps and carefully avoid strong forward guidance, risks could be tilted towards lower rates and further USD weakness if Powell gives a clearer signal that resuming rate cuts is not a question of if but when.
Sunset Market Commentary
Markets
Israel’s overnight airstrike on Iran’s nuclear facilities was met by a retaliatory drone attack several hours later. Israel doesn’t appear to backdown though with media around noon reporting a second wave. According to US president Trump “there’s a lot more to come”. At the heart of the conflict lies Iran’s nuclear enrichment programme of which it says is for civilian purposes only (nuclear energy). But Israel and the US fear military use is the actual endgame. Talks between the US and Iran failed to produce a new nuclear deal and when Trump’s unofficial two-month deadline lapsed yesterday, Israel pounced. Risks for the conflict to spread into a wider war in the region responsible for around one third of oil output launched the price of a barrel of Brent 13% higher at some point. Gains are currently around half of that with Brent trading around $74.2/b, the highest level since early April. Other pockets in the market showed a kneejerk risk-off reaction. Gold ekes out a 1.1% gain to $3424/oz, near the recent record highs. There’s a classic safe haven run unfolding in currency markets with the likes of CHF and JPY showing some gains. EUR/CHF touched a low just north of 0.93 before bouncing back to 0.936 currently. Yen gains stay more limited. The Japanese currency even loses out against the USD (USD/JPY 144.2). The dollar’s reaction function was an interesting once. Right after the Israeli air strike news broke the greenback briefly fell, including against the euro. It’s potentially indicative of lingering doubts on the USD’s role as a safe haven. The dollar then recovered quickly, probably thanks to the sharp uptick in oil prices. It came right on time for the USD with an important technical break looming in the likes of EUR/USD. The pair tested the 1.16 big figure yesterday and a break higher would have boosted odds of a return back towards 1.2349. DXY avoided a drop sub 98 that would prelude a further slide to at least 94.65/95.24. GBP/USD was showing a similar USD-distressed technical picture around 1.36. The CAD and NOK, both oil currencies, are doing just fine given the market circumstances. Initial safe haven flows in core bonds completely reversed at the start of European dealings. Current net daily changes vary between +1.5-2.1 bps in the US. For the ECB in particular this oil price shock is potentially an important element for its forecasts. It downwardly revised its CPI projections last week, amongst others due to lower energy prices. KBC Economics raised the June CPI nowcast to 2.05% from 1.87% (from 1.9% actual inflation in May) should current oil prices hold. The front end of the German yield curve marginally underperforms, adding around 2 bps compared to 1.4 bps at the long end.
News & Views
The Bank of England today published the results of the quarterly survey of public attitudes on inflation. The survey showed a limited decline in in inflation expectations for the short-term horizon, but expectations remained at historically high levels. Expectations for price growth over the next year eased slightly from 3.4% in the February survey to 3.2%. Expectations for the period between one and two years’ time was unchanged at 3.2%. Expectations for inflation on a five year horizon stay at 3.6%. The public also perceived UK inflation in early May to have been at 4.7% (was 4.9% in the February survey). This compares to UK (headline) inflation being reported at 3.5% for April (from 2.6% in March). UK May inflation data will be published on Wednesday next week. The Bank of England has a regular policy meeting on Thursday next week. The survey also respondents the assess whether the BoE is ‘doing its job to set interest rates to control inflation’. This net approval balance rating rose to a positive 6.0% from 1.0%.
The European Commission today published its assessment on the need for nuclear investments by 2050. According to the EC, delivering on the Member States’ plans regarding nuclear energy will require significant investments of around €241 bln until 2050. This will be necessary both for lifetime extension of existing reactors (€36 bln) and for the new-build of large-scale reactors account for €205 bln. The EC notes that some EU countries see nuclear energy as an important component of decarbonization, competitiveness and security of supply strategies. The Commission estimates that over 90% of electricity in the EU in 2040 will be produced from decarbonised sources, primarily renewables, complemented by nuclear energy. Nuclear installed capacity across the EU is projected to grow from 98 GWe in 2025 to 109 around GWe by 2050. The EC indicates that In 2023, nuclear energy provided 22.8% of the EU’s electricity generation.
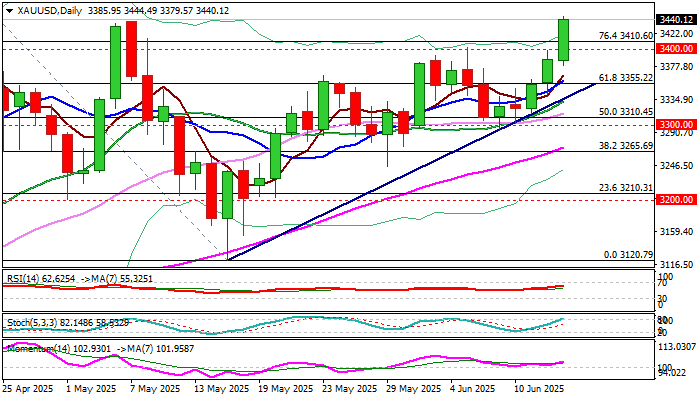
XAU/USD: Gold May Rise Above $3,500, If Geopolitical Situation Escalates Further
Gold surged to the highest in seven weeks ($3444) overnight following Israel’s attack on Iran that fueled safe haven demand and quickly lifted the price.
Break of $3400 zone (former strong resistances that reverted to supports) further brightened near-term outlook with weekly close above these levels to confirm bullish signal and keep focus on key target at $3500 (new record high).
Technical picture remains firmly bullish on daily chart, but bulls may slow here due to partial Friday’s profit-taking, as well as from stochastic entering overbought territory.
However, the latest action was mainly driven by geopolitical tensions, and the same factor is expected to continue to strongly influence price movements in the near future.
From the recent rhetoric on both sides, we can assume that tensions may either slightly decrease but will remain overheated and that would keep the price temporarily capped but strongly elevated or will further escalate (currently sounds like more likely scenario).
In such environment, gold would surge through $3500 pivot and focus targets at $3589 / $3600 / $3645 (Fibo projections / psychological.
Supports at $3410 (hourly higher base), $3400 (psychological) and $3380 (today’s low) should hold and keep fresh bulls fully in play.
Res: 3471; 3487; 3500; 3550.
Sup: 3414; 3400; 3380; 3355.
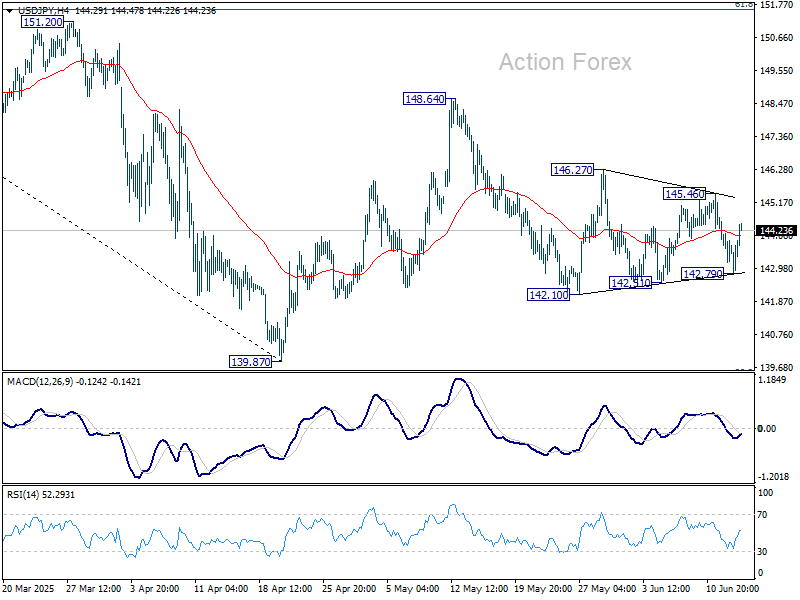
USD/JPY Mid-Day Outlook
Daily Pivots: (S1) 142.94; (P) 143.75; (R1) 144.32; More...
USD/JPY rebounded ahead of 142.51 support as sideway trading continues. Intraday bias stays neutral. On the downside, break of 142.10 support will resume the fall from 148.64 to retest 139.87 low. On the upside, above 145.46 will turn bias to the upside for 146.27 first. Firm break there will target 148.64 resistance.
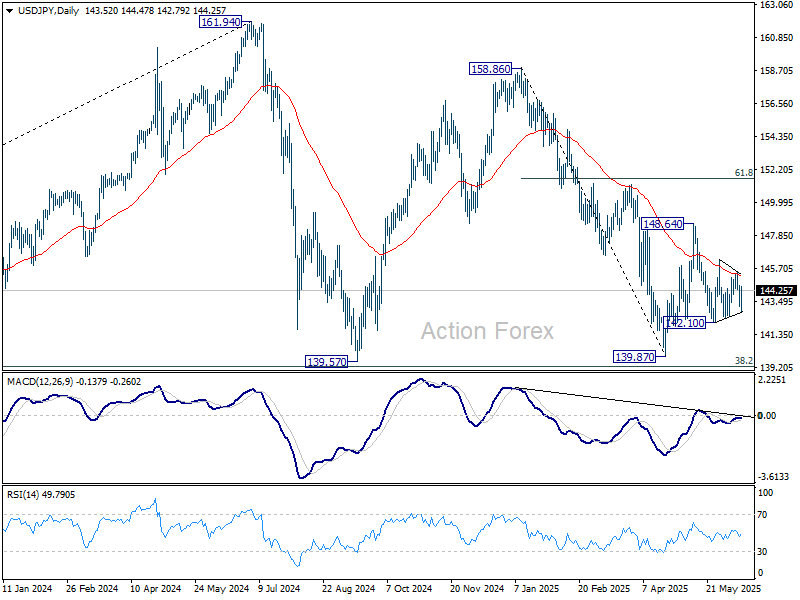
In the bigger picture, price actions from 161.94 are seen as a corrective pattern to rise from 102.58 (2021 low), with fall from 158.86 as the third leg. Strong support should be seen from 38.2% retracement of 102.58 to 161.94 at 139.26 to bring rebound. However, sustained break of 139.26 would open up deeper medium term decline to 61.8% retracement at 125.25.
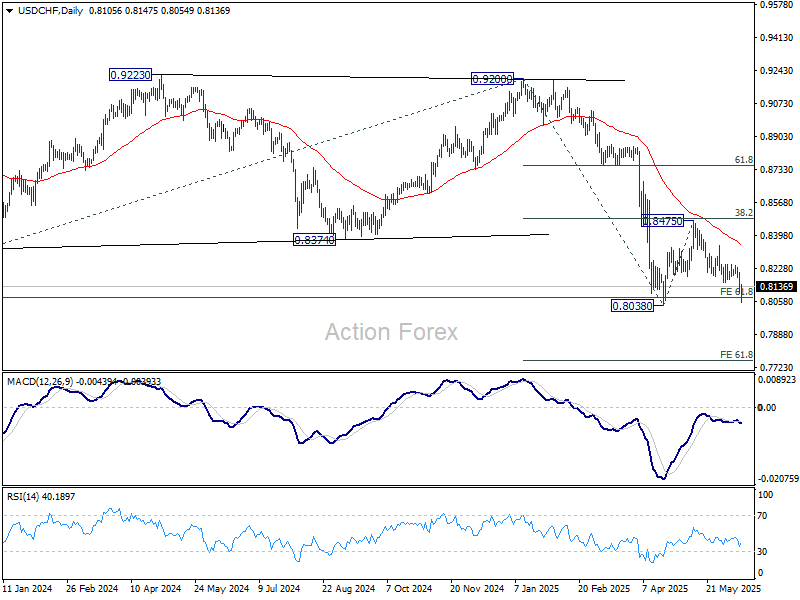
USD/CHF Mid-Day Outlook
Daily Pivots: (S1) 0.8067; (P) 0.8138; (R1) 0.8174; More….
Intraday bias stays mildly on the downside for 0.8038 low. Strong support could be seen there to bring rebound, and above 0.816 support turned resistance will turn intraday bias neutral first. However, firm break of 0.8038 will resume larger down trend. Next target will be 61.8% projection of 0.9200 to 0.8038 from 0.8475 at 0.7757.
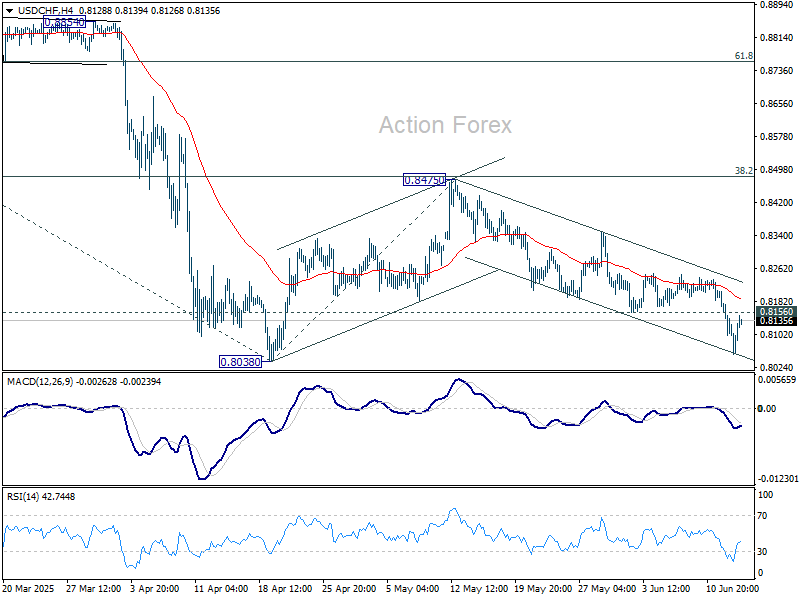
In the bigger picture, long term down trend from 1.0342 (2017 high) is still in progress and met 61.8% projection of 1.0146 (2022 high) to 0.8332 from 0.9200 at 0.8079 already. In any case, outlook will stay bearish as long as 55 W EMA (now at 0.8696) holds. Sustained break of 0.8079 will target 100% projection at 0.7382.