Sample Category Title
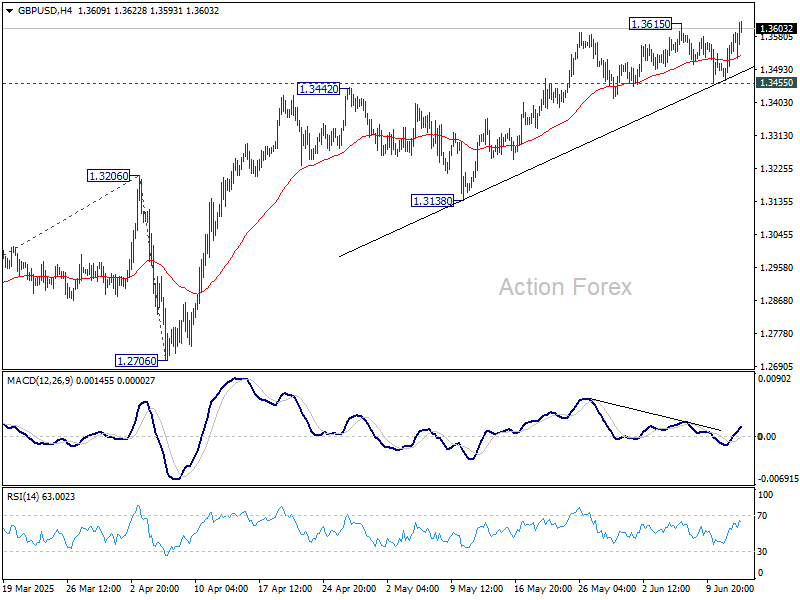
GBP/USD Mid-Day Outlook
Daily Pivots: (S1) 1.3486; (P) 1.3526; (R1) 1.3589; More...
Focus is now on 1.3615 resistance in GBP/USD. Decisive break there will resume the rally from 1.2099 and target 100% projection of 1.2099 to 1.3206 from 1.3138 at 1.3813. On the downside, break of 1.3455 support should confirm short term topping, and bring deeper correction to 55 D EMA (now at 1.3300) instead.
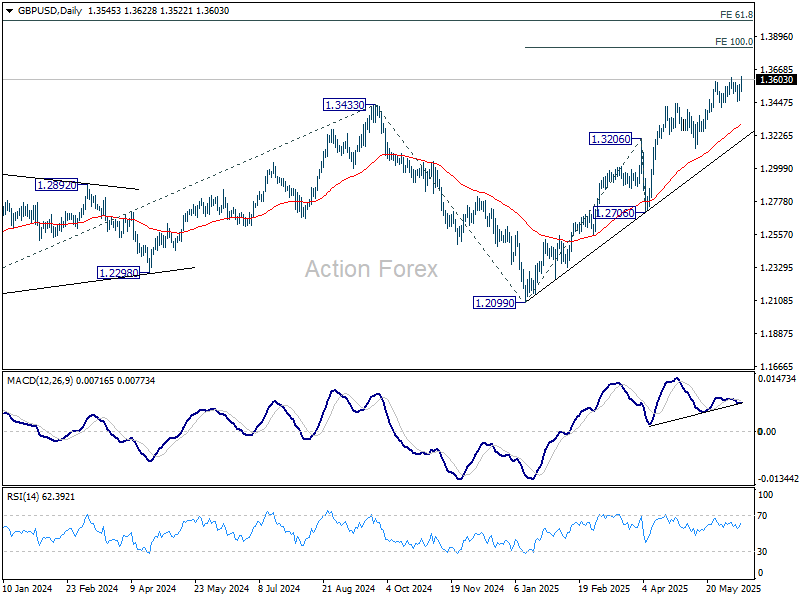
In the bigger picture, up trend from 1.3051 (2022 low) is in progress. Next medium term target is 61.8% projection of 1.0351 to 1.3433 from 1.2099 at 1.4004. Outlook will now stay bullish as long as 55 W EMA (now at 1.2913) holds, even in case of deep pullback.
EUR/USD Mid-Day Outlook
Daily Pivots: (S1) 1.1429; (P) 1.1465; (R1) 1.1524; More...
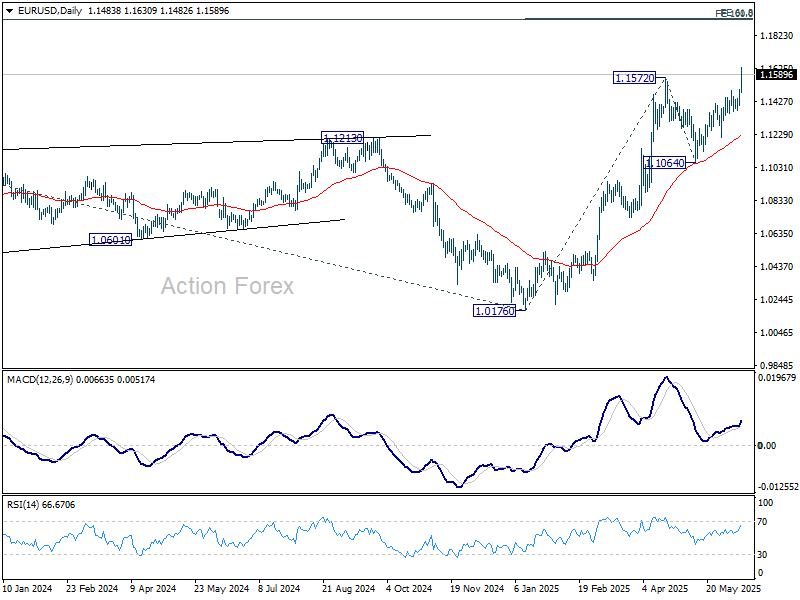
EUR/USD's rally from 1.0176 resumed by accelerating through 1.1572 resistance. Intraday bias stays on the upside at this point. Next target is 61.8% projection of 1.0176 to 1.1572 from 1.1064 at 1.1927. On the downside, below 1.1504 minor support will turn intraday bias neutral and bring consolidations first, before staging another rise.
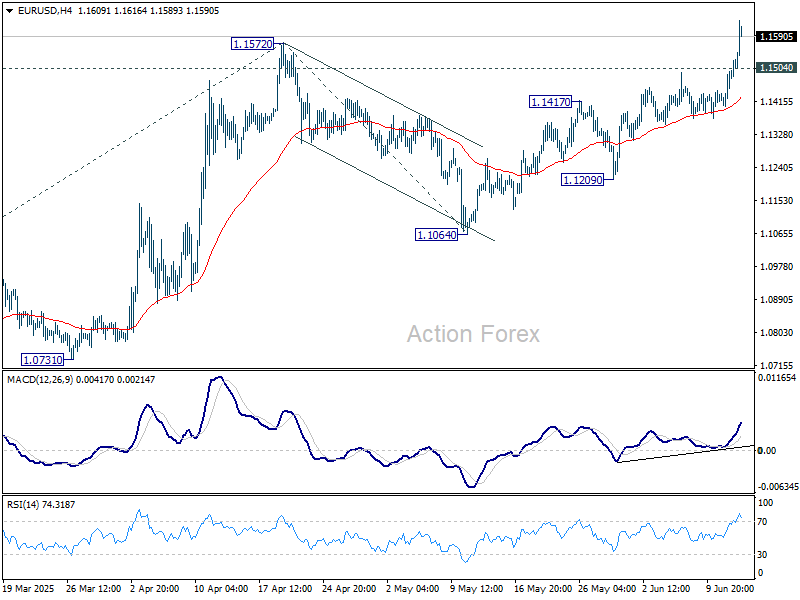
In the bigger picture, rise from 0.9534 long term bottom could be correcting the multi-decade downtrend or the start of a long term up trend. In either case, further rise should be seen to 100% projection of 0.9534 to 1.1274 from 1.0176 at 1.1916. This will now remain the favored case as long as 1.1604 support holds.
Dollar Crushed as Dovish Inflation Data and Trade Tensions Weigh; Euro Surges to Multi-Year High
Dollar accelerated its broad-based selloff in early US trading, plunging to its lowest level against Euro since 2021. The latest catalyst came from softer-than-expected May PPI data, which followed Wednesday’s downside surprise in CPI. The tandem inflation prints have further calmed fears of immediate tariff-driven price pass-through, at least for now, and are reinforcing expectations that Fed is moving closer to resume policy easing.
As a result, market expectations for Fed easing have firmed up. Fed funds futures are now pricing in an 80% chance of a rate cut in September, up from around 75% just a week ago before the two inflation releases. The tone of both upstream and downstream price measures—despite the tariff backdrop—has strengthened the market’s conviction that Fed will deliver a cut before the fourth quarter, particularly as labor market data has also started to show signs of softening.
Adding to Dollar’s woes is renewed uncertainty over US trade policy. While Treasury Secretary Scott Bessent floated the possibility of extending the current 90-day tariff truce with “good faith” trading partners, President Donald Trump struck a starkly different tone. Trump dismissed the need for any extension and hinted that countries would be unilaterally informed of their new tariff terms in the coming weeks. This reinforces fears that the US may revert to aggressive, one-sided trade actions just as the 90-day tariff truce nears expiration.
In the currency markets, Dollar is clearly the weakest performer of the day, followed by Loonie and Aussie. In contrast, safe-haven demand has lifted Swiss Franc to the top of the board, with Euro and Yen close behind. Euro in particular continues to draw support from a series of ECB officials signaling that the rate-cut cycle is nearing completion. That divergence—between a Fed leaning dovish and an ECB shifting toward a pause—is now starkly reflected in EUR/USD price action.
Sterling and Kiwi are trading in the middle of the pack, with the Pound underperforming its European peers. UK GDP contracted more than expected in April, reinforcing expectations for a BoE rate cut in August. Despite some signs of resilience in the broader three-month growth trend, momentum has clearly slowed, leaving BoE less justification to hold rates elevated for much longer.
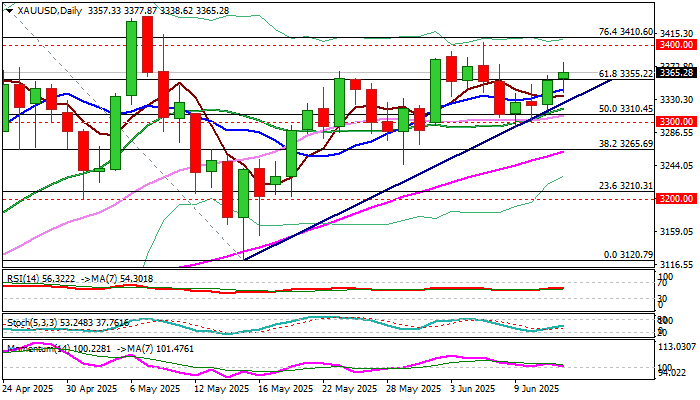
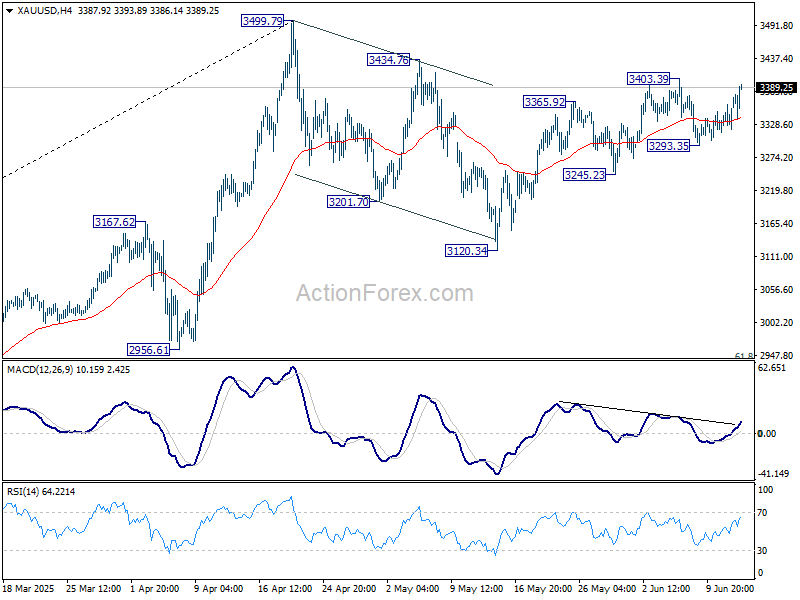
Technically, Gold is also bouncing on Dollar weakness, and focus is back on 3403.49 resistance. Firm break there will resume the rally from 3120.34, and revive the case that correction from 3499.79 high has completed. Further rally should then be seen to retest 3499.79.
In Europe, at the time of writing, FTSE is up 0.18%. DAX is down -0.87%. CAC is down -0.43%. UK 10-year yield is down -0.063 at 4.488. Germany 10-year yield is down -0.059 at 2.478. Earlier in Asia, Nikkei fell -0.65%. Hong Kong HSI fell -1.36%. China Shanghai SSE rose 0.01%. Singapore Strait Times rose 0.08%. Japan 10-year JGB yield fell -0.001 to 1.460.
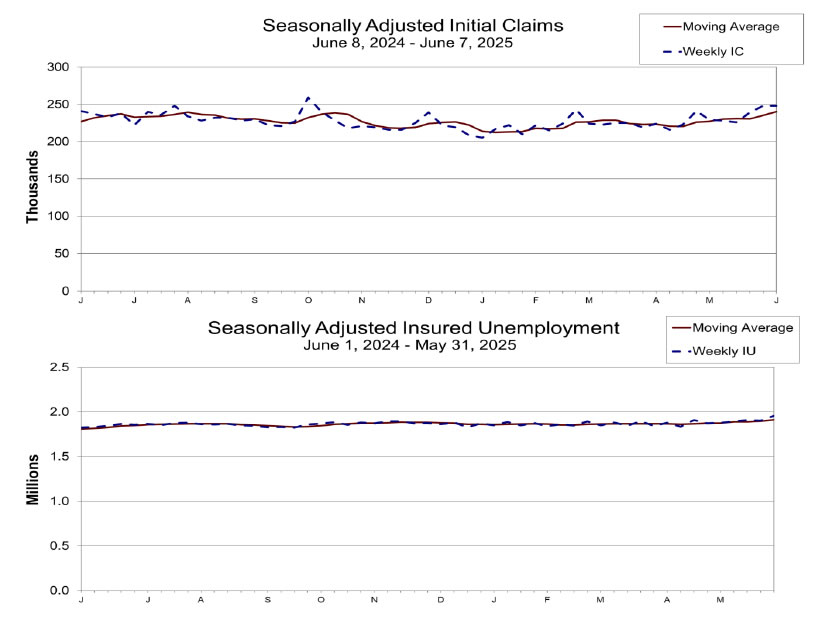
US initial jobless claims unchanged at 248k, match expectations
US initial jobless claims were unchanged at 248k in the week ended June 7, slightly below expectation of 251k. Four-week moving average of initial claims rose 5k to 240k, highest since August 26, 2023.
Continuing claims rose 54k to 1956k in the week ending May 31, highest sine November 13, 2021. Four-week moving average of continuing claims rose 20k to 1915k, highest since November 27, 2021.
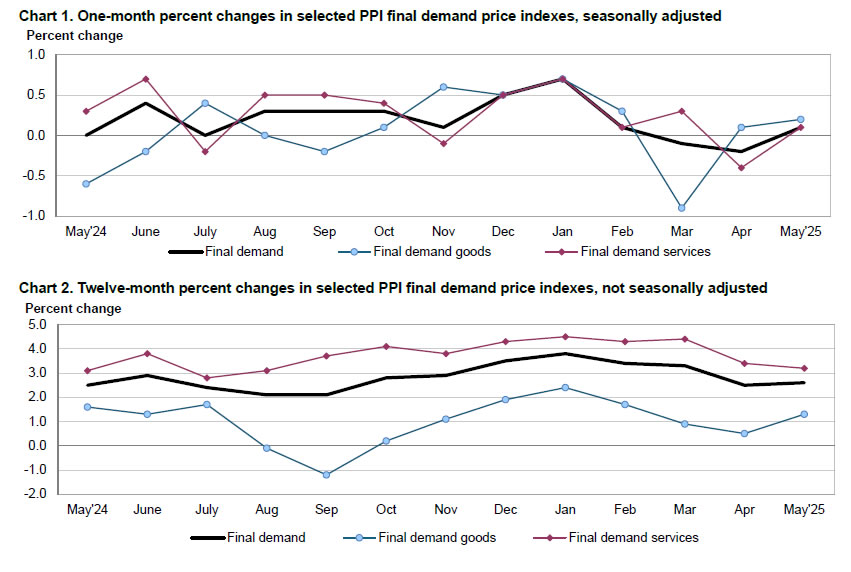
US PPI up 0.1% mom, 2.6% yoy in May
US PPI rose 0.1% mom in May, below expectation of 0.2% mom. PPI services rose 0.1% mom, while PPI goods rose 0.2% mom. PPI less food, energy and trade services rose 0.1% mom.
For the 12 months period, PPI rose from 2.5% yoy to 2.6% yoy, matched expectations. PPI less food, energy and trade services rose 2.7% yoy.
ECB Schnabel: Monetary easing nears end as Europe embraces stronger Euro and fiscal support
ECB Executive Board Member Isabel Schnabel signaled today that the central bank's monetary easing cycle is “coming to an end,” citing stable medium-term inflation forecasts and improving macroeconomic conditions.
Speaking with notable confidence, Schnabel downplayed the expected dip in inflation—projected at just 1.6% in 2026—as a "temporary deviation" caused by energy base effects and a stronger euro.
Schnabel painted a relatively constructive picture of the Eurozone economy, stating that growth remains "broadly stable" even as global trade tensions intensify. Private consumption continues to provide a key pillar of support, while both manufacturing and construction sectors are showing signs of recovery. She also highlighted that "Additional defense and infrastructure spending counteract tariff shock on growth".
In her view, these structural shifts, combined with a resilient Euro and outperforming equity markets, reflect a “new European growth narrative” that could elevate the region’s economic standing.
Still, Schnabel acknowledged the risks posed by escalating trade tensions, particularly in the form of inflation volatility and financial market uncertainty. She warned that tariffs can be amplified through global value chains, posing upside risks to inflation. At the same time weaponisation of raw materials threatens to further strain supply chains.
ECB Villeroy and Šimkus emphasize flexibility as policy hits neutral zone
Comments from two ECB Governing Council members today reinforced a cautious stance as the easing cycle appears to have reached a natural pause, following eight consecutive rate cuts.
French member Francois Villeroy de Galhau emphasized flexibility, telling Franceinfo radio that future policy will depend on how inflation evolves, stressing a preference for “pragmatism and agility.”
Lithuanian member Gediminas Šimkus echoed a similar tone, stating that policy has now reached a “neutral level”. It is critical for ECB to maintain the freedom, "not to commit to one direction or another". He warned of growing uncertainty, particularly around upcoming US trade decisions as the 90-day tariff truce nears expiry on July 9.
UK GDP contracts -0.3% mom in April, as services drag
The UK economy contracted -0.3% mom in April, a sharper decline than the expected -0.1%. The main drag came from the services sector, which fell -0.4% mom and contributed most to the monthly GDP drop. Production also shrank -0.6% mom. In contrast, construction provided a rare bright spot, rising 0.9% mom, though not enough to offset broader weakness.
Despite the poor April print, the broader picture remains more constructive. GDP expanded 0.7% in the three months to April compared to the prior three-month period, with services up 0.6%, production up 1.1%, and construction up 0.5%.
Japanese business confidence sours amid tariff fears and profit warnings
Business sentiment in Japan deteriorated sharply in Q2, with the Ministry of Finance’s survey revealing a broad-based loss of confidence across industries.
The overall index for large firms slipped into negative territory at -1.09, down from Q1’s modest 2.0. Large manufacturers saw sentiment weaken further from -2.4 to -4.8, while large non-manufacturers experienced a steep drop from 5.2 to -5.7, suggesting that economic uncertainty is spreading beyond export-heavy sectors.
The survey also highlighted a growing sense of earnings pessimism. Large manufacturers now expect recurring profits to decline -1.2% in the fiscal year ending March 2026, a downgrade from the -0.6% fall seen in the previous survey. Particularly alarming is the auto sector's outlook, with automakers and parts suppliers projecting a severe -19.8% drop in profits.
This highlights the mounting concern over the impact of steep US tariffs, which threaten to hit Japan’s flagship export industry hard and weigh on broader economic momentum.
EUR/USD Mid-Day Outlook
Daily Pivots: (S1) 1.1429; (P) 1.1465; (R1) 1.1524; More...
EUR/USD's rally from 1.0176 resumed by accelerating through 1.1572 resistance. Intraday bias stays on the upside at this point. Next target is 61.8% projection of 1.0176 to 1.1572 from 1.1064 at 1.1927. On the downside, below 1.1504 minor support will turn intraday bias neutral and bring consolidations first, before staging another rise.
In the bigger picture, rise from 0.9534 long term bottom could be correcting the multi-decade downtrend or the start of a long term up trend. In either case, further rise should be seen to 100% projection of 0.9534 to 1.1274 from 1.0176 at 1.1916. This will now remain the favored case as long as 1.1604 support holds.
WTI Oil Dips 2.2%, Geopolitical Risk Keeps Bulls in Play
Oil prices surged yesterday ending the day with a 5.4% gain on heightened geopolitical risk from the Middle East. A decision by the US to lighten embassy staff in Iraq and move personnel in the Middle East ahead of Nuclear talks with Iran raised eyebrows.
US President Trump's comments over the last 6 hours did not help matters with the President stating: “the U.S. was moving personnel because the Middle East "could be a dangerous place". He also said the U.S. would not allow Iran to have a nuclear weapon.
Iran has said its nuclear activity is peaceful and has threatened retaliation if attacked.
Today however, has seen Oil prices slide in European trade, down as much as 2.2% at the time of writing, trading at 66.75 a barrel.
Straight of Hormuz Raises Supply Concerns
A potential escalation with Iran could have massive implications for Oil markets. The biggest concern being a supply disruption as around 20% of the world's Oil passes through the Straight of Hormuz.
The narrow chokepoint could become a key area of focus in the event of regional tensions with Britain's maritime agency warning that rising tensions in the area could lead to more military activity, which might affect shipping in key waterways.
It advised vessels to use caution while travelling through the Gulf, the Gulf of Oman and the Straits of Hormuz, which all border Iran.
US PPI Data Could Affect Oil Prices
With Market participants still concerned about growth and the potential for inflation to rise due to tariffs, US PPI data could have a knock on effect on markets sentiment and thus Oil prices.
If PPI data comes in higher than expected markets may see this as a sign that a rise in CPI may be on its way. This in turn could affect global demand as consumers prioritize critical spending.
This of course is a possibility but Geopolitical risk is likely to remain front and center.
Technical Analysis - WTI Oil
From a technical analysis standpoint, Oil broke a significant descending trendline which had been in play since January 2025.
However the move only occurred on the back of US-Iran tensions. Prior to that, Tuesday's daily candle close echoed a false breakout and highlighted the current concern from bulls.
The concern for bulls still remains focused on tariffs and trade deals and how that may impact growth for the rest of the year. This will keep sellers interested and thus could hamper any rally higher.
The rise in US-Iran tensions however could be the catalyst needed for price to head higher but then again sustainability of the move may become a hot topic of discussion. The pullback in price this morning has provided a brief glimpse that sustainable higher prices for Oil may prove to be elusive right now.
Oil rejected after testing the 200-day MA resting at 68.55 and now looks set to test support at the 100-day MA around the 66.00 a barrel mark.
Will this handle hold and lead to the next bullish leg or will a deeper retracement to the trendline take place? That may be the focus for day traders as the US session unfolds.
WTI Oil Daily Chart, June 12, 2025
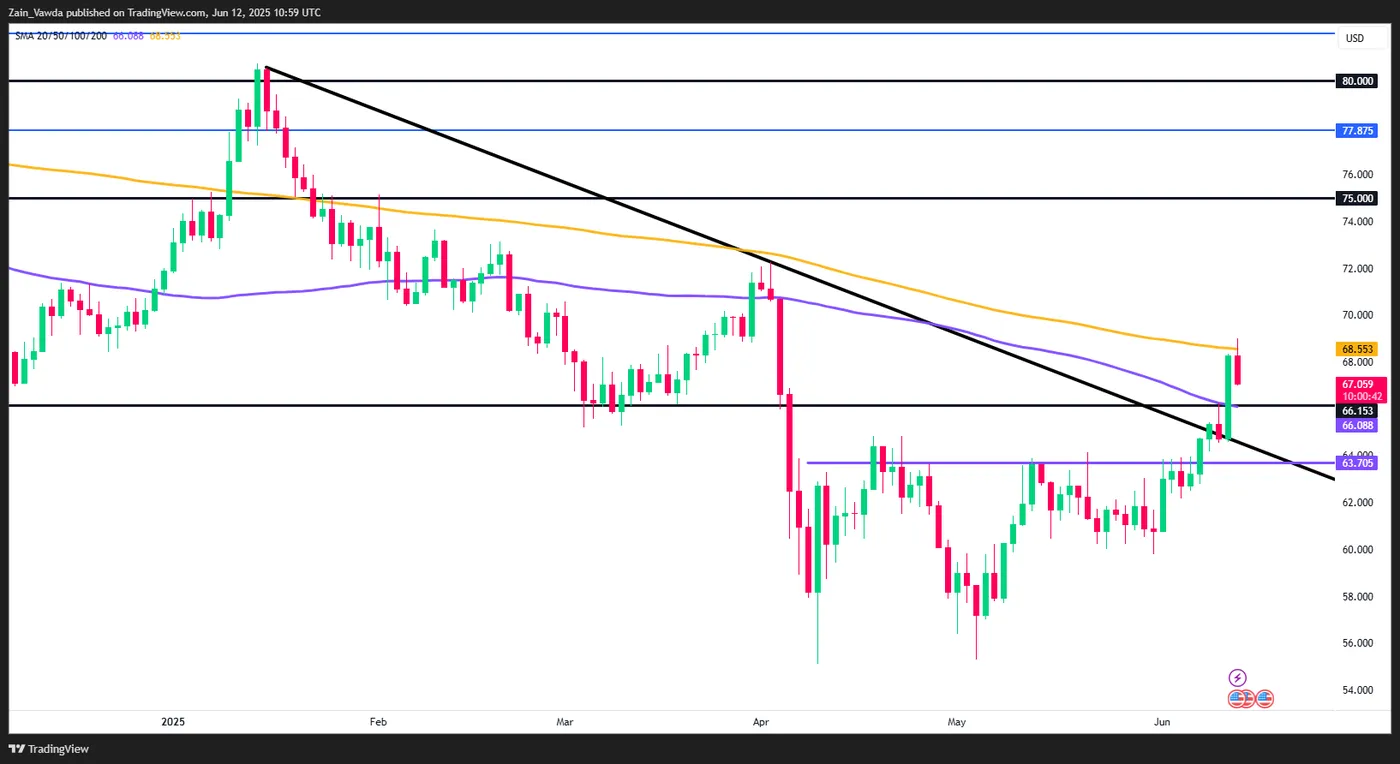
Source: TradingView (click to enlarge)
US Core PPI Falls to 3.0% YoY in May vs 3.1% Expected
- Producer Price Index (PPI) ex. Food & Energy (Core) (YoY): 3.0% vs 3.1% expected, miss of -0.1%
- Producer Price Index (PPI) ex. Food & Energy (Core) (MoM): 0.1% vs 0.3% expected, miss of -0.2%
- Producer Price Index (PPI) (YoY): 2.6% vs 2.6% expected, meets consensus
- Producer Price Index (PPI) (MoM): 0.1% vs 0.2% expected, beat of +0.1%
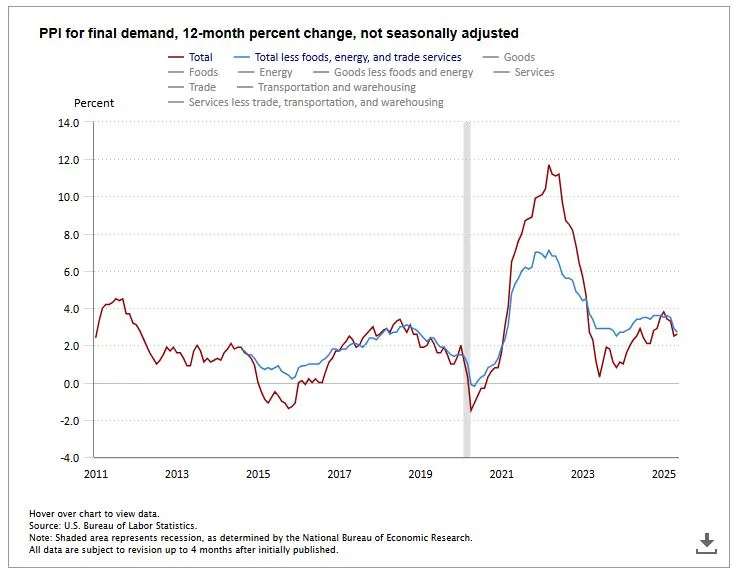
Producer Price Index YoY, Bureau of Labor Statistics (BLS), 12/06/2025
US Producer Price Index Report (May 2025):
Breaking: US core PPI falls to 3.0% YoY in May, up 0.1% MoM. The report misses expectations, with markets predicting a higher rate of 3.1% YoY.
As part of the same release, non-core PPI rose to 2.6% YoY, up 0.1% MoM.
Key takeaway: Core US producer inflation is falling faster than previously expected.
Market Reaction
In the minutes following the release, EUR/USD rose by 0.18%, partially recovering daily losses, while the Dow Jones /fell by 0.10%.
In the minutes that followed the release, EUR/USD rose by 0.18%, extending daily gains, while the Dow Jones also rose by 0.05%. Gold (XAU/USD) also trades higher, up/down 0.05% since the release.
US initial jobless claims unchanged at 248k, match expectations
US initial jobless claims were unchanged at 248k in the week ended June 7, slightly below expectation of 251k. Four-week moving average of initial claims rose 5k to 240k, highest since August 26, 2023.
Continuing claims rose 54k to 1956k in the week ending May 31, highest sine November 13, 2021. Four-week moving average of continuing claims rose 20k to 1915k, highest since November 27, 2021.
US PPI up 0.1% mom, 2.6% yoy in May
US PPI rose 0.1% mom in May, below expectation of 0.2% mom. PPI services rose 0.1% mom, while PPI goods rose 0.2% mom. PPI less food, energy and trade services rose 0.1% mom.
For the 12 months period, PPI rose from 2.5% yoy to 2.6% yoy, matched expectations. PPI less food, energy and trade services rose 2.7% yoy.
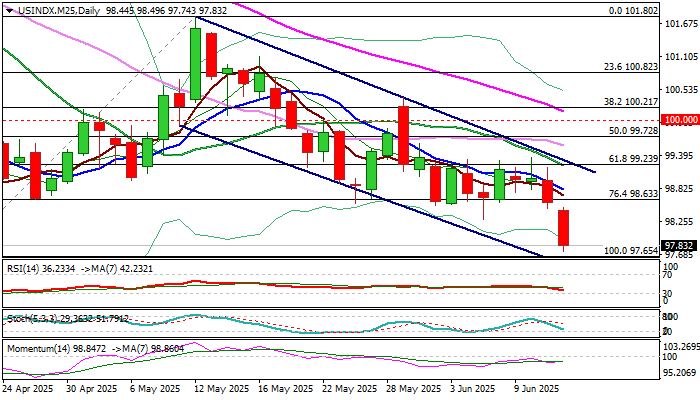
Dollar Index: Bears Remain Firmly in Play and Pressure Key Supports
The dollar index remains firmly in red for the second consecutive day, under increased pressure on growing prospects of Fed rate cuts (following softer than expected inflation in May) and persisting uncertainty over tariff saga.
Fresh acceleration on Thursday pushed the dollar below 98 mark for the first time in seven weeks and increased pressure on key support at 97.65 (2025 low of Apr 21, the lowest since March 2022/ near bear channel lower boundary), violation of which signal an end of broader consolidation and generate signal of continuation of larger downtrend from 110.00 (Jan 13 peak).
Firm break of 97.65 pivot to expose targets at 96.06 (Fibo 138.2% projection of descend from 101.80) and 95.18 (Fibo 76.4% retracement of 89.15/114.72 (2021/2022 uptrend).
Res: 98.49; 98.80; 99.31; 99.72.
Sup: 97.65; 97.50; 96.67; 96.06.
ECB Schnabel: Monetary easing nears end as Europe embraces stronger Euro and fiscal support
ECB Executive Board Member Isabel Schnabel signaled today that the central bank's monetary easing cycle is “coming to an end,” citing stable medium-term inflation forecasts and improving macroeconomic conditions.
Speaking with notable confidence, Schnabel downplayed the expected dip in inflation—projected at just 1.6% in 2026—as a "temporary deviation" caused by energy base effects and a stronger euro.
Schnabel painted a relatively constructive picture of the Eurozone economy, stating that growth remains "broadly stable" even as global trade tensions intensify. Private consumption continues to provide a key pillar of support, while both manufacturing and construction sectors are showing signs of recovery. She also highlighted that "Additional defense and infrastructure spending counteract tariff shock on growth".
In her view, these structural shifts, combined with a resilient Euro and outperforming equity markets, reflect a “new European growth narrative” that could elevate the region’s economic standing.
Still, Schnabel acknowledged the risks posed by escalating trade tensions, particularly in the form of inflation volatility and financial market uncertainty. She warned that tariffs can be amplified through global value chains, posing upside risks to inflation. At the same time weaponisation of raw materials threatens to further strain supply chains.
XAU/USD: Gold Rises on Geopolitical Tensions /Fed Rate Cut Prospects
Gold hit one-week high early Thursday, in extension of Wednesday’s nearly 1% advance when gold price was inflated by softer than expected US inflation numbers that boosted bets for Fed rate cuts and weakened dollar.
Escalation in geopolitics after Israel threatened of attacking Iran caused fresh rally into security and lifted gold price away from critical $3000 support zone, shifting near term focus to the upside.
Quick pullback from new high ($3377) reached $3338 low but repeatedly closed above important Fibo support at $3345 (38.2% of $3293/$3377 upleg, reinforced by rising 200HMA) on hourly chart.
Subsequent strong bounce adds to hopes that pullback was temporary and positioning for fresh push higher as technical picture on hourly chart is predominantly bullish.
Fresh recovery needs a clear break above cracked $3360 zone (Fibo 61.8% of $3377/$3338 bear-leg) to verify positive signal.
Regain of session high $3377 to open way for another attack at $3400 zone (psychological / June 6 peak), violation of which to further improve the picture on daily chart and expose key target at $3500 (new record high).
Caution on dip below 20HMA ($3355) that would make the downside more vulnerable and keep lower triggers at $3340 zone and $3327 (trendline support) at increased risk.
Res: 3377; 3400; 3410; 3437.
Sup: 3345; 3338; 3327; 3310.