Sample Category Title
GBP/USD Rises Further—Bulls Tighten Grip as Rally Accelerates
Key Highlights
- GBP/USD started a fresh increase above the 1.3520 resistance.
- It cleared a contracting triangle with resistance at 1.3535 on the 4-hour chart.
- EUR/USD is gaining pace and might clear the 1.1550 resistance.
- Bitcoin price struggled to clear the $110,500 resistance zone.
GBP/USD Technical Analysis
The British Pound remained well-bid above 1.3350 against the US Dollar. GBP/USD climbed above the 1.3450 and 1.3500 resistance levels.
Looking at the 4-hour chart, the pair settled above the 1.3520 level, the 100 simple moving average (red, 4-hour), and the 200 simple moving average (green, 4-hour). It cleared a contracting triangle with resistance at 1.3535.
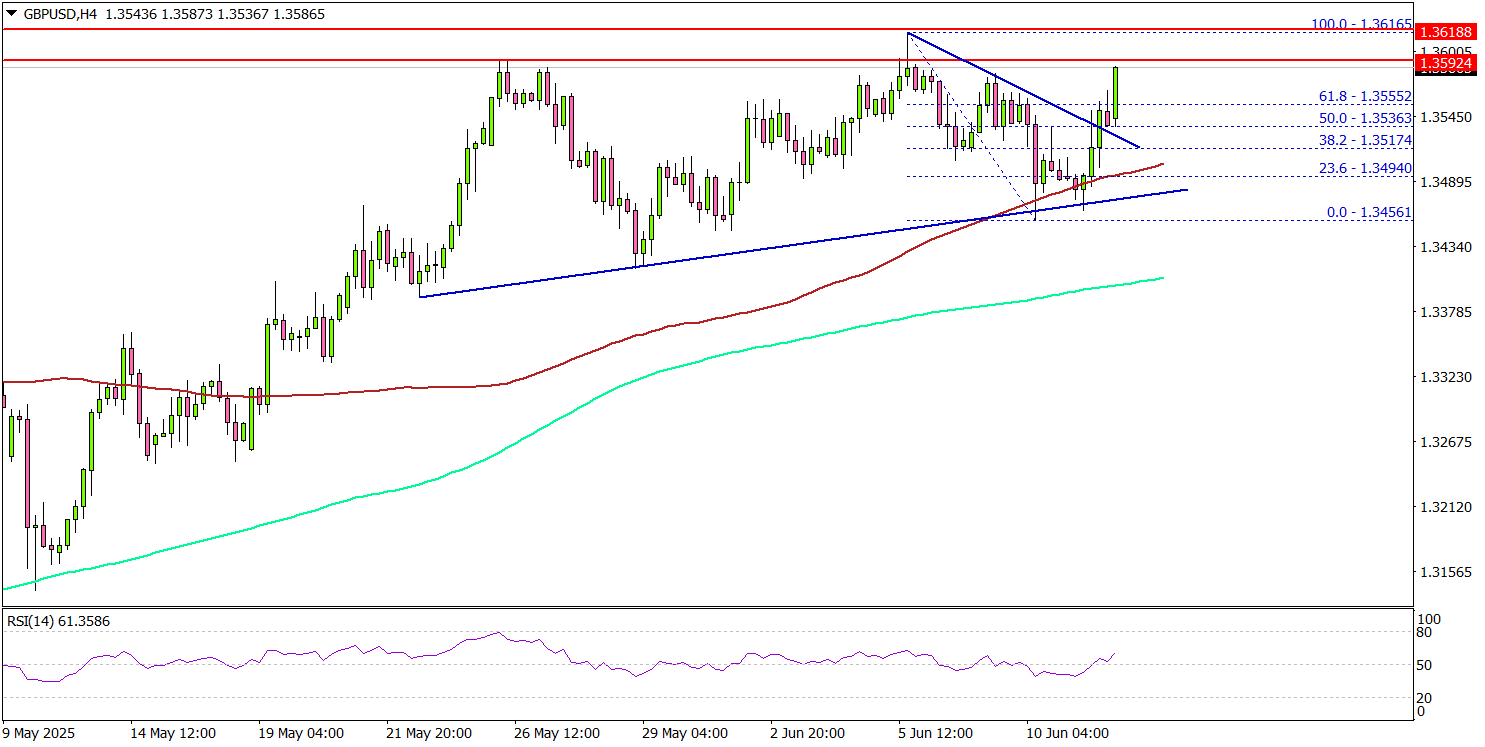
On the downside, immediate support is near the 1.3550 level. The next key support sits near 1.3520. Any more losses could send the pair toward the 1.3500 pivot level and the 100 simple moving average (red, 4-hour) in the near term. The main support could be near 1.3440.
On the upside, the pair could face resistance near the 1.3620 level. The next key resistance sits near the 1.3650 level. The first major resistance sits at 1.3700. A close above the 1.3700 level could set the pace for another increase.
In the stated case, the pair could even clear the 1.380 resistance. The next major stop for the bulls could be near the 1.4000 resistance.
Looking at EUR/USD, the pair started another increase, but the bulls seem to be facing hurdles near the 1.1550 level.
Upcoming Economic Events:
- US Initial Jobless Claims - Forecast 240K, versus 247K previous.
- US Producer Price Index for May 2025 (YoY) – Forecast +0.2%, versus -0.5% previous.
EURJPY Wave Analysis
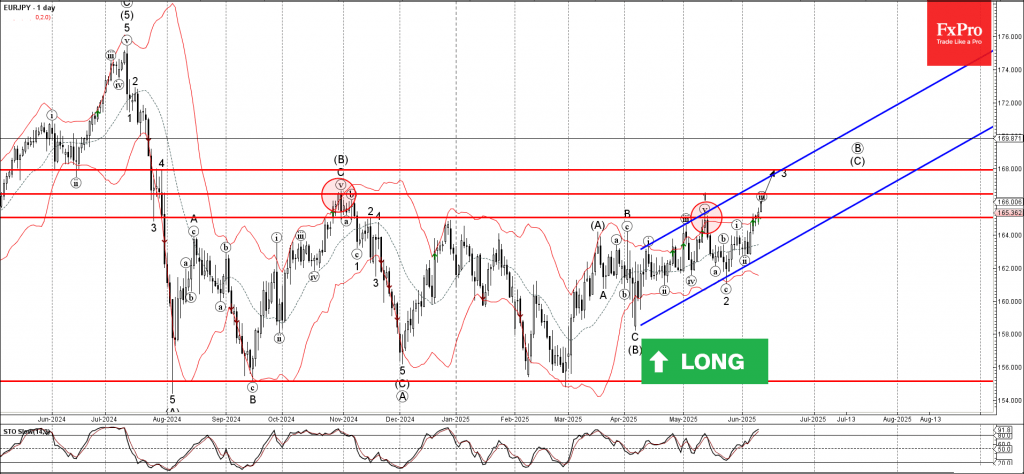
EURJPY: ⬆️ Buy
- EURJPY broke the key resistance level 165.00
- Likely to rise to the resistance level 168.00
EURJPY currency pair recently broke the key resistance level 165.00 (which has been steadily reversing the pair from the start of November, as can be seen from the daily EURJPY chart below).
The breakout of the resistance level at 165.00 accelerated the active sub-impulse wave 3 of the higher-order impulse wave (C) from April.
EURJPY currency pair can be expected to rise to the next resistance level 166.50 (former multi-month high from November) – the breakout of which can lead to further gains toward 168.00.
Nikkei 225 Wave Analysis
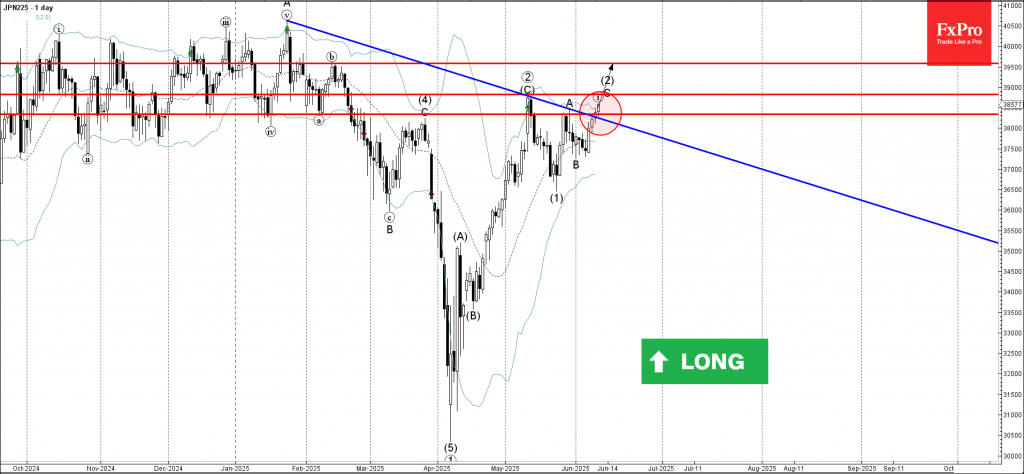
Nikkei 225: ⬆️ Buy
- Nikkei 225 broke the resistance area
- Likely to rise to the resistance level 39500.00
The Nikkei 225 index recently broke the resistance area lying at the intersection of the resistance level 38340.00 (top of wave A from the end of May) and the resistance trendline from January.
The breakout of this resistance area accelerated the C-wave of the active ABC correction (2) from last month.
The Nikkei 225 index can be expected to rise to the next resistance level 39500.00 (a former monthly high from February).
Prices in the US Rising More Slowly than Expected, Putting Pressure on Dollar
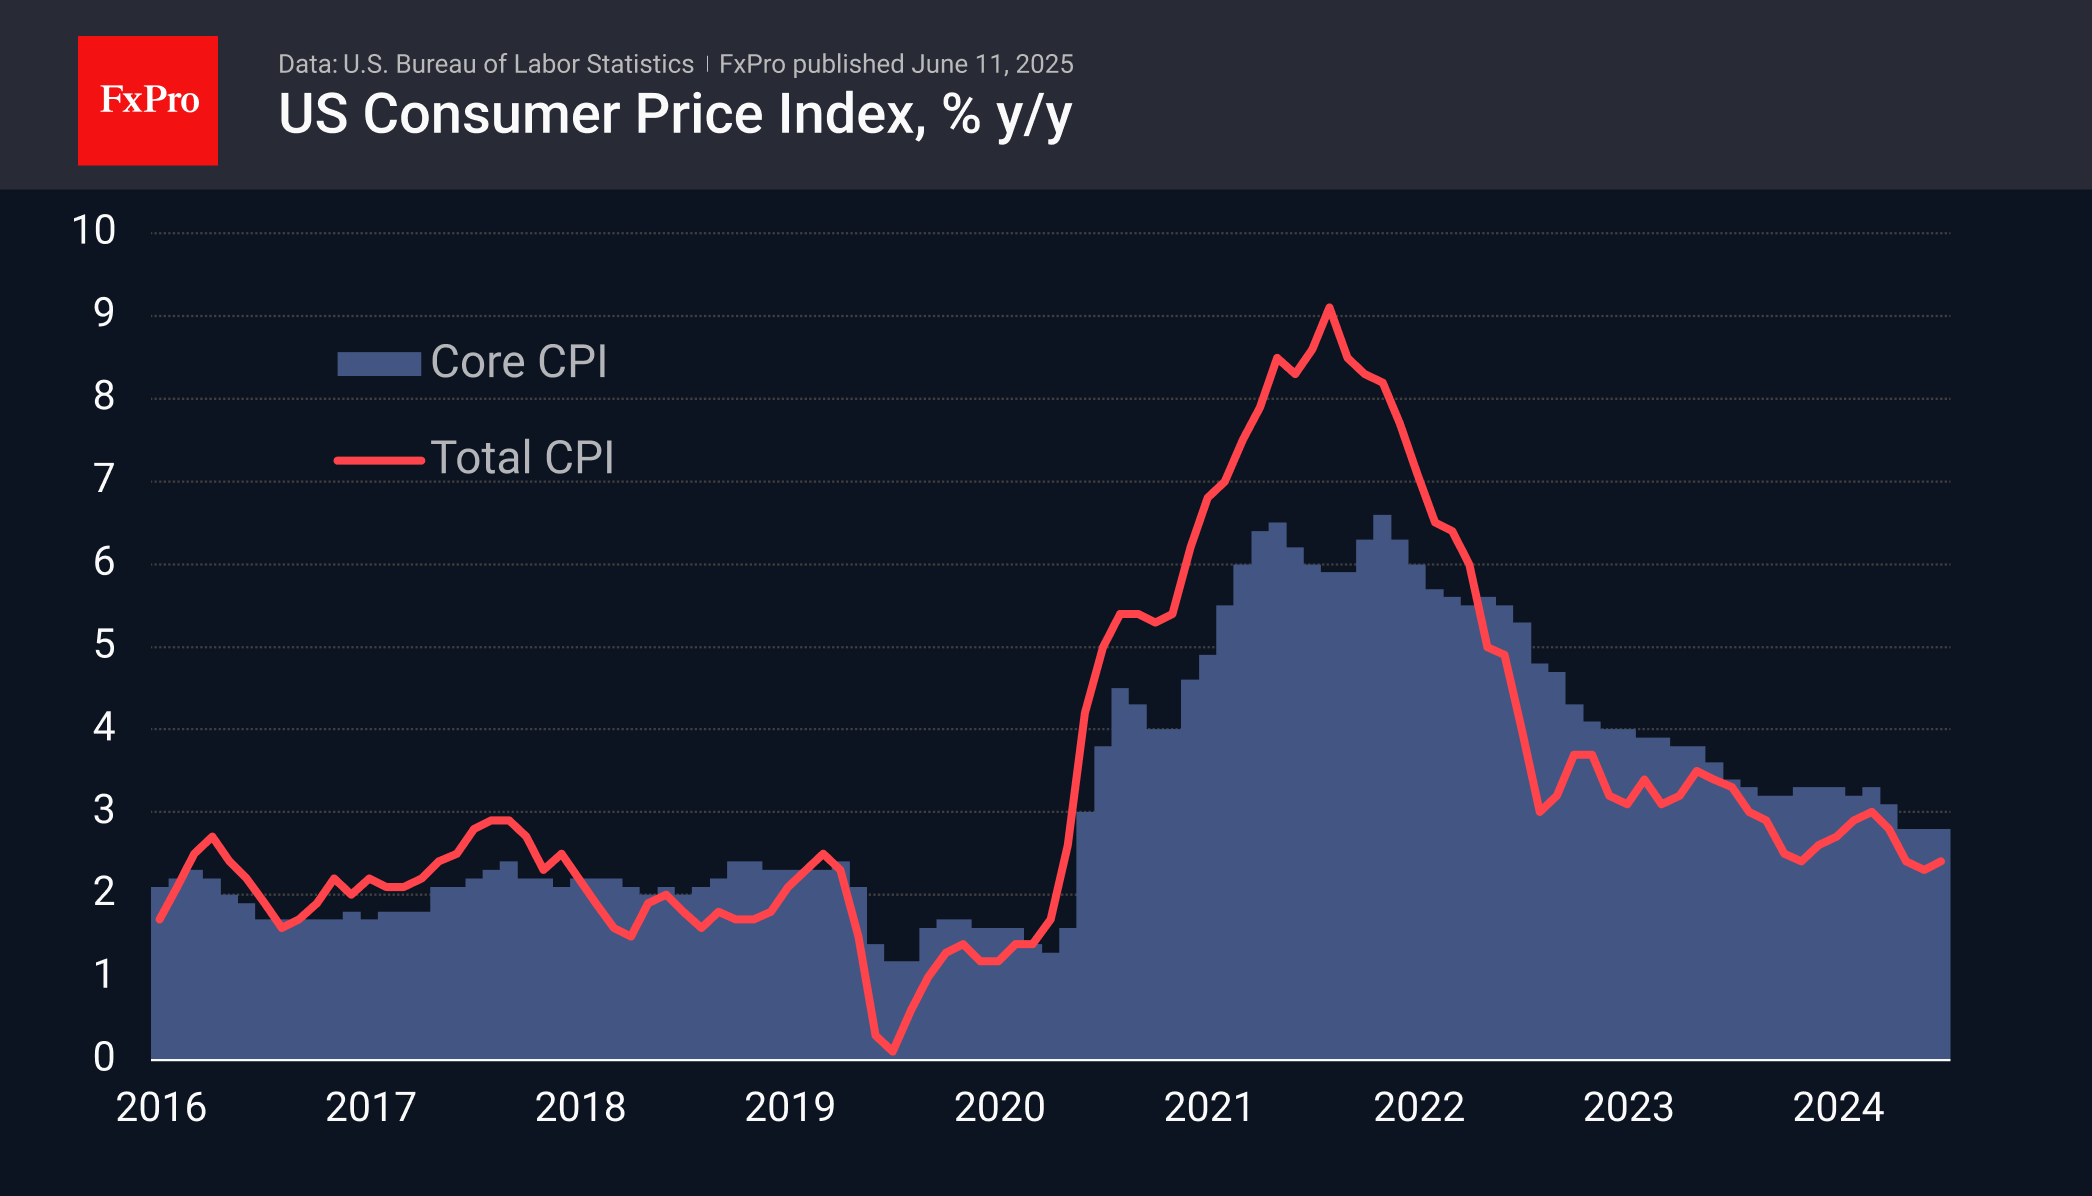
Consumer prices in the US rose by 0.1% in May against the expected 0.2%, falling below analysts’ average forecasts for four months in a row. The annual growth rate was 2.4% for the overall index and 2.8% for the core index (excluding food and energy). In the latter case, the current rate of price growth has remained unchanged for the third month in a row, being the lowest in the last four years.
Tariff disputes have not yet caused a significant surge in inflation. This is understandable, as goods at the new prices have not yet reached consumers. However, it is also important to note that sellers are not rushing to pass on costs in advance, as is the case in many countries. We saw the same slowness in price increases and an insignificant impact on overall inflation during the first trade wars of 2018.
In response to the publication, the dollar index lost 0.5% in the first few minutes but recovered about half of that afterwards. Overall, this is bearish news for the dollar, bolstering the arguments of the doves in the Fed and playing into the hands of stock indices.
Euro Making Its Way Up, Breaking a Long-Standing Trend
The single currency has been showing a trend of increasingly higher local declines throughout the month. Growth impulses in April and earlier in June hit an invisible soft ceiling approaching 1.15, but this appears to be only a temporary shake-up of positions after an impressive rise and before further growth.
The euro is supported by politicians who are one after another abandoning budgetary constraints in favour of stimulus measures. The stimulus measures are concentrated in the military sector, but this is largely irrelevant to the currency market. The recent decline in energy prices, an important item of industry expenditure, is also positive for the euro.
We also note the sustained support that EURCHF and USDCHF have experienced over the past couple of months, suggesting that the Swiss National Bank is working to curb the franc’s growth, a familiar task for this central bank.
As a result of all these forces, the euro is trading close to 166 against the Japanese yen, near its October highs, adding 7.5% to its February lows. EURUSD is completing a corrective pullback from 1.1570 to 1.1060, which took place in April-May. Technically, breaking through the latest highs will make the next target the 1.24-1.25 area, surpassing the 2020 peaks.
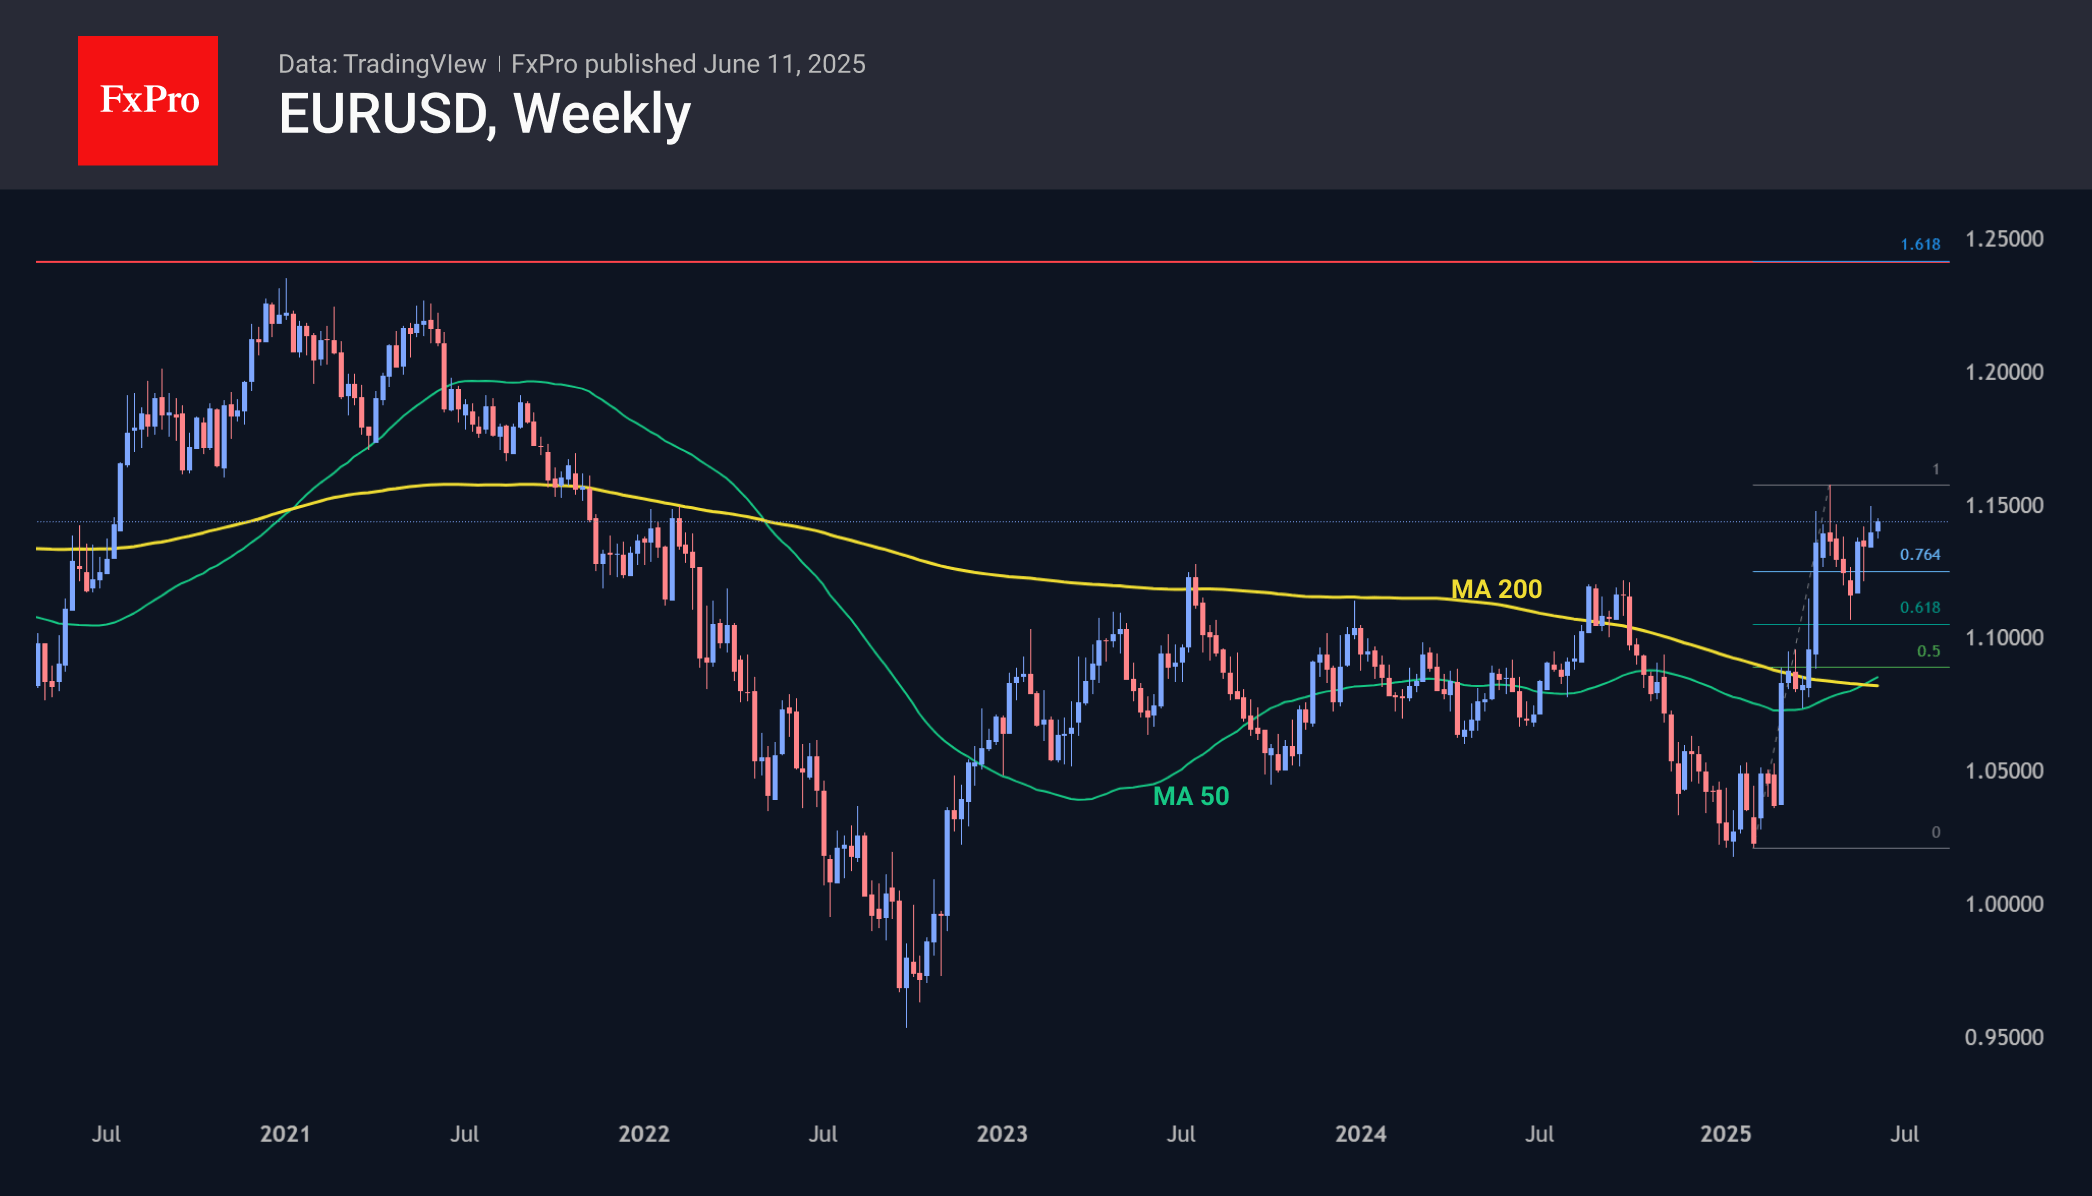
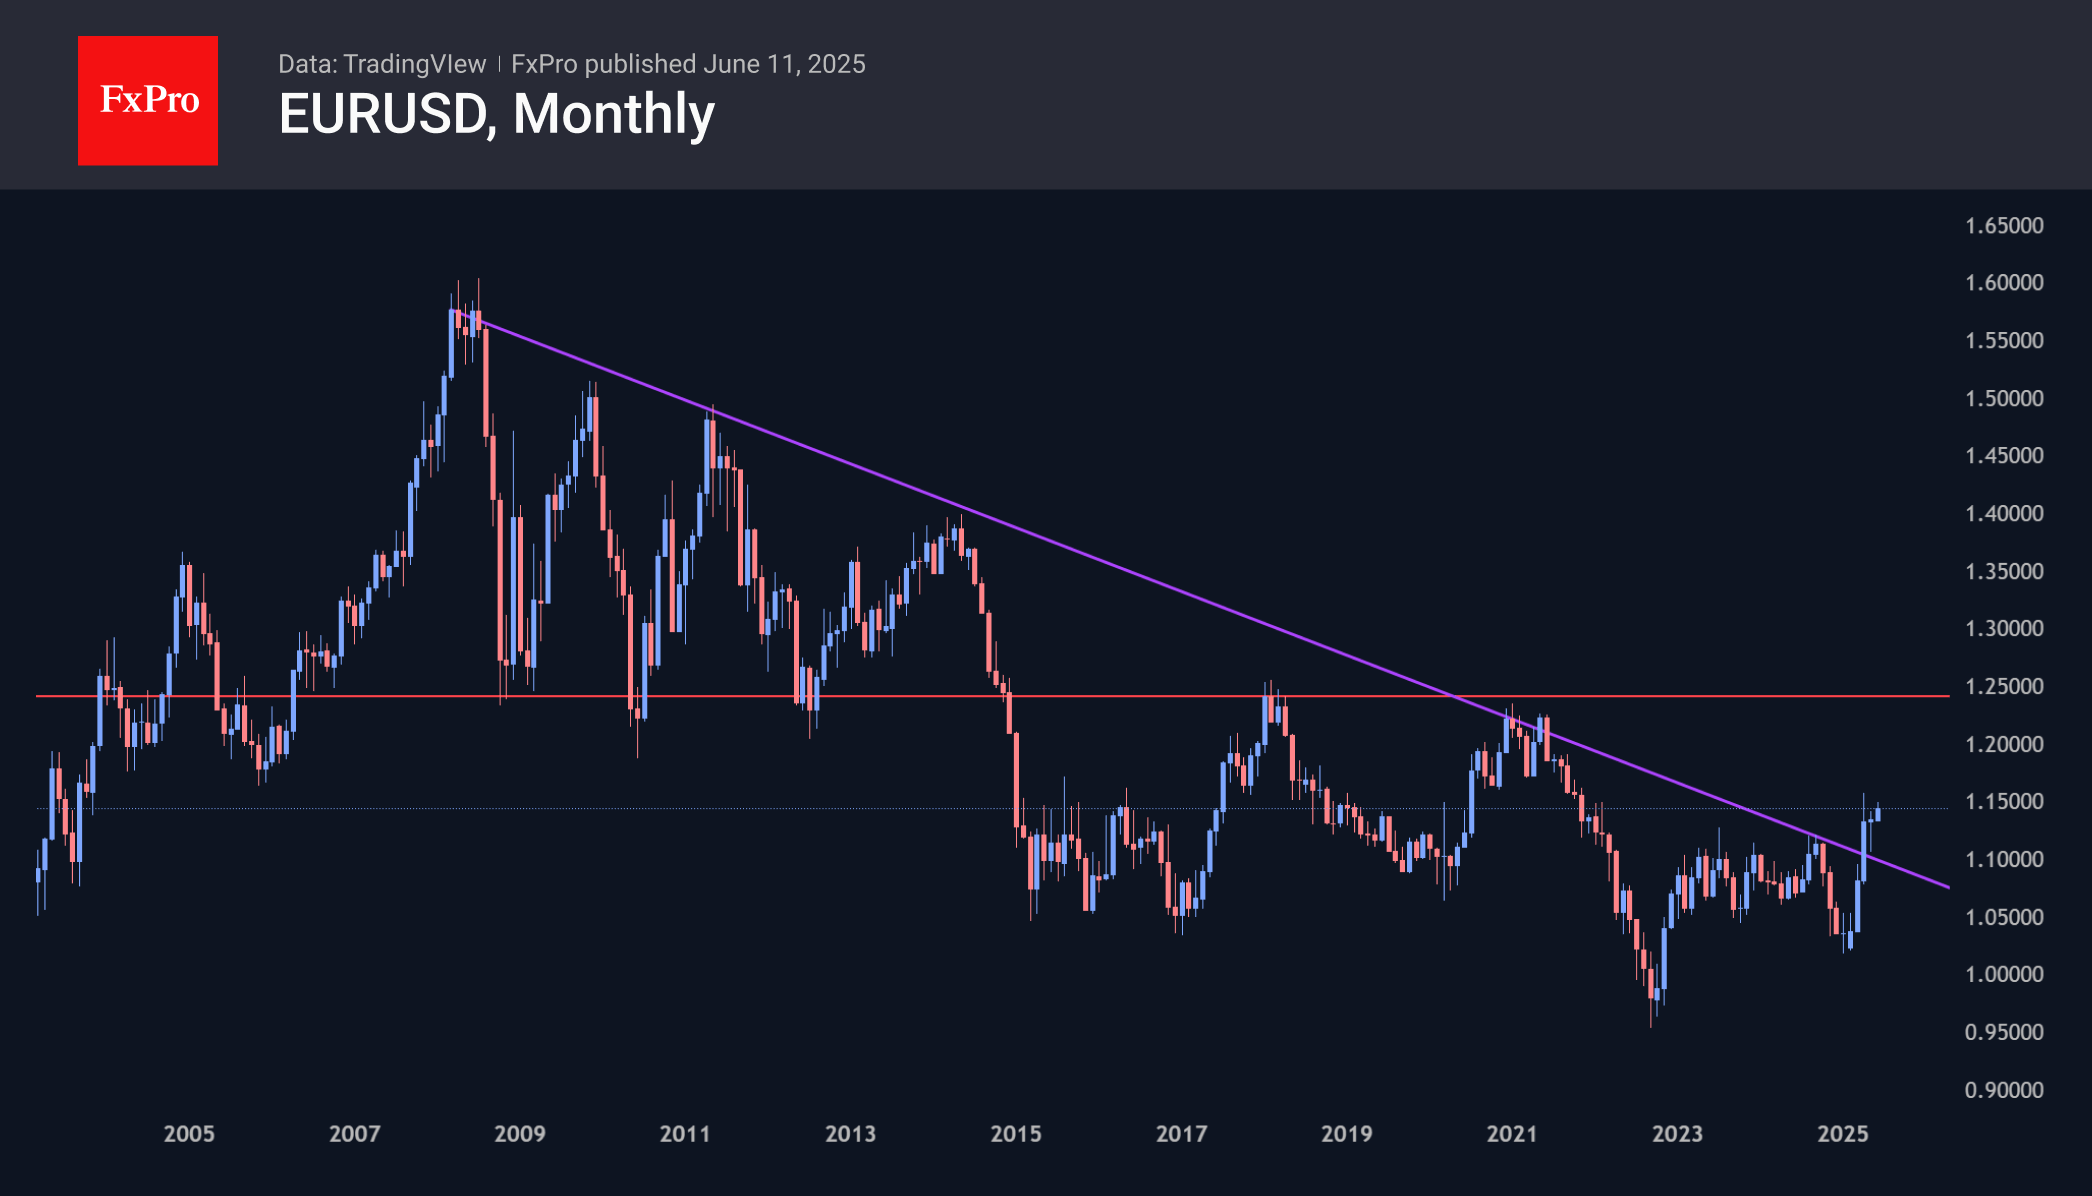
This year’s EURUSD growth has broken the long-term downward trend. However, confirmation will be needed with growth above the previous cyclical high in the 1.25 area before it is justified to talk about a new long-term growth cycle for the euro, like that seen in 2002. Fundamentally, this will require a return to soft monetary policy with a tolerant view of inflation slightly above 2% and a reduction in rates at the first signs of an economic slowdown. This is not Powell’s current approach, but who knows what fate awaits us around the corner?
Sunset Market Commentary
Markets
The framework deal agreed between the US and China overnight didn’t trigger an outsized market reaction. It is seen as confirming the trade truce reached in Geneva last month. Both countries are trying to create some goodwill, by agreeing to easing restrictions on exports of rare earths (China) or technology (US). Still, scant communication post the meeting also indicates that the heavy lifting of an in depth agreement on trade and tariffs between the two countries still has to be done. Equity indices in Europe and US futures trade little changed to even marginally lower as markets headed into the US CPI release to be published at the start of US dealings. Yields in Europe and the US at that point added 2-4 bps across the curve.
US May inflation printed softer than expected at 0.1% M/M and 2.4%Y/Y (from 2.3%) for the headline and 0.1% M/M and 2.8% Y/Y (unch.) for the core measure. Energy prices declined 1.0% M/M. Services increased a mild 0.2% M/M (3.7% Y/Y). Goods prices excluding food and energy were unchanged M/M suggesting that, for now, there is only limited pass-through of (potentially) higher tariffs. Evidently, importers still are in some kind of interim period with the final impact of tariffs still highly uncertain. This uncertainty also applies to the Fed assessment, with the US central bank for now not committing to further easing as long as activity and the labour market are holding up well. Even so, the CPI report triggered a bull steepening of the US curve with yields easing between 6 bps (2-y) and 1 bp (30-y). Markets now are again discounting 50 bps of cumulative Fed rate cuts by EoY. German yields are off the intraday top levels on spill-overs from the US and are trade between unchanged (2-y) and +3.0 bps (30-y). The ECB wage tracker ‘predicts’ wage growth in Q4 to slow to 1.7% Y/Y (1.6% in April and compares to 5.4% Y/Y in Q4 2024). Average growth for 2025 is seen at 3.1%. The market reaction to the report was limited. After some consolidation over the previous days, the loss of interest rate support again pressures the dollar. EUR/USD (1.146 area) is closing in on last week’s top (1.1495) with the YTD top (1.1573) looming on the horizon. UK Chancellor of the Exchequer Reeves proposing new spending plans focused on health care, housing and defense (but at the same time testing the limits of fiscal credibility) don’t help sterling. EUR/GBP extends yesterday’s rebound to trade near 0.848.
News & Views
Hungarian inflation unexpectedly rose by 0.2% m/m to be up 4.4% Y/Y in MAY. Core inflation eased to 5% from 4.8% y/y but remains above the central bank’s 3% +/- 1 ppt target. Food prices (included those of processed food) accelerated again despite the profit margin caps the government introduced earlier this year and recently extended through September (and probably all the way through next year’s spring parliamentary elections). Tradeable goods prices rose faster in yearly terms as well but the disinflation in market services continued. The latter could be related to government pressure. Other major moves included a 2.2% increase in gas prices compensating a 1.9% drop in oil. Base effects could push headline inflation lower through July before fluctuating in a 3.7-4.2% range for the remainder of 2025H2, according to KBC Economics. Risks stay tilted to the upside (wages, fiscal loosening, rising domestic demand). A central bank rate cut (if any) from the 6.5% currently remains a distant prospect in these circumstances, especially since it risks pressuring the Hungarian forint again. The HUF recently performed strong though, with EUR/HUF after today’s CPI data testing the 400 barrier for the first time since Liberation Day.
The ECB in its annual review of the international role of the euro found that the share of the common currency in global official foreign exchange reserves remained broadly stable at constant exchange rates, hovering at around 20%. The share of the US dollar declined by 2.0 pts to 57.8%. The ECB said that “these developments align with long-term trends that started in the last decade”. By the end of 2024 the share of currencies other than the USD and the euro had risen to 22.4%, driven by strong gains in non-traditional reserve currencies, including the Loonie and Aussie dollar. The share of gold in total official foreign reserves – comprising foreign exchange and gold holdings – increased to 20% at the end of 2024, surpassing that of euro (16%), on the back of historically high gold prices (around 30% higher in nominal terms) and big purchases, the review noted. The ECB found that central bank increased their gold stock by more than 1000 tonnes of gold last year, which is double the level seen in the previous decade. Central banks worldwide now hold almost as much gold as they did in 1965 during the Bretton Woods era.
CPI Misses, Everything (But Dollar) Rallies–Market Reactions
US Consumer Prices came in notably weaker than expected.
Specifically, Core CPI, which was anticipated at +0.3% month-over-month, registered +0.1% month-over-month, bringing the year-over-year figure to 2.8%.
Headline CPI also showed a softer reading, at 0.1% m/m against a 0.2% expectation.
Markets had remained subdued at the beginning of the week in anticipation of this data, which provides further clarity on the Federal Reserve's dual mandate. As a reminder, last week's Non-Farm Payrolls report surprisingly beat expectations, coming in at 139K versus a 130K consensus.
The market has reacted positively to this news. A strong employment backdrop coupled with easing price pressures presents an ideal scenario for the economy and significantly alleviates concerns about stagflation.
Expect upcoming months' CPI reports to create similar reactions in terms of volatility!
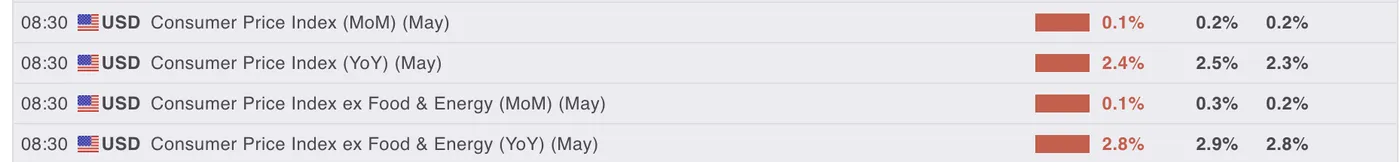
June CPI Data, June 11, 2025 – Source: MarketPulse Economic Calendar
Market Reactions on the charts
Looking at the reactions from the charts, it seems like the market would have been less surprised by a beat than a miss – These asymmetrical expectations create quite volatile movements, there will be a lot of movement today.
Nasdaq Breaks 22,000
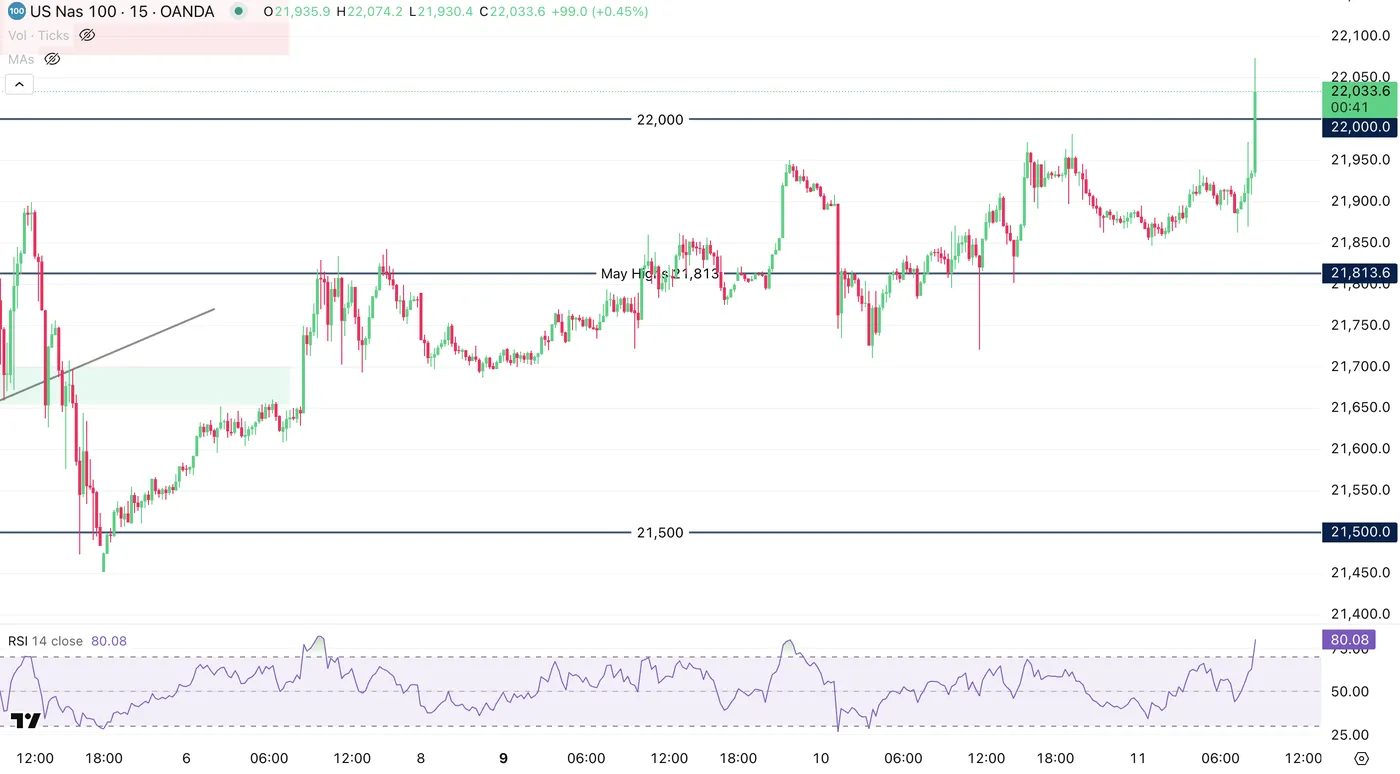
Nasdaq 15m Chart, June 11, 2025 – Source: TradingView
Gold and US Bonds rally
This piece of news allows the pricing of more cuts, great news for both bonds and gold
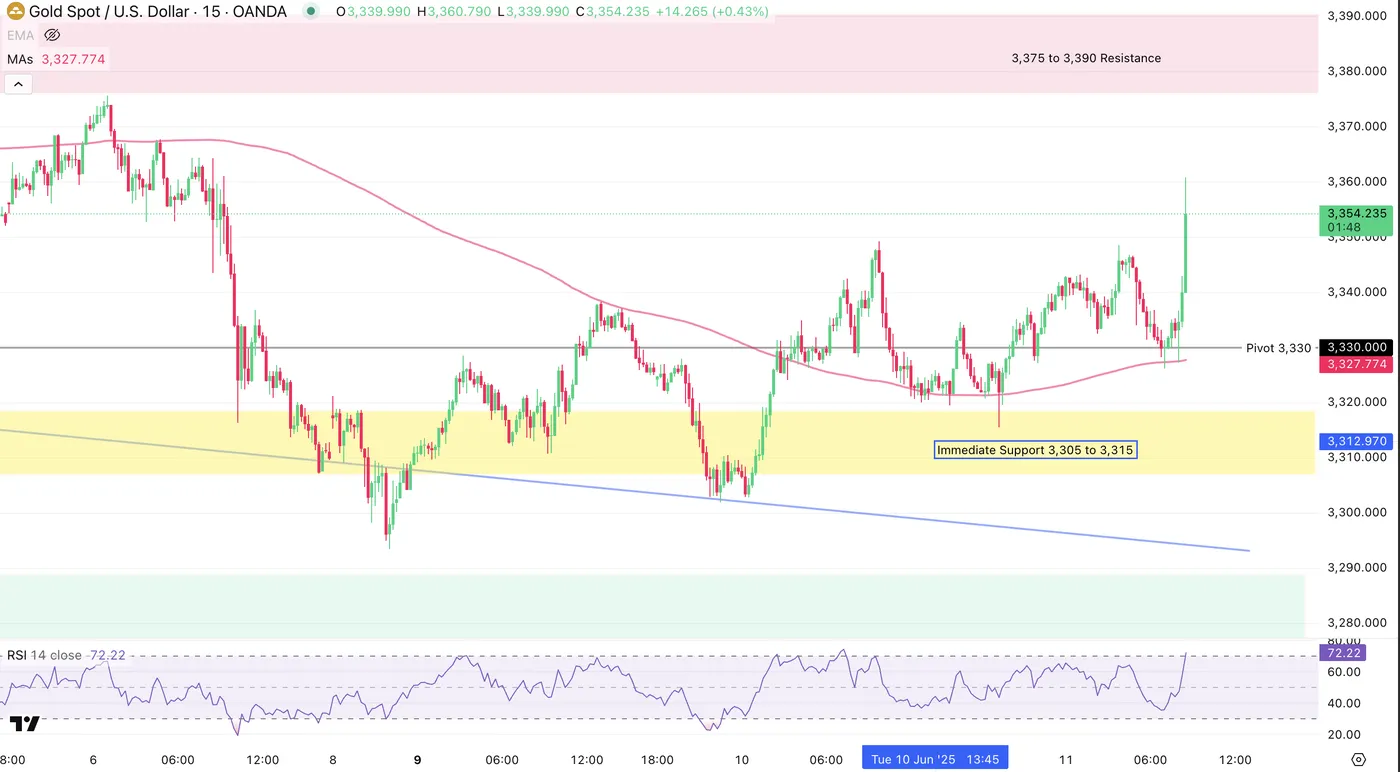
Gold 15m Chart, June 11, 2025 – Source: TradingView
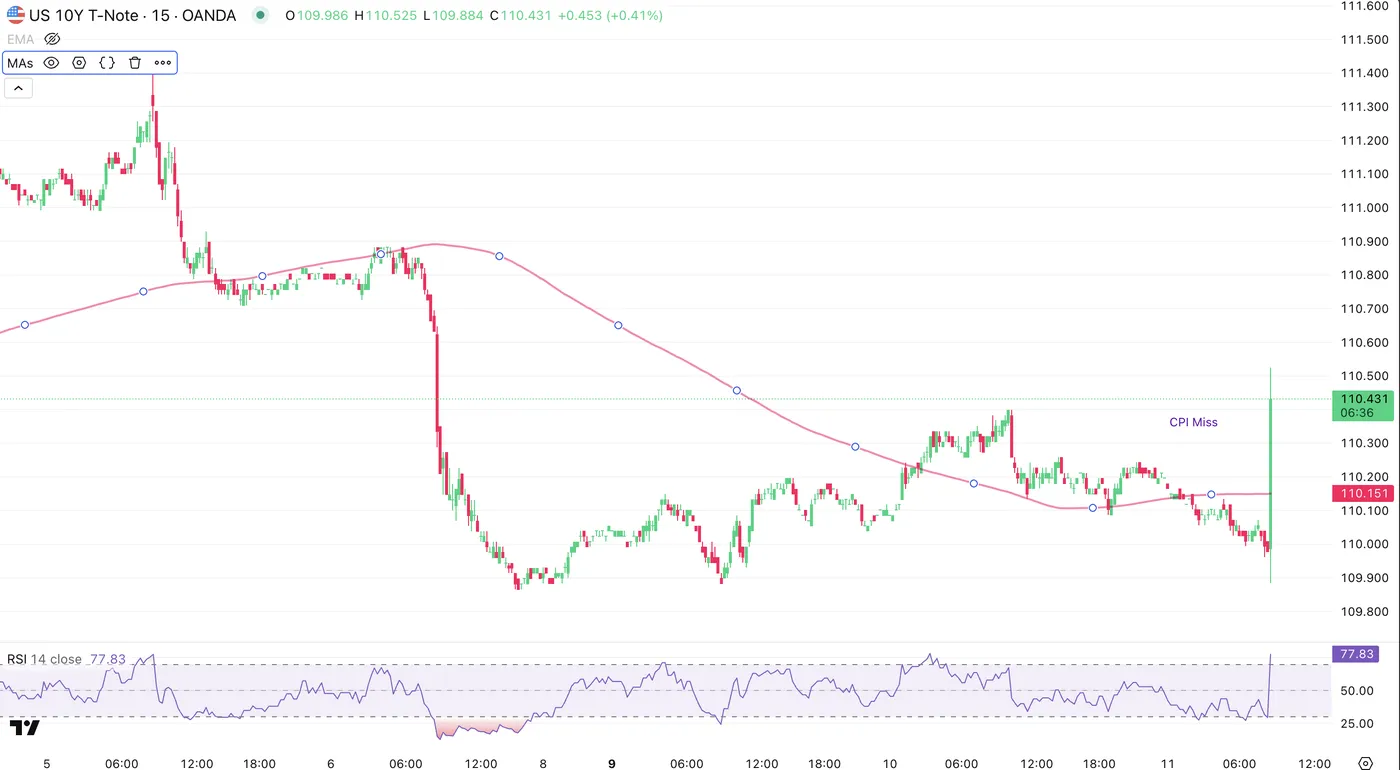
US 10Y Bond 15m Chart, June 11, 2025 – Source: TradingView
The US Dollar Takes a hit on lower inflation, More cuts get priced
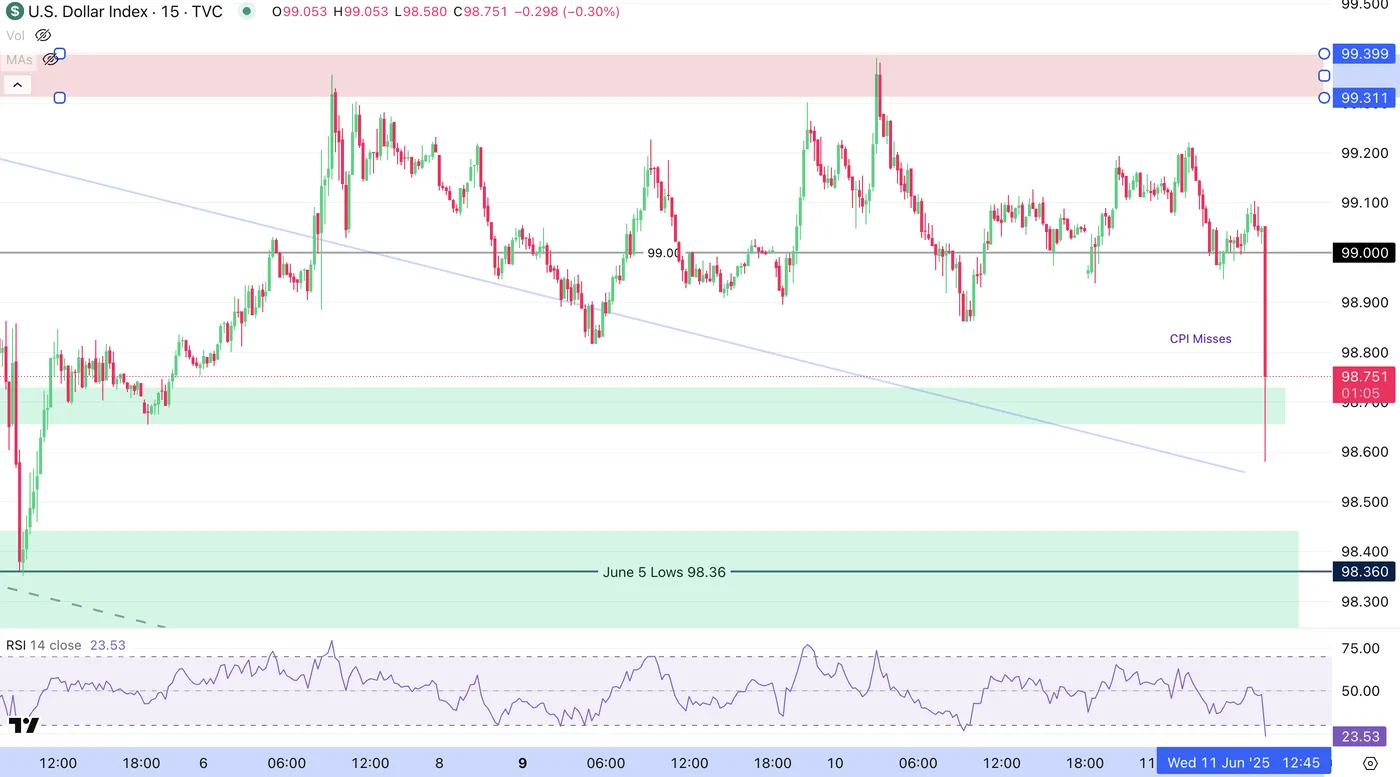
Dollar Index 15m Chart, June 11, 2025 – Source: TradingView
The piece of data largely invalidates the Inverse Head & Shoulders that was building as more cuts get priced in.
I still don't expect the FED to cut on June 18th and expect board members to say that they welcome the news but are waiting for the release of more data – In the meantime, markets are still euphoric all-around.
Commodities and Cryptos are also rallying with WTI up 2% on the session.
Safe Trades!
US: Inflationary Pressures Remain Subdued in May, But Tariff Impacts Likely to Heat-up over the Coming Months
The Consumer Price Index (CPI) rose 0.1% in May, a tick below the consensus forecast in Bloomberg and modest deceleration from April's gain of 0.2% m/m. On a twelve-month basis, CPI was up 2.4% (from 2.3% in April).
- Energy costs (-1.0% m/m) were lower on the month and helped to partially offset the uptick in food prices (0.3% m/m).
Excluding food and energy, core inflation rose a subdued 0.1% m/m, marking a deceleration from April's gain of 0.2% m/m. The twelve-month change held steady at 2.8% for the third consecutive month, while the three-month annualized fell to a ten-month low of 1.7%.
Services prices rose a 'soft' 0.2% m/m (0.17% m/m unrounded), as primary shelter costs slowed (to 0.3% m/m from 0.4% m/m in April), while price growth for non-housing services (0.1% m/m) came in on the softer side.
- Travel costs (-0.9% m/m) were down for the fourth consecutive month, as both hotels and airfares were lower. Price growth for recreational services (-0.1% m/m) also registered a decline.
Core goods inflation was flat on the month, but after excluding new (-0.3% m/m) and used (-0.5% m/m) vehicle prices, goods prices were up 0.2% m/m – matching last month's gain.
Key Implications
On the surface, price pressures remained subdued in May. But looking under the hood, there's already some evidence to suggest that tariff passthrough is underway. We expect prices pressures for consumer goods to heat up over the coming months, as businesses drawdown on existing inventory stockpiles and higher input costs start to squeeze profit margins. The push higher on goods prices is likely to eclipse the cooling in services inflation that is currently underway, leading to a turn higher in core inflation measures.
From the Fed's standpoint, this morning's release does little to alter their near-term decision making. Policymakers remain in a holding pattern until they gain more certainty on how the administration's trade and fiscal policies will impact both the real economy and inflation trajectory. With the labor market still healthy and near-term inflation likely to drift higher, the prospect of a summer rate cut has faded. Post release, Fed futures are pricing just 20bps of policy easing by September.
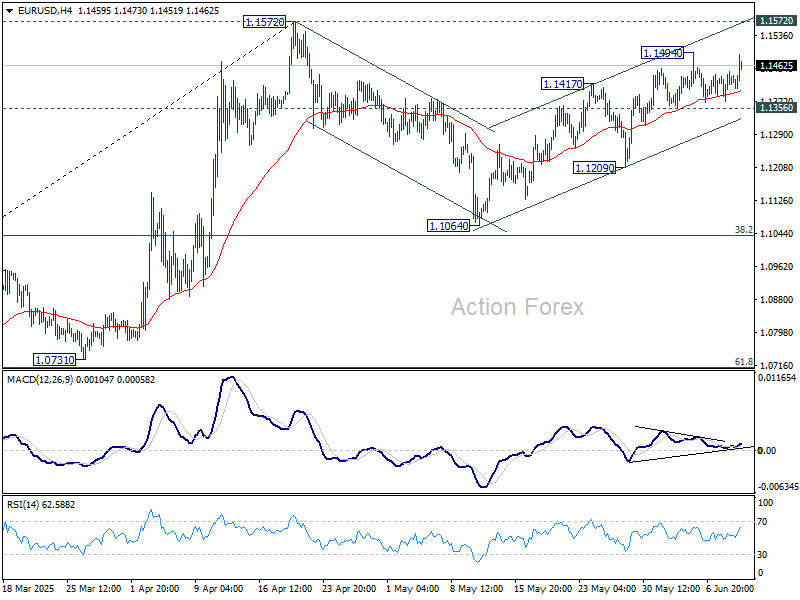
EUR/USD Mid-Day Outlook
Daily Pivots: (S1) 1.1383; (P) 1.1415; (R1) 1.1458; More...
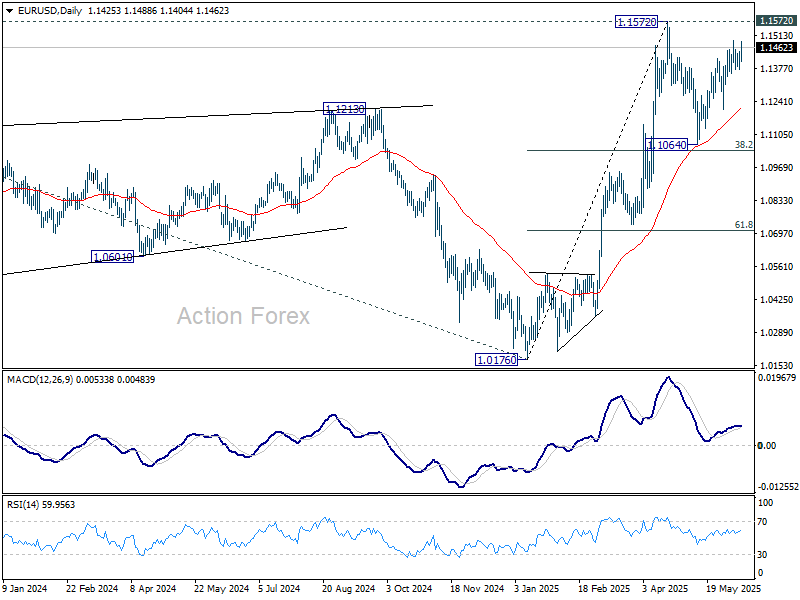
EUR/USD bounced in early US session but stays below 1.1494 resistance. Intraday bias remains neutral first. Price actions from 1.1572 are seen as a corrective pattern to rally from 1.0716. While rebound from 1.1064 might extend, strong resistance should emerge from 1.1572 to limit upside. On the downside, break of 1.1356 support will argue that the correction is already in the third leg, and target 1.1209 support for confirmation.
In the bigger picture, rise from 0.9534 long term bottom could be correcting the multi-decade downtrend or the start of a long term up trend. In either case, further rise should be seen to 100% projection of 0.9534 to 1.1274 from 1.0176 at 1.1916. This will now remain the favored case as long as 55 W EMA (now at 1.0894) holds.