Sample Category Title
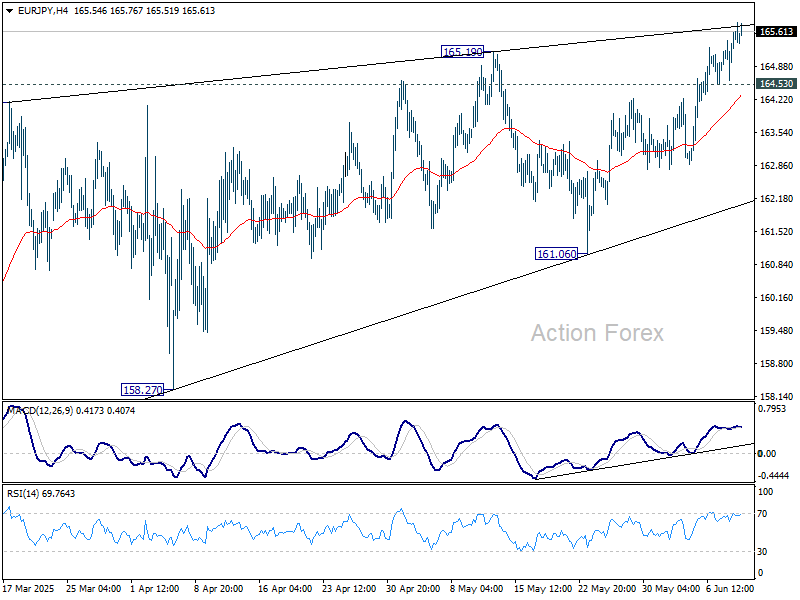
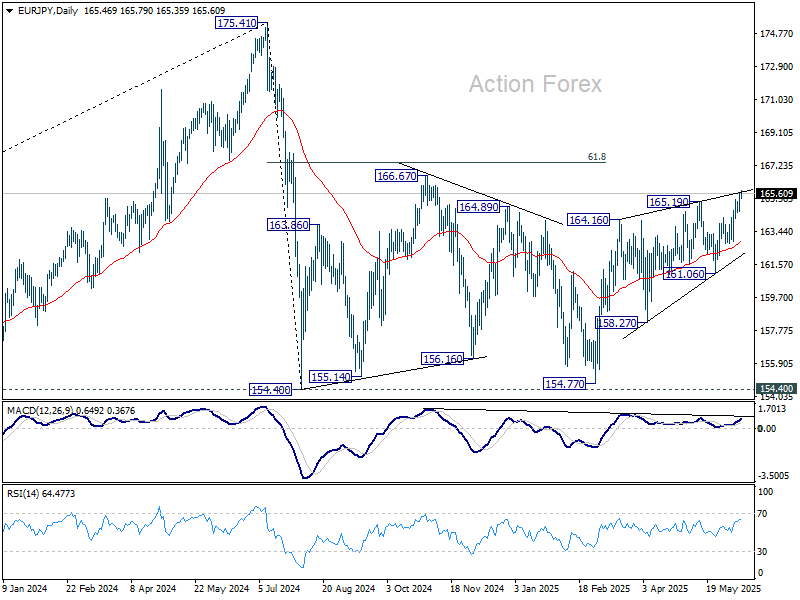
EUR/JPY Daily Outlook
Daily Pivots: (S1) 164.92; (P) 165.28; (R1) 165.93; More...
Intraday bias in EUR/JPY remains on the upside at this point. Current rise from 154.77 would target 166.67 resistance, and possibly further to 61.8% retracement of 175.41 to 154.77 at 167.38. On the downside, below 164.53 minor support will turn intraday bias neutral again first.
In the bigger picture, price actions from 175.41 are seen as correction to up trend from 114.42 (2020 low). Strong support should be seen from 38.2% retracement of 114.42 to 175.41 at 152.11 to contain downside. However, sustained break of 152.11 will bring deeper fall even still as a correction.
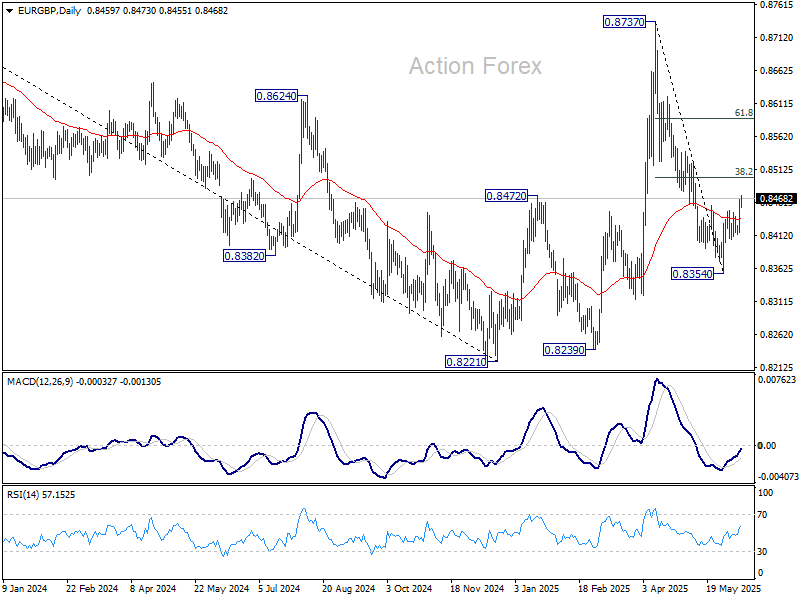
EUR/GBP Daily Outlook
Daily Pivots: (S1) 0.8432; (P) 0.8450; (R1) 0.8483; More...
Intraday bias in EUR/GBP stays on the upside. Rebound from 0.8354 is in progress for 38.2% retracement of 0.8737 to 0.8354 at 0.8500. Strong resistance could be seen from 0.8500 to complete the corrective bounce. On the downside, break of 0.8413 support will bring retest of 0.8354 low. However, firm break of 0.8500 will pave the way to 61.8% retracement at 0.8591 instead.
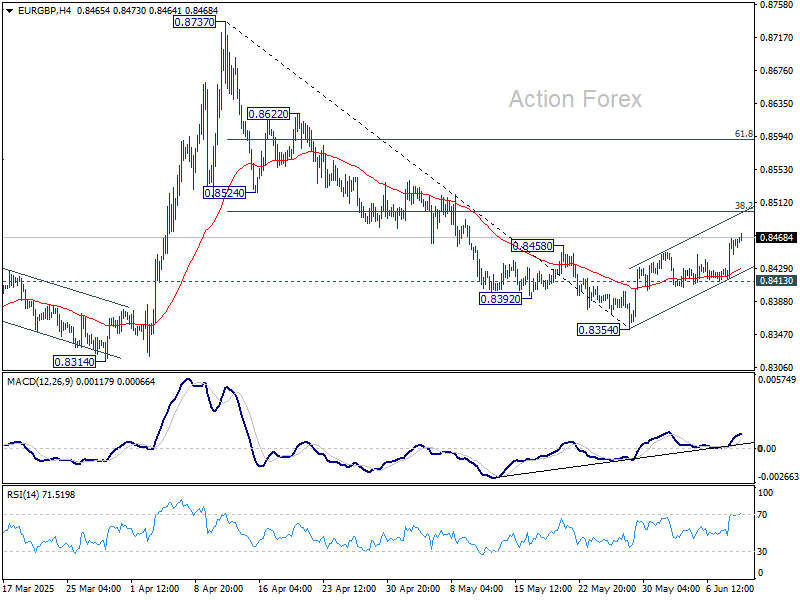
In the bigger picture, price actions from 0.8221 medium term bottom are merely forming a corrective pattern. Nevertheless, there is no clear momentum to break through 0.8201 key support (2022 low) yet. Hence, range trading is expected between 0.8221/8737 for now.
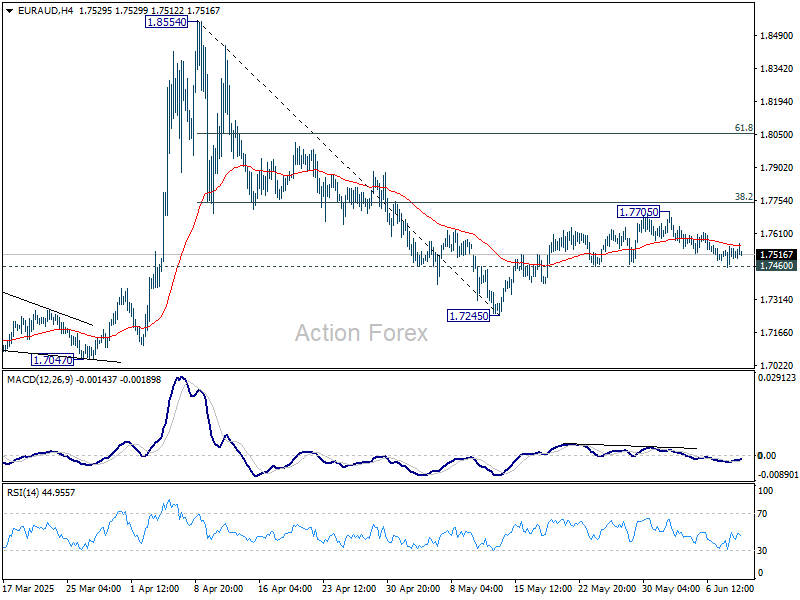
EUR/AUD Daily Outlook
Daily Pivots: (S1) 1.7469; (P) 1.7511; (R1) 1.7559; More...
Intraday bias in EUR/AUD stays neutral at this point. On the downside, firm break of 1.7460 support will suggest that recovery from 1.7245 has already completed at 1.7705, 38.2% retracement of 1.8554 to 1.7245 at 1.7745. Intraday bias will be back on the downside for 1.7245 first. Firm break there will resume whole decline from 1.8554. On the upside, sustained break of 1.7745 will target 61.8% retracement at 1.8054.
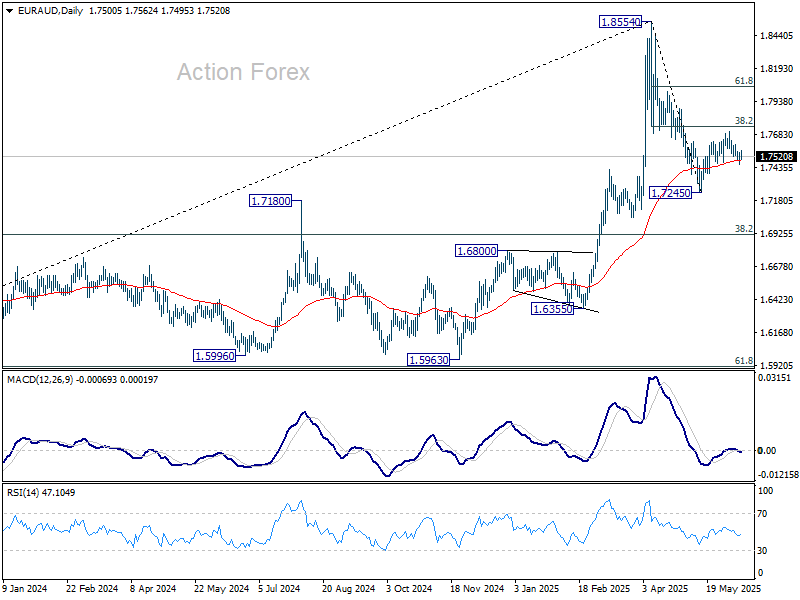
In the bigger picture, with 55 W MACD staying well below signal line, 1.8554 is likely a medium term top already. Price actions from there are seen as a corrective pattern only. While deeper pullback might be seen, downside should be contained by 38.2% retracement of 1.4281 (2022 low) to 1.8554 at 1.6922 to bring rebound. Up trend from 1.4281 is still expected to resume at a later stage.
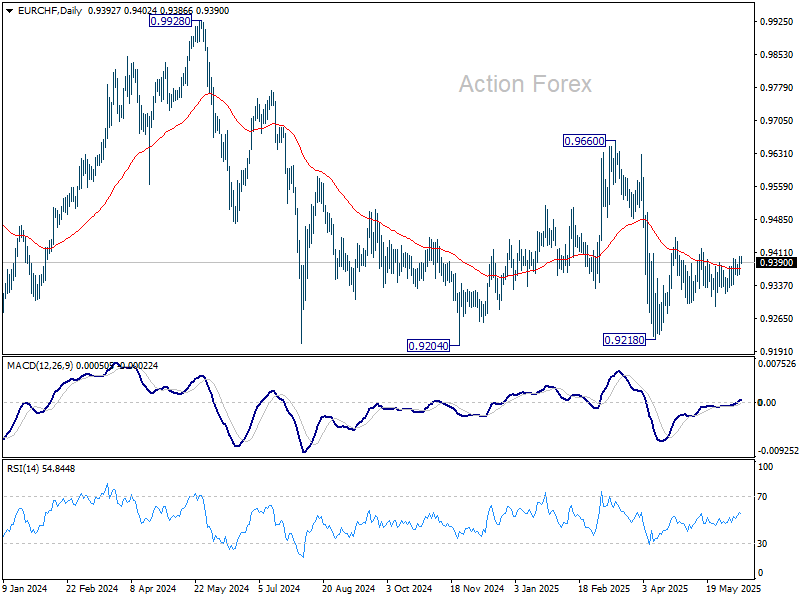
EUR/CHF Daily Outlook
Daily Pivots: (S1) 0.9375; (P) 0.9390; (R1) 0.9417; More....
Intraday bias in EUR/CHF remains neutral for the moment. On the upside, break of 0.9419 resistance will argue that the rise from 0.9218, either as a correction to fall from 0.9660, or the third leg of the pattern from 0.9204, is ready to resume through 0.9445. Nevertheless, on the downside, firm break of 0.9291 will bring retest of 0.9218 low.
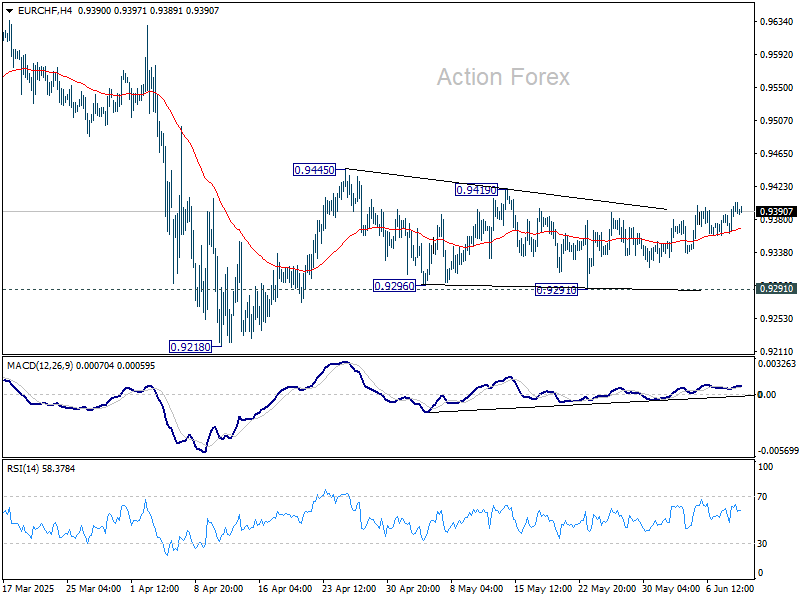
In the bigger picture, prior rejection by long-term falling channel resistance (now at 0.9527) retains medium term bearishness. That is, down trend from 1.2004 (2018 high) is still in progress. Firm break of 0.9204 (2024 low) will confirm resumption. This will remain the favored case as long as 0.9660 resistance holds.
AUD/USD & NZD/USD Aim Steady Increase
AUD/USD started a decent increase above the 0.6450 and 0.6500 levels. NZD/USD is also rising and might aim for more gains above 0.6080.
Important Takeaways for AUD USD and NZD USD Analysis Today
- The Aussie Dollar rebounded after forming a base above the 0.6400 level against the US Dollar.
- There is a connecting bullish trend line forming with support at 0.6510 on the hourly chart of AUD/USD at FXOpen.
- NZD/USD is consolidating gains above the 0.6030 zone.
- There is a key bullish trend line forming with support at 0.6030 on the hourly chart of NZD/USD at FXOpen.
AUD/USD Technical Analysis
On the hourly chart of AUD/USD at FXOpen, the pair started a fresh increase from the 0.6450 support. The Aussie Dollar was able to clear the 0.6500 resistance to move into a positive zone against the US Dollar.
There was a close above the 0.6500 resistance and the 50-hour simple moving average. Finally, the pair tested the 0.6535 zone. A high was formed near 0.6533 and the pair recently started a consolidation phase.
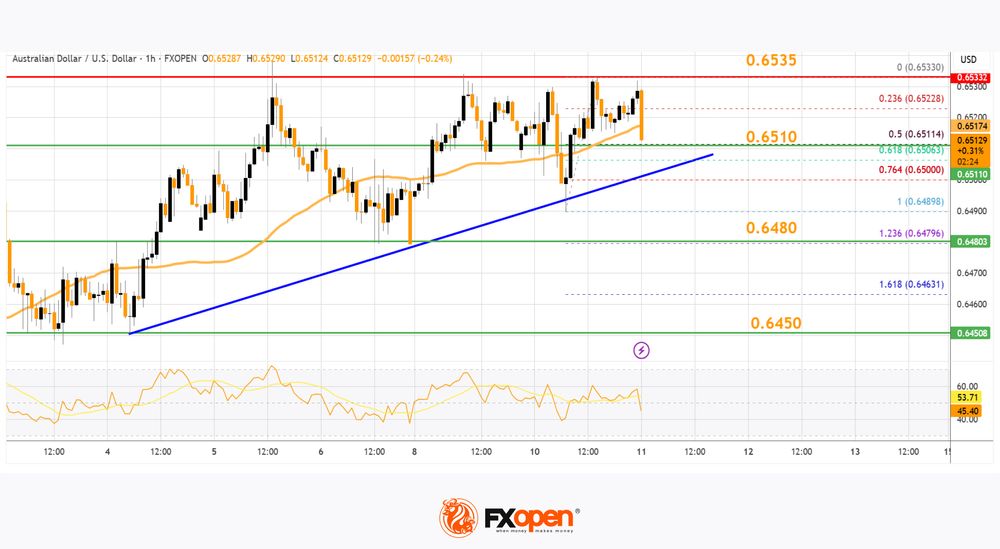
There was a move below the 0.6520 level. The pair dipped below the 23.6% Fib retracement level of the upward move from the 0.6489 swing low to the 0.6533 high.
On the downside, initial support is near the 0.6510 level. There is also a connecting bullish trend line forming with support at 0.6510. It is close to the 50% Fib retracement level of the upward move from the 0.6489 swing low to the 0.6533 high.
The next major support is near the 0.6480 zone. If there is a downside break below the 0.6480 support, the pair could extend its decline toward the 0.6450 level.
Any more losses might signal a move toward 0.6420. On the upside, the AUD/USD chart indicates that the pair is now facing resistance near 0.6535. The first major resistance might be 0.6550. An upside break above the 0.6580 resistance might send the pair further higher.
The next major resistance is near the 0.6600 level. Any more gains could clear the path for a move toward the 0.6650 resistance zone.
NZD/USD Technical Analysis
On the hourly chart of NZD/USD on FXOpen, the pair started a steady increase from the 0.5990 zone. The New Zealand Dollar broke the 0.6020 resistance to start the recent increase against the US Dollar.
The pair settled above 0.6030 and the 50-hour simple moving average. It tested the 0.6065 zone and is currently consolidating gains. The pair corrected lower below the 0.6050 level and the 23.6% Fib retracement level of the upward move from the 0.6006 swing low to the 0.6064 high.
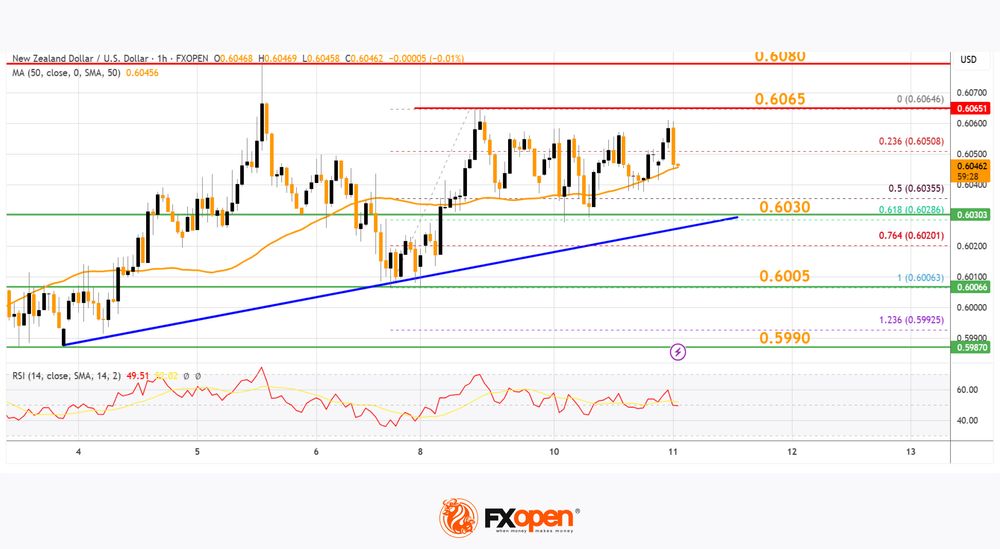
However, the bulls are active above the 0.6030 level. The NZD/USD chartsuggests that the RSI is stable near 50. On the upside, the pair might struggle near 0.6065. The next major resistance is near the 0.6080 level.
A clear move above the 0.6080 level might even push the pair toward the 0.6120 level. Any more gains might clear the path for a move toward the 0.6200 resistance zone in the coming days.
On the downside, immediate support is near the 0.6030 level. There is also a key bullish trend line forming with support at 0.6030. It is close to the 61.8% Fib retracement level of the upward move from the 0.6006 swing low to the 0.6064 high.
The first key support is near the 0.6005 level. The next major support is near the 0.5990 level. If there is a downside break below the 0.5990 support, the pair might slide toward the 0.5970 support. Any more losses could lead NZD/USD in a bearish zone to 0.5950.
Trade over 50 forex markets 24 hours a day with FXOpen. Take advantage of low commissions, deep liquidity, and spreads from 0.0 pips. Open your FXOpen account now or learn more about trading forex with FXOpen.
This article represents the opinion of the Companies operating under the FXOpen brand only. It is not to be construed as an offer, solicitation, or recommendation with respect to products and services provided by the Companies operating under the FXOpen brand, nor is it to be considered financial advice.
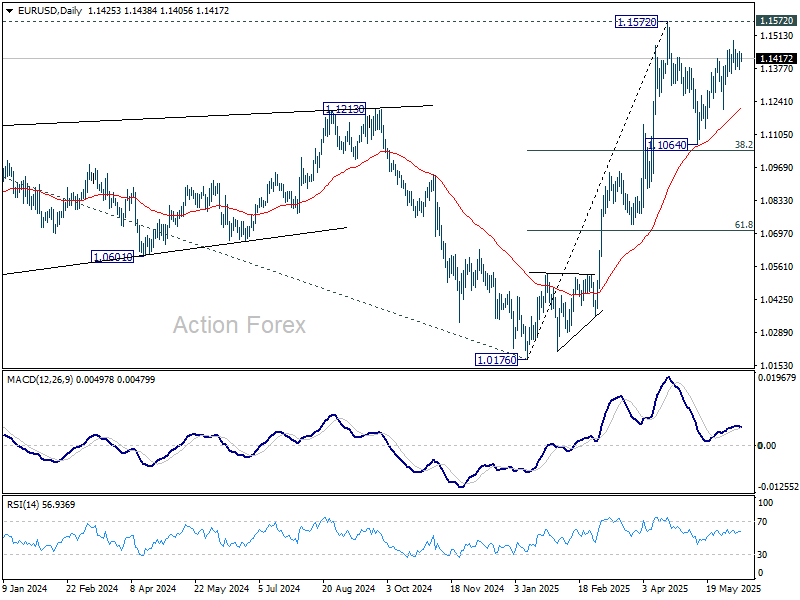
EUR/USD Daily Outlook
Daily Pivots: (S1) 1.1383; (P) 1.1415; (R1) 1.1458; More...
Range trading continues in EUR/USD and intraday bias stays neutral. Price actions from 1.1572 are seen as a corrective pattern to rally from 1.0716. While rebound from 1.1064 might extend, strong resistance should emerge from 1.1572 to limit upside. On the downside, break of 1.1356 support will argue that the correction is already in the third leg, and target 1.1209 support for confirmation.
In the bigger picture, rise from 0.9534 long term bottom could be correcting the multi-decade downtrend or the start of a long term up trend. In either case, further rise should be seen to 100% projection of 0.9534 to 1.1274 from 1.0176 at 1.1916. This will now remain the favored case as long as 55 W EMA (now at 1.0894) holds.
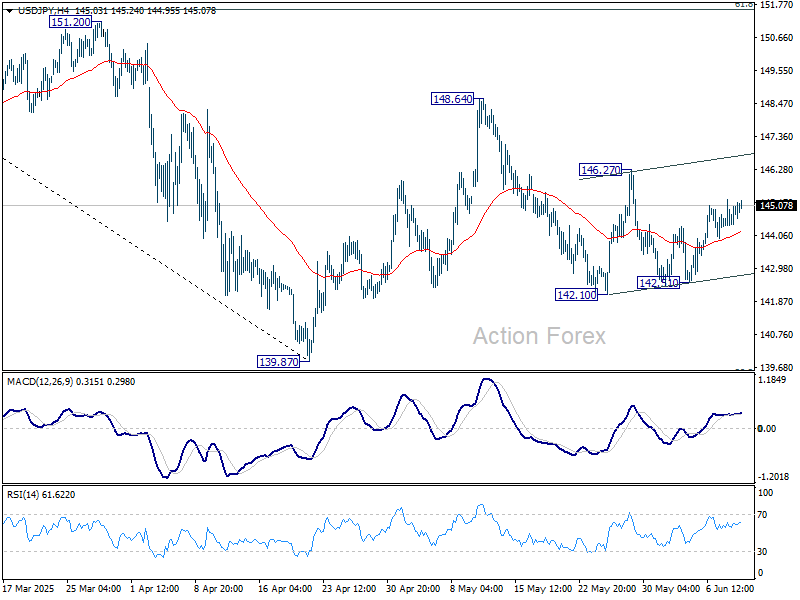
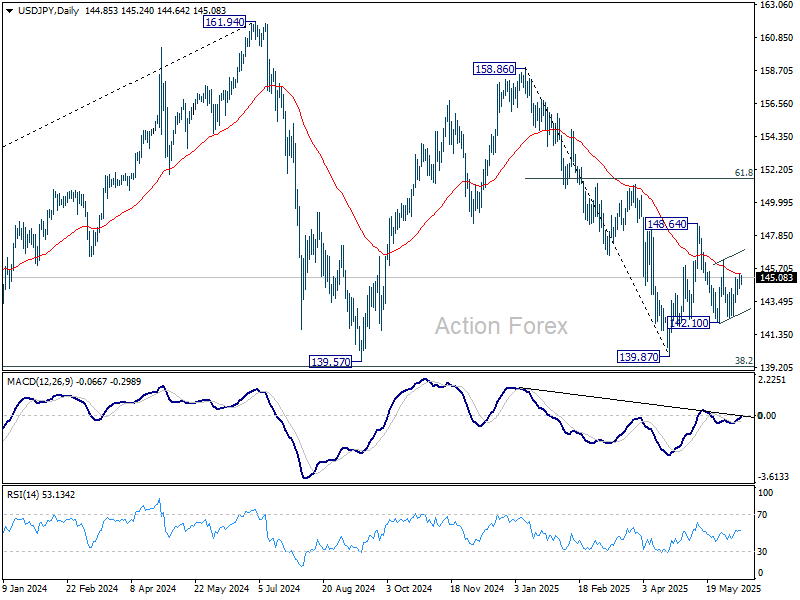
USD/JPY Daily Outlook
Daily Pivots: (S1) 144.44; (P) 144.86; (R1) 145.33; More...
Intraday bias in USD/JPY remains neutral. On the upside, above 146.27 resistance will argue that price actions from 148.64 has completed as a corrective pattern. Intraday bias will be back on the upside for 148.64 resistance and above to resume the rebound from 139.87 low. However, firm break of 142.10 will bring retest of 139.87 instead.
In the bigger picture, price actions from 161.94 are seen as a corrective pattern to rise from 102.58 (2021 low), with fall from 158.86 as the third leg. Strong support should be seen from 38.2% retracement of 102.58 to 161.94 at 139.26 to bring rebound. However, sustained break of 139.26 would open up deeper medium term decline to 61.8% retracement at 125.25.
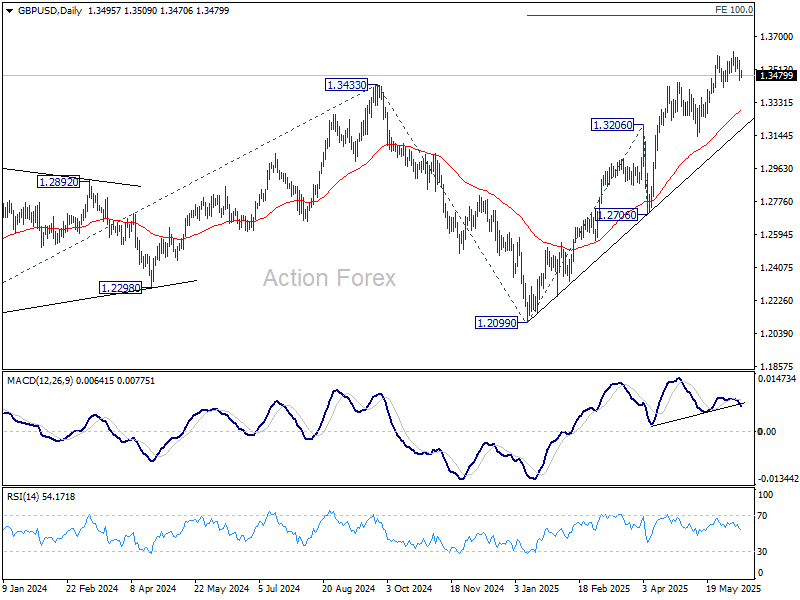
GBP/USD Daily Outlook
Daily Pivots: (S1) 1.3444; (P) 1.3510; (R1) 1.3563; More...
Intraday bias in GBP/USD remains neutral at this point. With 1.3414 support intact, further rally remains in favor. On the upside, break of 1.3615 will resume the rally from 1.2099 and target 100% projection of 1.2099 to 1.3206 from 1.3138 at 1.3813. Considering bearish divergence condition in 4H MACD, break of 1.3414 support should confirm short term topping, and bring deeper correction to 1.3138 support instead.
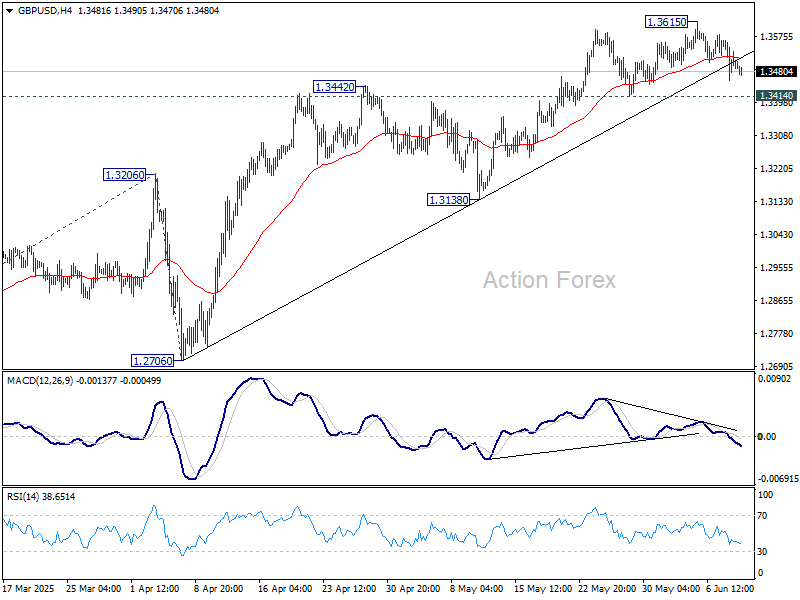
In the bigger picture, up trend from 1.3051 (2022 low) is in progress. Next medium term target is 61.8% projection of 1.0351 to 1.3433 from 1.2099 at 1.4004. Outlook will now stay bullish as long as 55 W EMA (now at 1.2913) holds, even in case of deep pullback.
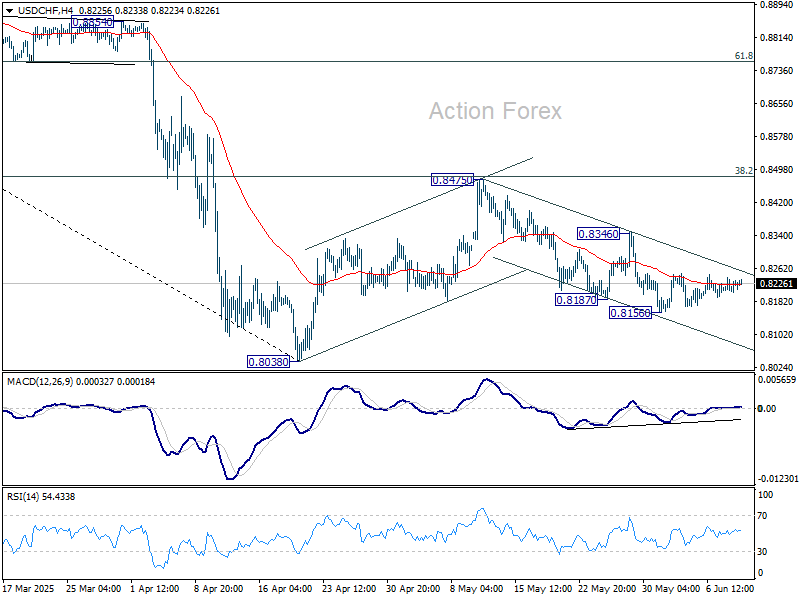
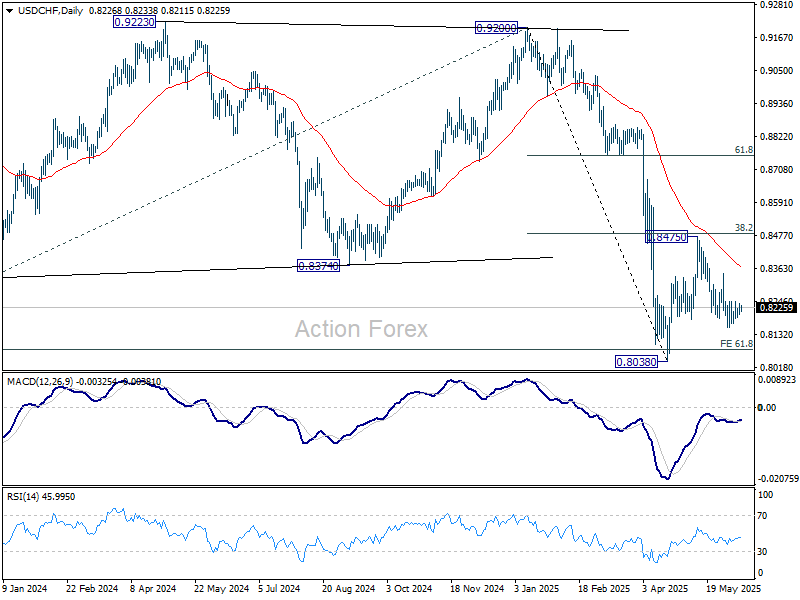
USD/CHF Mid-Day Outlook
Daily Pivots: (S1) 0.8197; (P) 0.8213; (R1) 0.8234; More….
Intraday bias in USD/CHF remains neutral and outlook is unchanged. Price actions from 0.8038 are seen as a corrective pattern to decline from 0.9200. While fall from 0.8475 might extend lower, downside should be contained by 0.8038 to bring rebound. Break of 0.8436 resistance will suggest that it's already in the third leg of the correction, and target 0.8475.
In the bigger picture, long term down trend from 1.0342 (2017 high) is still in progress and met 61.8% projection of 1.0146 (2022 high) to 0.8332 from 0.9200 at 0.8079 already. In any case, outlook will stay bearish as long as 55 W EMA (now at 0.8696) holds. Sustained break of 0.8079 will target 100% projection at 0.7382.
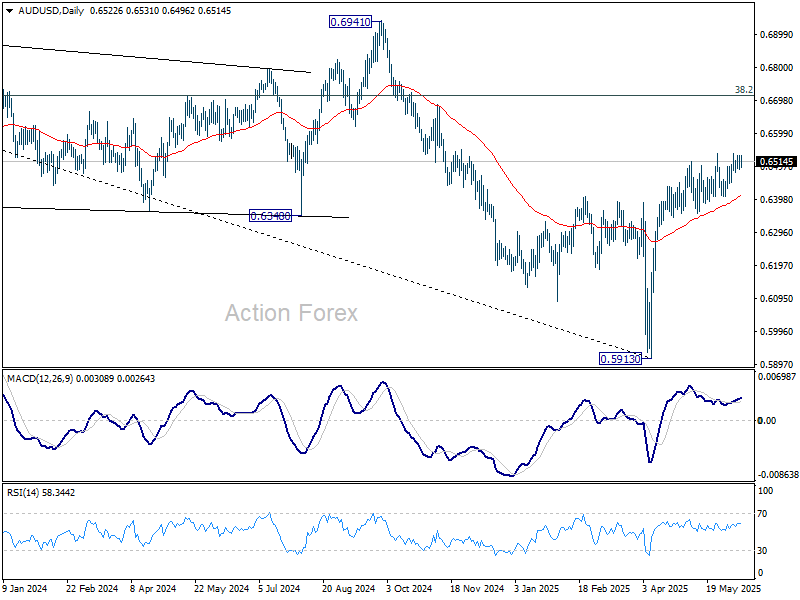
AUD/USD Daily Report
Daily Pivots: (S1) 0.6497; (P) 0.6515; (R1) 0.6540; More...
Intraday bias in AUD/USD remains neutral. More consolidations could be seen below 0.6538, but even in case of another dip, further rise is in favor as long as 0.6406 support holds. On the upside, decisive break of 0.6536 will resume the rally from 0.5913 to 61.8% retracement of 0.6941 to 0.5913 at 0.6548. However, firm break of 0.6406 will turn bias to the downside for 38.2% retracement of 0.5913 to 0.6536 at 0.6298.
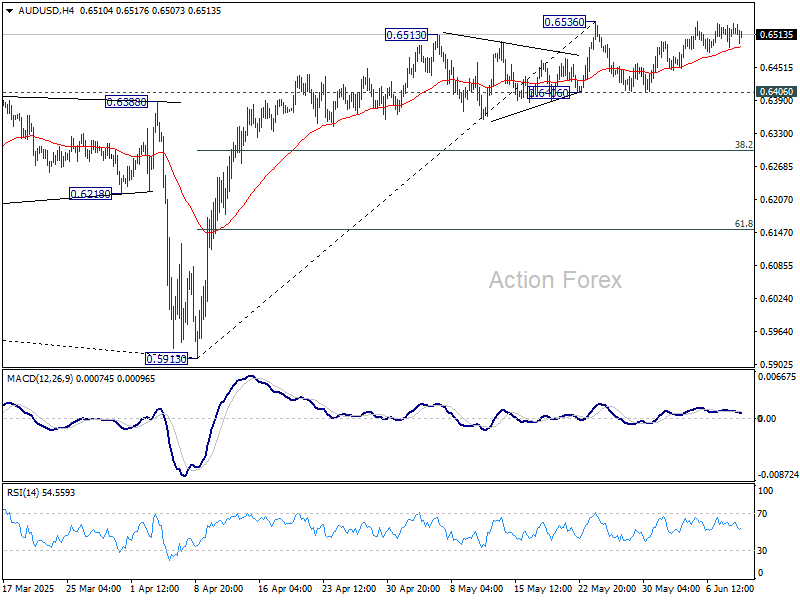
In the bigger picture, AUD/USD is still struggling to sustain above 55 W EMA (now at 0.6443) cleanly, and outlook is mixed. Sustained trading above 55 W EMA will indicate that rise from 0.5913 is at least correcting the down trend from 0.8006 (2021 high), with risk of trend reversal. Further rise should be seen to 38.2% retracement of 0.8006 to 0.5913 at 0.6713. However, rejection by 55 W EMA will revive medium term bearishness for another fall through 0.5913 at a later stage.