Sample Category Title
Sunset Market Commentary
Markets
Trade talks between the US and China entered their second day in London. The presence of US Treasury Secretary Bessent, commerce secretary Lutnick, trade representative Greer and Chinese Vice Premier He Lifeng and commerce minister Wang Wentao underscores the importance of that gathering one week after US President Trump and Chinese President Xi Jinping spoke a first time on the phone. Comments by Bessent “good meeting” and Lutnick “fruitful discussions” aren’t sufficient to lift market sentiment like for example in the wake of Geneva talks which led to the US and China dropping high tariff walls for 90 days. Topic of debate is (amongst others) dropping US export curbs on some tech exports in exchange for assurances on easing limits on Chinese rare earth shipments. An announcement, positive or negative, can be expected within the next couple of hours and might shift markets in a significant manner.
Awaiting the trade talk outcome, the eco calendar offered little inspiration to guide trading. ECB governors speak with one voice in saying that policy and inflation are now in a favorable zone, allowing for a wait-and-see approach. This obviously doesn’t mean that the ECB would sit back and watch when economic developments take a turn for the worse or should upside inflation risks materialize. Dovish ECB member Villeroy today suggested that the ECB managed to successfully normalize monetary policy. The EMU agenda remains light throughout the week while US CPI inflation (tomorrow) and June University of Michigan consumer confidence (Friday) hand the Fed some final input for deciding on policy next week. It’s obvious that for now, the US central bank will continue to err on the side of upside inflation risks rather than already hinting at a stronger focus on downside employment risks. Core bonds are slightly better bid today after the end of last week sell-off in Europe (ECB) and the US (payrolls). Core curves bull flatten with yield changes in Germany and the US ranging between -1 bp at the front end and -4 bps at the very long end. Fortunes for the dollar haven’t improved yet with EUR/USD currently changing hands around 1.1440. Stock markets are currently mixed. Sterling lost ground after this morning’s labour market report showed significant job cuts in May (-109k) with wage growth slower than feared. UK Gilt yields drop 8 to 9 bps across the curve with money markets now fully pricing two more BoE rate cuts this year. EUR/GBP rose from 0.8425 to 0.8470.
News & Views
The Hungarian Debt Agency AKK modified its 2025 financing plan. In line with the Economy Ministry increasing the expected 2025 cash-flow-based-budget deficit to HUF 4,774bn, AKK plans to cover the resulting HUF 651bn increase of funding needs for 2025 with FX bond issuance. The amended plan contemplates FX bond issuance in the amount of EUR 3bn which exceeds the additional financing need which will facilitate the accumulation of intra-year liquid reserves and enhance the flexibility of debt management. Timing, currency, and maturity of any issuance will be determined by ÁKK based on market conditions. FX bond issuance will also allow ÁKK to reduce slightly the net issuance target for the institutional HUF market by HUF 344bn. As a result of the new financing plan, the share of FX debt relative to total debt could reach 30% by the end of the year, but the FX share could fall back below the 30% benchmark limit following the end of the year.
Norwegian headline CPI inflation rose 0.4% M/M and 3% Y/Y (from 2.5% in April). Underlying inflation (CPI-ATE, excluding energy and adjusted for tax changes) eased to 0.2% M/M and 2.8% Y/Y (from 3% April). In its Q1 monetary policy report published end March, the Norges Bank (NB) projected headline and CPI-ATE inflation for May at respectively 2.7% Y/Y and 3.1% Y/Y. In a monthly perspective prices increased for food & drinks (2.8% M/M), clothing & footwear (0.9%) utilities (0.8%), communications (0.5%) and hotels, cafes and restaurants (0.6%). Prices of transportation (-0.9%) and some household goods (-0.8%) declined. The NB holds its policy rate unchanged at 4.5% since December 2023 and indicates that it will mostly likely be reduced in the course of 2025. However, the MPC said to give special attention to the rapid rise in prices for many goods (including food) and services as high business costs likely stoke inflation. The NB meets again on June 19 and has a new monetary policy report with forecasts available. It is most likely too early for the NB to ease policy next week. Markets see a first cut at the September meeting. The krone is holding little changed in the 11.51 area.
Gold (XAU/USD) Holds High Ground as US-China Talks Ramble On
- Gold prices remain high amidst US-China trade talks, indicating market uncertainty
- Technical analysis shows gold breaking a bear flag, suggesting a potential rally to $3400/oz.
- Short-term, a break above 3333.60 on the two-hour chart could further fuel the upward momentum.
Gold prices continue to hold the high ground as a host of commodities benefit from US-China talks which have entered their second day in the UK. Markets appear cautiously optimistic regarding the talks and this appears to have stemmed the flow toward haven assets.
However, the fact that Gold continues to inch higher suggests that there remains concerns in some quarters. A brief US Dollar rally yesterday led to a brief pullback before Gold continued its grind higher.
US-China Trade Talks Crucial for Golds Next Move
The US-China trade talks in Lancaster, UK have entered their second day. US Commerce Secretary Lutnick stated that he expects talks to continue throughout Tuesday and that they are going well.
Any positive developments from the talks could provide headwinds for Gold prices while a stalemate in talks is likely to renew the precious metals appeal.
Technical Analysis - Gold (XAU/USD)
From a technical analysis standpoint, gold has broken the bear flag pattern on the daily timeframe and has now completed a potential retest of the breakout.
A sign of the next rally to the upside?
While such a trading pattern is usually seen as bullish, the macro economic factors at play may be something to consider. If positive news comes from US-China talks, this setup could fail very quickly as the price of gold may fall.
If it does not though. Then a run toward the $3400/oz level and beyond starts to look like a real possibility.
Gold (XAU/USD) Daily Chart, June 10, 2025
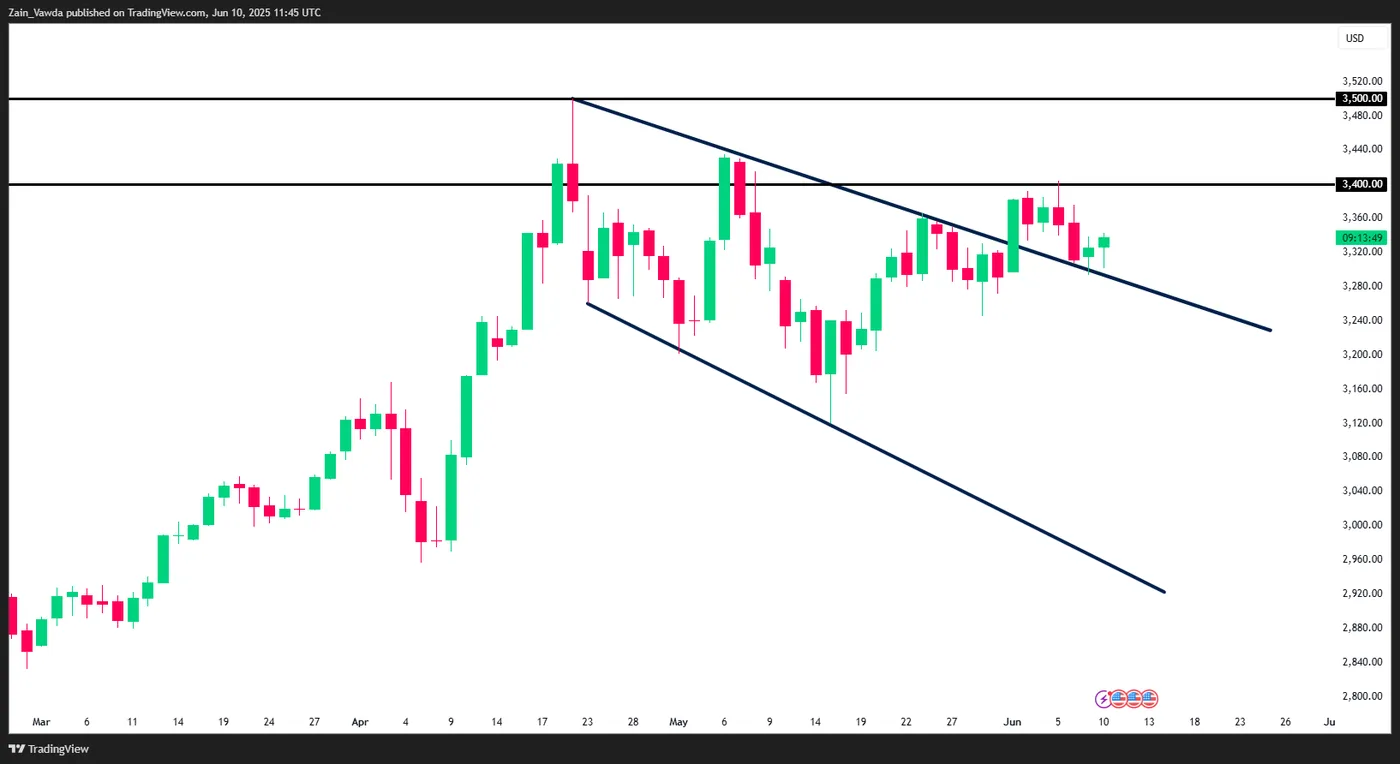
Source: TradingView (click to enlarge)
Dropping down to a two-hour timeframe and you can see that markets are eyeing a change in structure.
A two-hour candle close above the 3333.60 swing high is needed to confirm. If such a move does come to fruition, bulls may be emboldened to push prices higher.
The only concern would be that following a higher high, market participants may conduct some profit taking and a new lower high may form before the bulls push gold prices higher.
Interesting times for gold with volatility expected in the coming days.
Gold (XAU/USD) H2 Chart, June 10, 2025
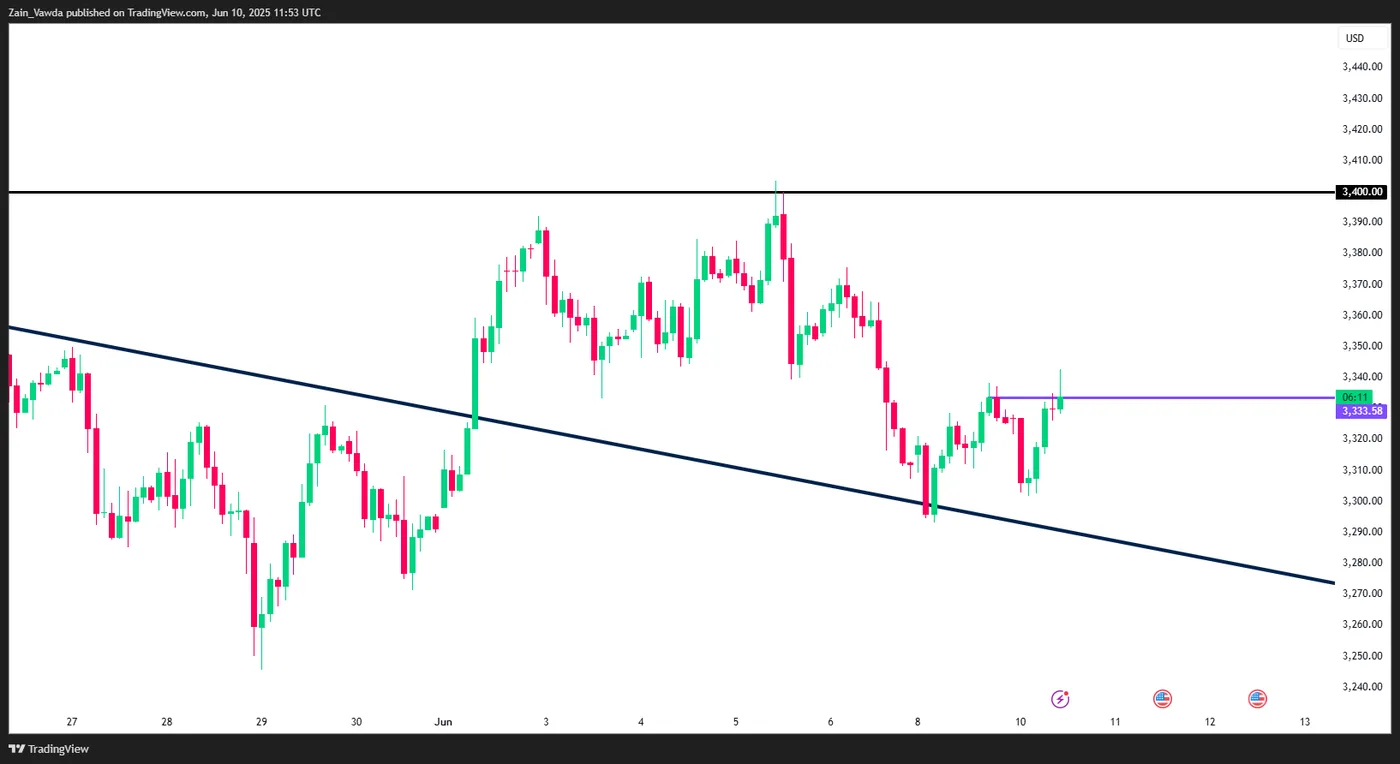
Source: TradingView (click to enlarge)
Support
- 3333.58
- 3300
- 3275
Resistance
- 3350
- 3375
- 3400
Silver Price Forecast: XAG/USD Makes 13-Year Highs, $37 in Sight
Trading at ~$36.72 per troy ounce, silver currently trades at levels last seen in early 2012. Up by over 9% in last week’s trading, global monetary policy expectations, a strong demand outlook, and continued safe-haven demand continue to benefit bullion pricing.
Silver (XAG/USD): Key Takeaways
- Consolidating in today’s session, silver continued to rally in yesterday’s session, achieving 13-year highs of around ~$36.90.
- While most predict rates will remain unchanged in the Federal Reserve’s upcoming decision, monetary easing outside of the United States in the EU and UK is adding to silver upside.
- While safe-haven demand remains a significant contributing factor to precious metal performance, a strong outlook on demand and a weaker dollar continue to boost precious metal pricing.
Silver (XAG/USD): Silver gains on monetary policy expectations
Despite the best efforts of a hawkish Fed, key interest rates are generally trending downward, with the ECB and BoE cutting in their most recent decisions. As a non-yielding asset, lower rates typically favour precious metals like silver, adding rationale to the recent rally.
Undeniably, the burning question remains when the Federal Reserve will join this trend, with fabled interest rate cuts always coming but never seeming to arrive.
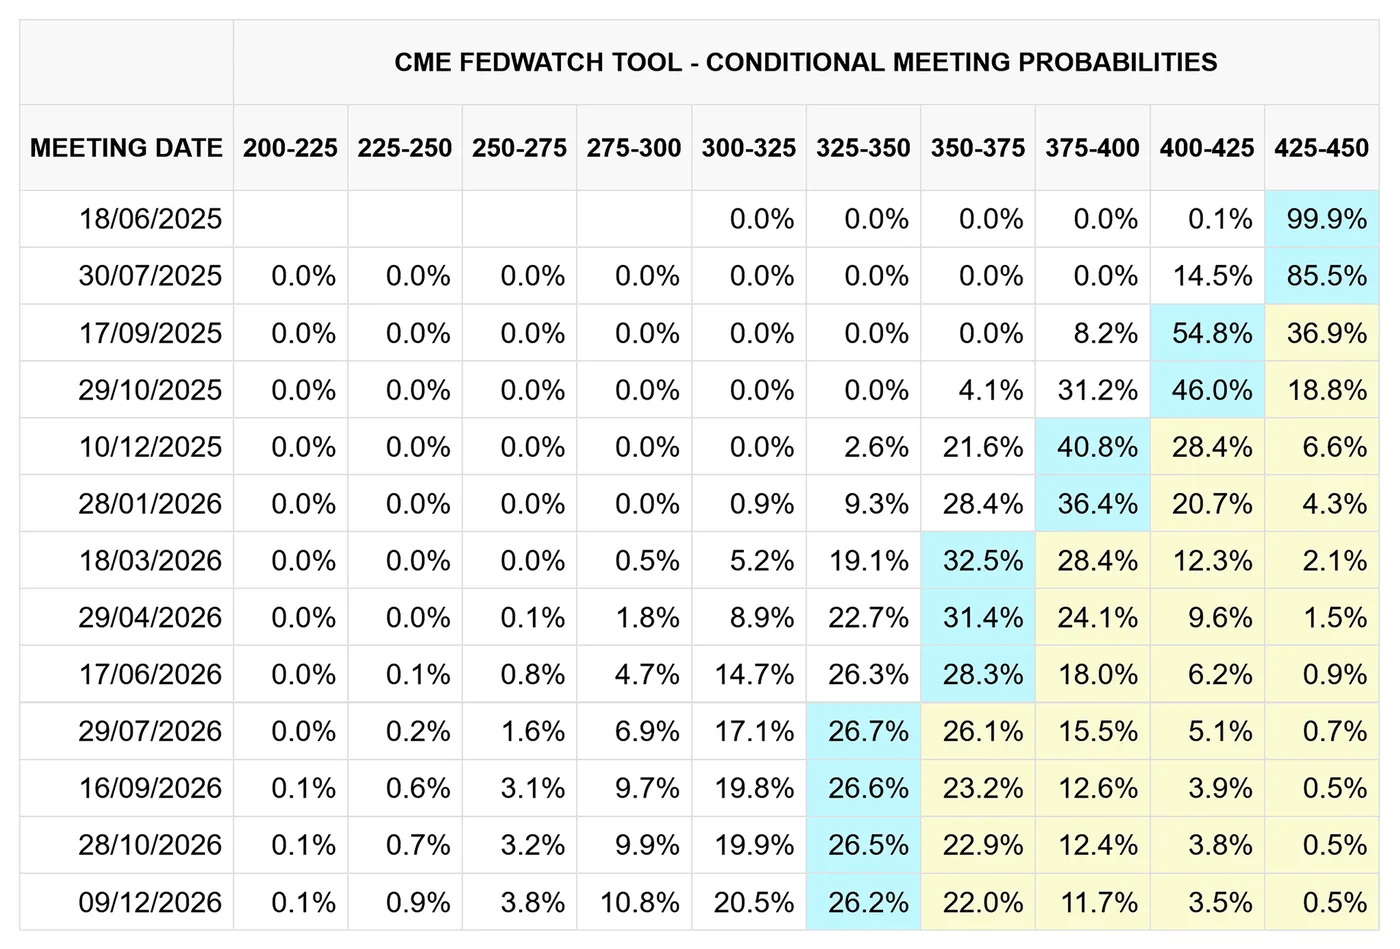
CME FedWatch, CME Group 10/06/2024
Boasting unexpectedly robust jobs data in May, most predict rates will remain unchanged in their upcoming June 18th meeting, which will likely further sour relations between President Trump and Jerome Powell, with Trump recently renewing demands for lower rates, this time by a whole percentage point.
With current US labor market data somewhat vindicating current Fed policy, eyes now turn to upcoming inflation data later this week:
- Wednesday June 11th, US Consumer Price Index (CPI), 08:30 EDT
- Thursday June 12th, US Produce Price Index (PPI), 08:30 EDT
Any suggestion that inflation is continuing to cool, especially in light of recent tariffs, will increase rate cut bets, paving the way for further silver upside.
Silver (XAG/USD): Supply and demand dynamics bolster silver pricing
Fundamental to a gradual increase in precious metal pricing, global supply and demand dynamics underpin recent silver price performance.
With record industrial demand in 2024, and projected to reach new highs this year, demand for silver is expected to outweigh supply for the fifth consecutive year in 2025.
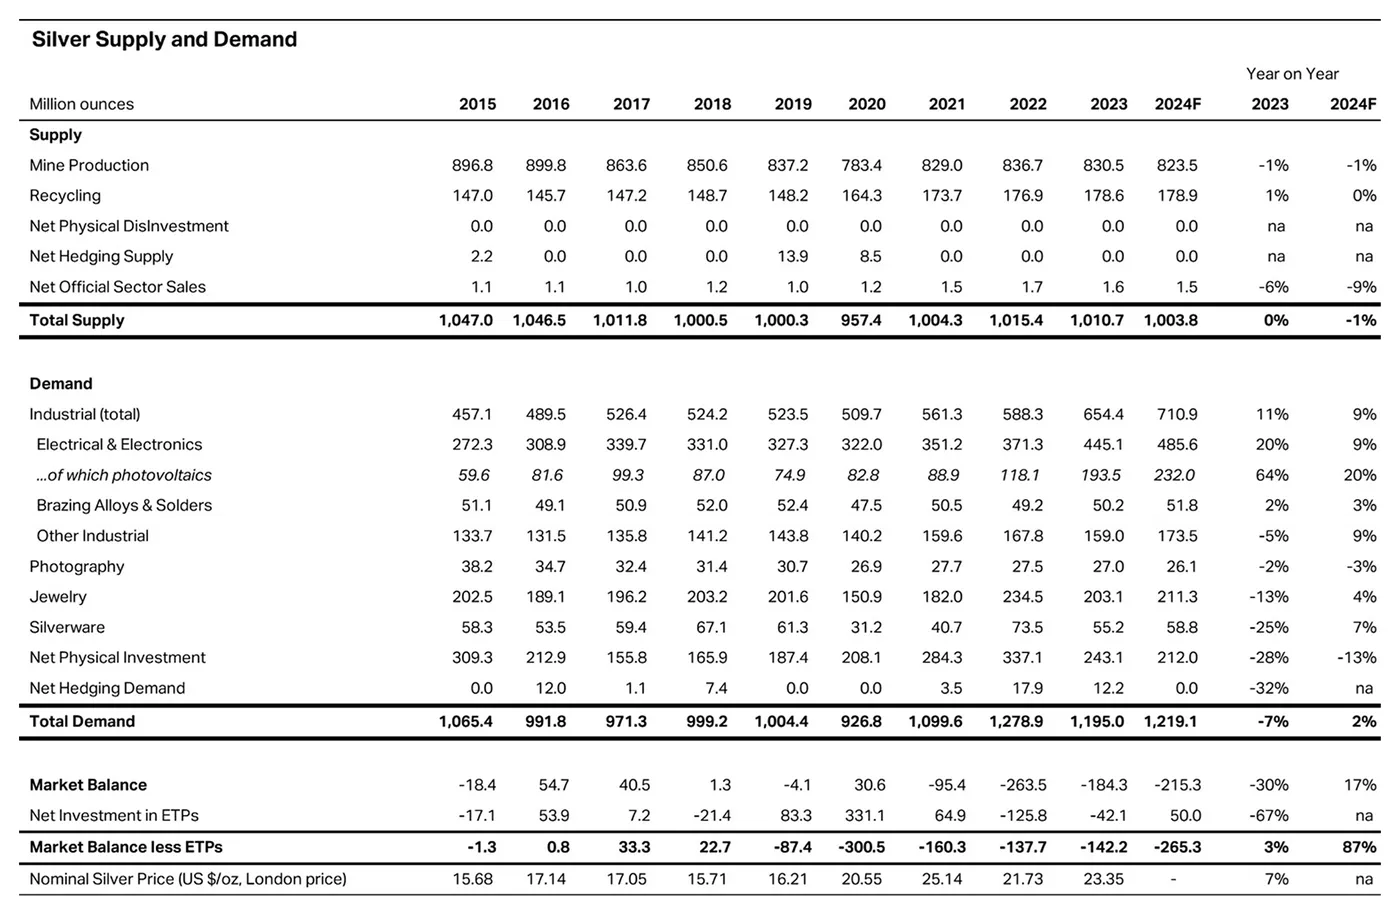
Silver supply & demand, The Silver Institute, 10/06/2025
This dynamic inherently bolsters pricing, especially when considering silver as a hedge against inflation.
Silver (XAGUSD) Technical analysis:
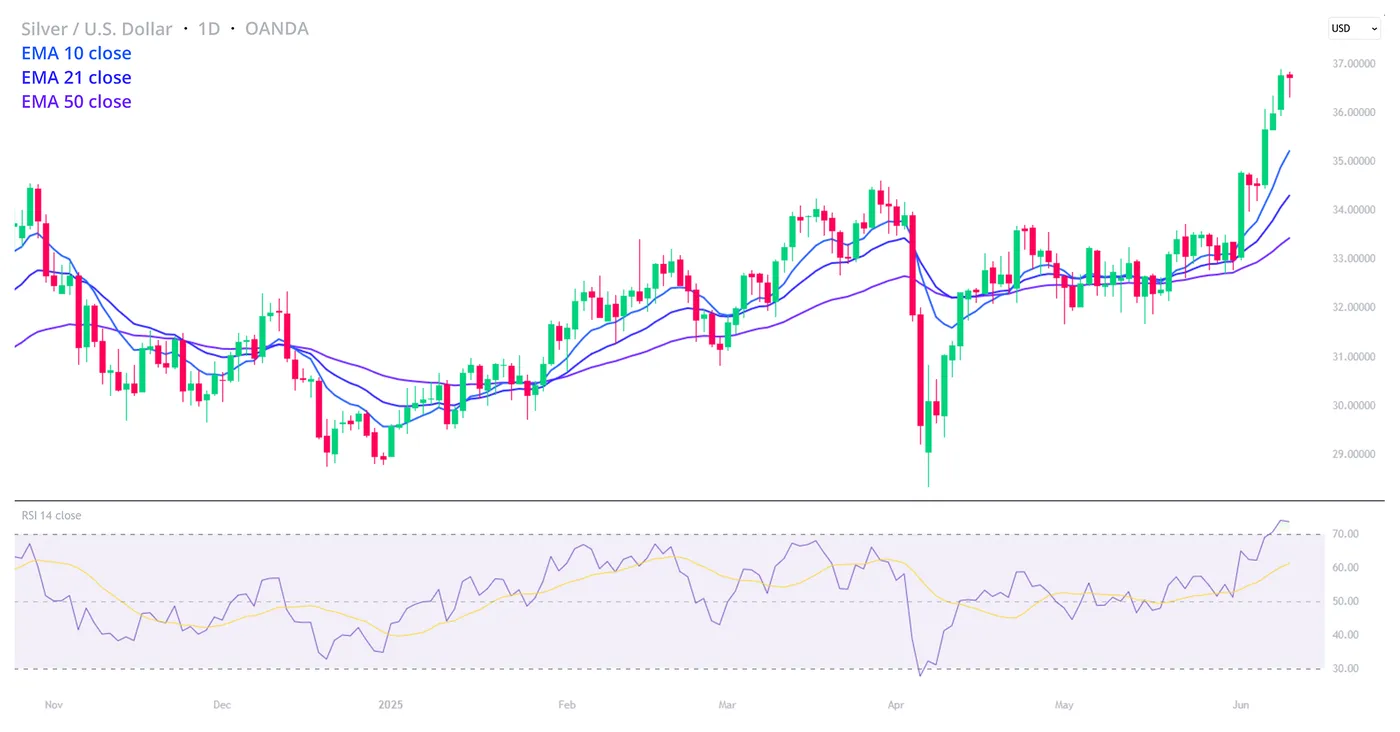
A chart showing the recent price action of XAGUSD. OANDA,TradingView, 10/06/2025
- For the first time since October 2024, the 14-day RSI rates current silver price action as ‘overbought’, suggesting a short-term retracement is likely before further upside can be achieved.
- All major moving averages, including the 10, 21, and 50-day, currently show a bullish directional bias, suggesting price is trending upwards in both the short and long term.
- If price can stabilise and stage a move higher, bulls will first look to break $37, with some resistance expected around ~$37.10.
WTI: Oil Hits New Multi-Week High on Growing Optimism About US-China Trade Talks
Growing optimism about a trade deal between the US and China that would ease tensions, boost economic growth and consequently boost demand, continues to lift oil prices.
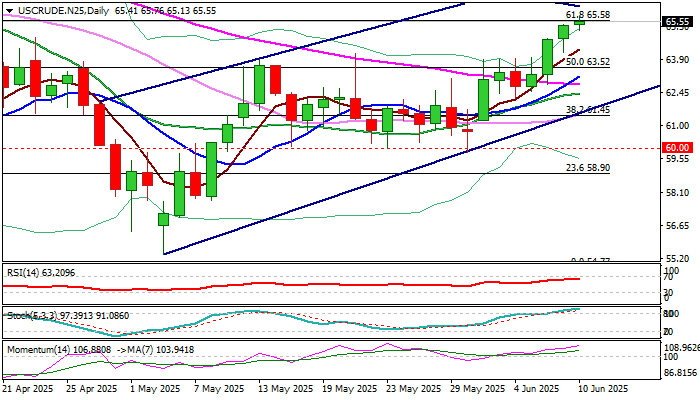
WTI contract rose to the highest in over two months on Tuesday, extending the latest bull-leg into fourth straight day.
Fresh advance cracked important Fibo barrier at $65.58 (61.8% retracement of $72.27/$54.77 fall), after generating bullish signals on break above daily cloud and former recovery top of Apr 23 ($64.85).
Bulls hold grip and eye next target at $66.20 (100DMA), but strongly overbought stochastic (although still not showing signs of fatigue) generates initial warning that bulls may soon run out of steam.
Consolidation or shallow dips should be likely scenario in current situation when positive comments about the outcome of trade talks boost expectations for a good deal between two largest world economies and top oil consumers.
Extended dips should stay above daily cloud top ($64.12) to keep bulls intact for further advance.
Res: 65.76; 66.20; 66.88; 67.66.
Sup: 65.13; 64.85; 64.12; 63.52.
US: Small Business Optimism Index Increases in May, Marking First Improvement of 2025
The NFIB's Small Business Optimism Index increased by 3 points to 98.8 in May, coming in slightly above its long-term average of 98. The May increase marked the first improvement of the year. The uncertainty subindex rose 2 points to 94.
Seven out of ten subcomponents improved on the month, two deteriorated and one remained unchanged. Large increases were reported in expectations about an improvement in the economy (up 10 points to 25%) and higher real sales (up 11 points to 20%). Notable improvements were also recorded in current inventory (up 7 points to 1%), plans to increase inventories (up 3 points to -1%) and plans to make capital outlays (up 4 points to 22%).
Labor market indicators were mixed. The net share of businesses planning to increase employment fell 1 point to 12%, while the share of firms with unfilled job openings remained unchanged at 34%. Quality of labor concerns fell 3 points to 16%. Instead, the top business problem were taxes (up 2 points to 18%).
The net share of firms increasing employee compensation fell a sharp 7 points to 26% – the lowest level since early 2021. Meanwhile, the net share 'planning' to raise wages in the months ahead rose 3 points 20%. The share of businesses raising average selling prices held steady at 25%, while the share of those 'planning' to raise average selling prices ahead rose 3 points to 31%.
Key Implications
Small business confidence improved moderately in May, rising a hair above its long-term average. While uncertainty remained elevated, as indicated by the corresponding subindex, a mid-May de-escalation in the U.S.-China trade skirmish is likely to have helped reduce concerns among small businesses, contributing to an improved view about the economy, future sales performance, and inventory levels.
Parsing through the details of the report, some easing in the labor market indicators is also visible. For a few years now, inflation and quality of labor concerns have competed head-to-head for the 'top business problem' spot, but as these concerns have subsided, taxes have vaulted into first place. Easing quality of labor concerns, together with subdued small business hiring plans and job openings at a post-pandemic low, are added signs that the labor market is slowly cooling.
GBP/USD Mid-Day Outlook
Daily Pivots: (S1) 1.3514; (P) 1.3547; (R1) 1.3586; More...
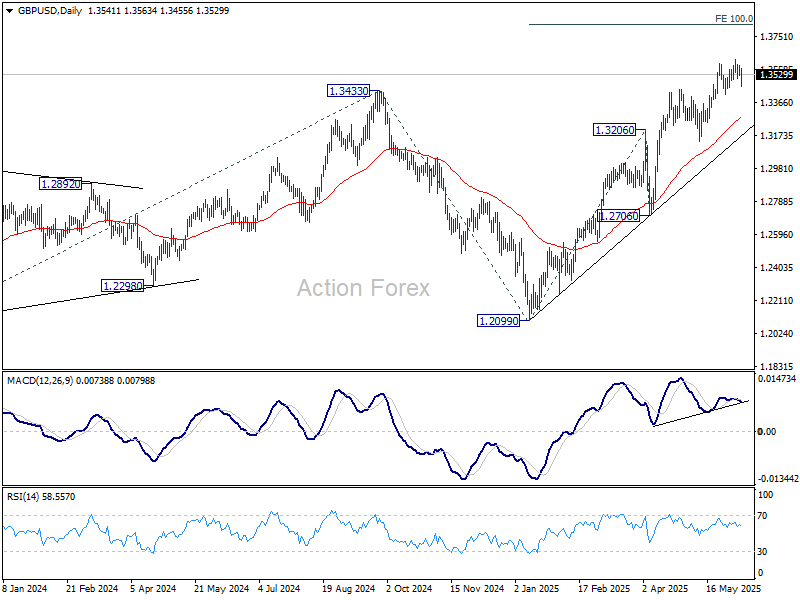
While GBP/USD dips notably today, downside is contained well above 1.3414 support so far. Intraday bias stays neutral and further rally remains in favor. On the upside, break of 1.3615 will resume the rally from 1.2099 and target 100% projection of 1.2099 to 1.3206 from 1.3138 at 1.3813. Considering bearish divergence condition in 4H MACD, break of 1.3414 support should confirm short term topping, and bring deeper correction to 1.3138 support instead.
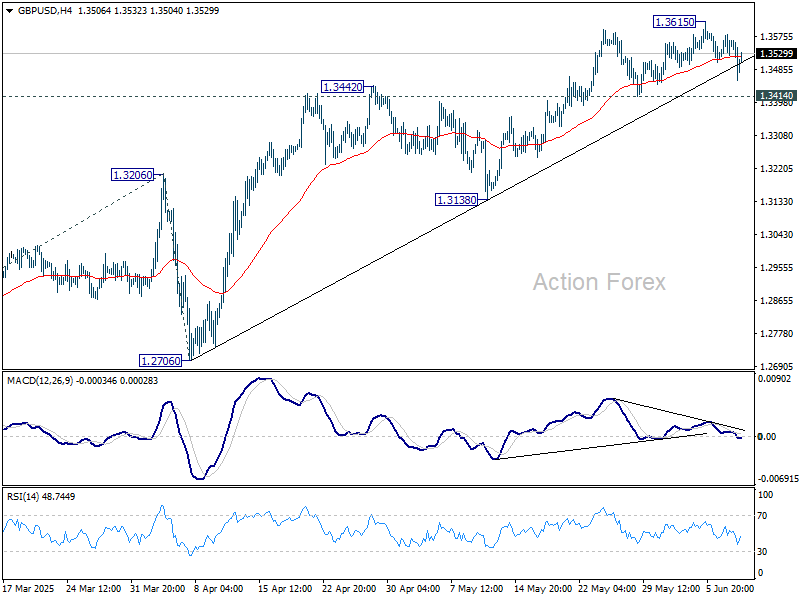
In the bigger picture, up trend from 1.3051 (2022 low) is in progress. Next medium term target is 61.8% projection of 1.0351 to 1.3433 from 1.2099 at 1.4004. Outlook will now stay bullish as long as 55 W EMA (now at 1.2913) holds, even in case of deep pullback.
EUR/USD Mid-Day Outlook
Daily Pivots: (S1) 1.1392; (P) 1.1415; (R1) 1.1444; More...
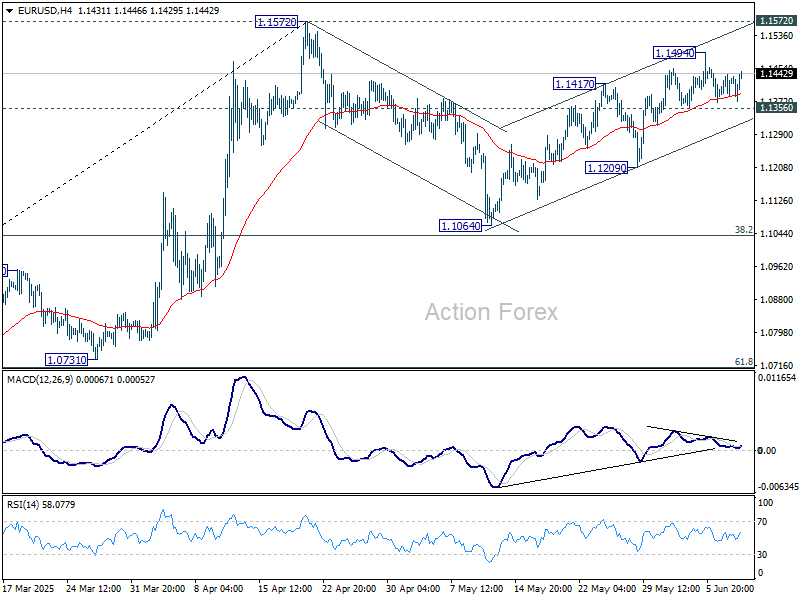
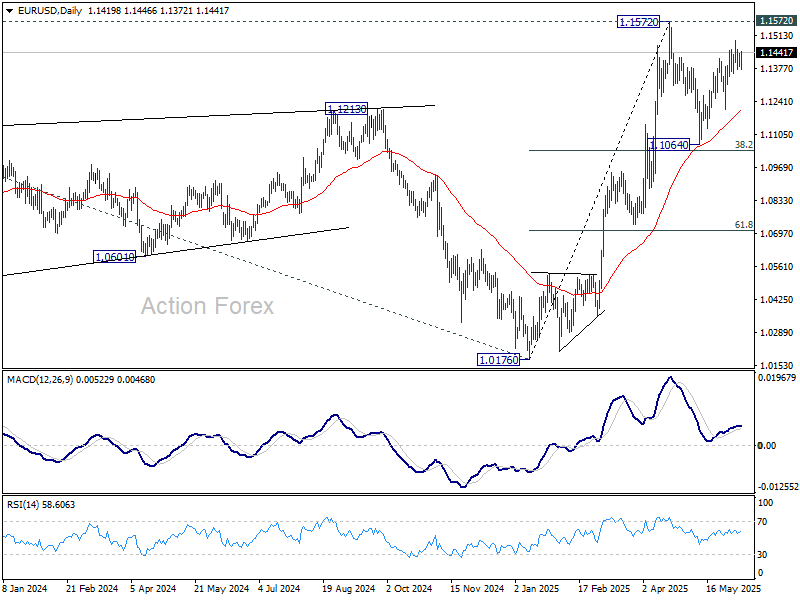
Intraday bias in EUR/USD remains neutral for the moment. Price actions from 1.1572 are seen as a corrective pattern to rally from 1.0716. While rebound from 1.1064 might extend, strong resistance should emerge from 1.1572 to limit upside. On the downside, break of 1.1356 support will argue that the correction is already in the third leg, and target 1.1209 support for confirmation.
In the bigger picture, rise from 0.9534 long term bottom could be correcting the multi-decade downtrend or the start of a long term up trend. In either case, further rise should be seen to 100% projection of 0.9534 to 1.1274 from 1.0176 at 1.1916. This will now remain the favored case as long as 55 W EMA (now at 1.0894) holds.
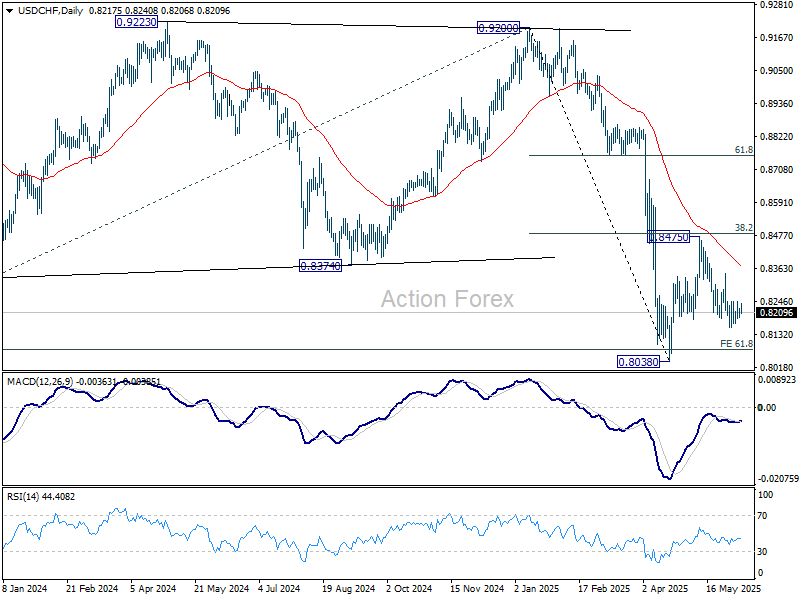
USD/CHF Mid-Day Outlook
Daily Pivots: (S1) 0.8197; (P) 0.8213; (R1) 0.8234; More….
Intraday bias in USD/CHF remains neutral at this point. Price actions from 0.8038 are seen as a corrective pattern to decline from 0.9200. While fall from 0.8475 might extend lower, downside should be contained by 0.8038 to bring rebound. Break of 0.8436 resistance will suggest that it's already in the third leg of the correction, and target 0.8475.
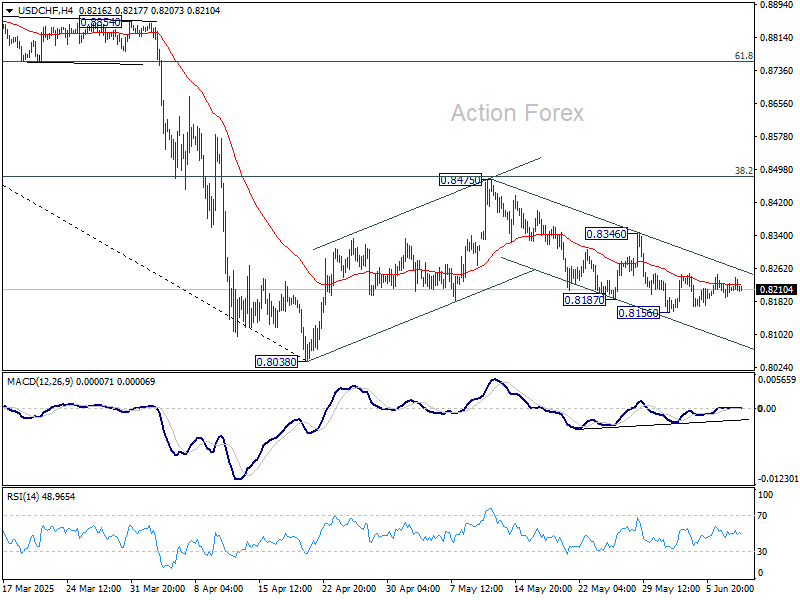
In the bigger picture, long term down trend from 1.0342 (2017 high) is still in progress and met 61.8% projection of 1.0146 (2022 high) to 0.8332 from 0.9200 at 0.8079 already. In any case, outlook will stay bearish as long as 55 W EMA (now at 0.8696) holds. Sustained break of 0.8079 will target 100% projection at 0.7382.
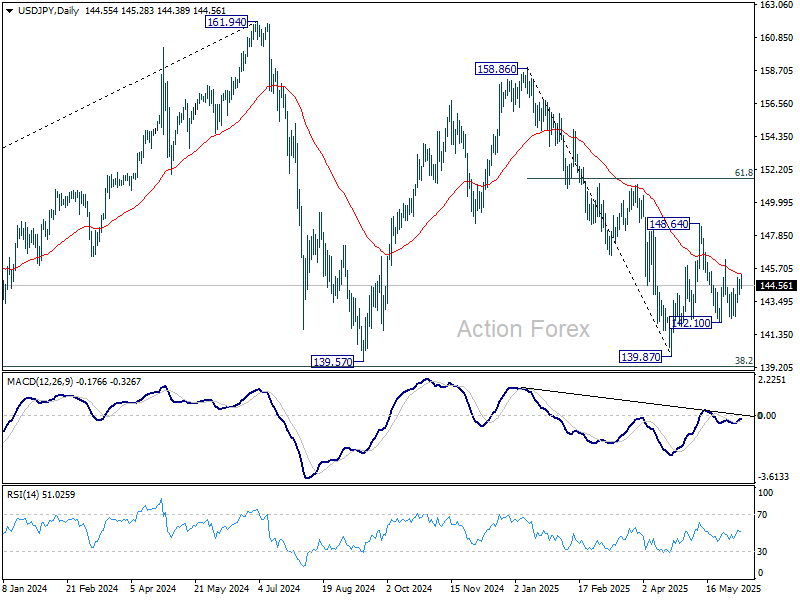
USD/JPY Mid-Day Outlook
Daily Pivots: (S1) 144.06; (P) 144.51; (R1) 145.04; More...
Intraday bias in USD/JPY stays neutral and outlook is unchanged. On the upside, above 146.27 resistance will argue that price actions from 148.64 has completed as a corrective pattern. Intraday bias will be back on the upside for 148.64 resistance and above to resume the rebound from 139.87 low. However, firm break of 142.10 will bring retest of 139.87 instead.
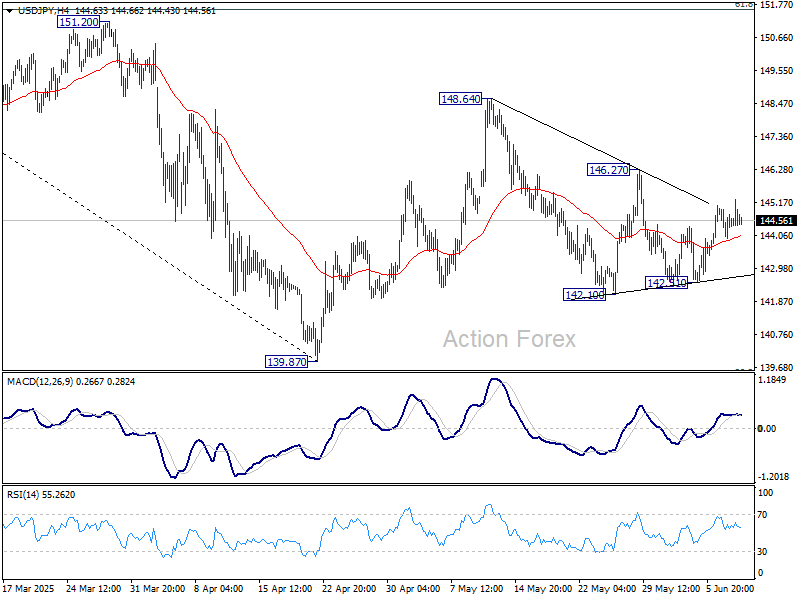
In the bigger picture, price actions from 161.94 are seen as a corrective pattern to rise from 102.58 (2021 low), with fall from 158.86 as the third leg. Strong support should be seen from 38.2% retracement of 102.58 to 161.94 at 139.26 to bring rebound. However, sustained break of 139.26 would open up deeper medium term decline to 61.8% retracement at 125.25.