Sample Category Title
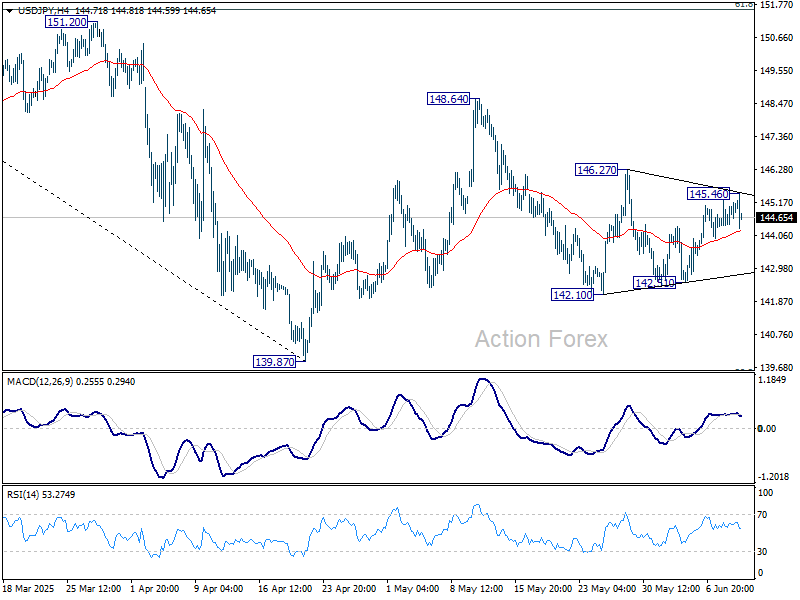
USD/JPY Mid-Day Outlook
Daily Pivots: (S1) 144.44; (P) 144.86; (R1) 145.33; More...
USD/JPY dips mildly today but stays in established range. Intraday bias stays neutral. On the upside, above 146.27 resistance will argue that price actions from 148.64 has completed as a corrective pattern. Intraday bias will be back on the upside for 148.64 resistance and above to resume the rebound from 139.87 low. However, firm break of 142.10 will bring retest of 139.87 instead.
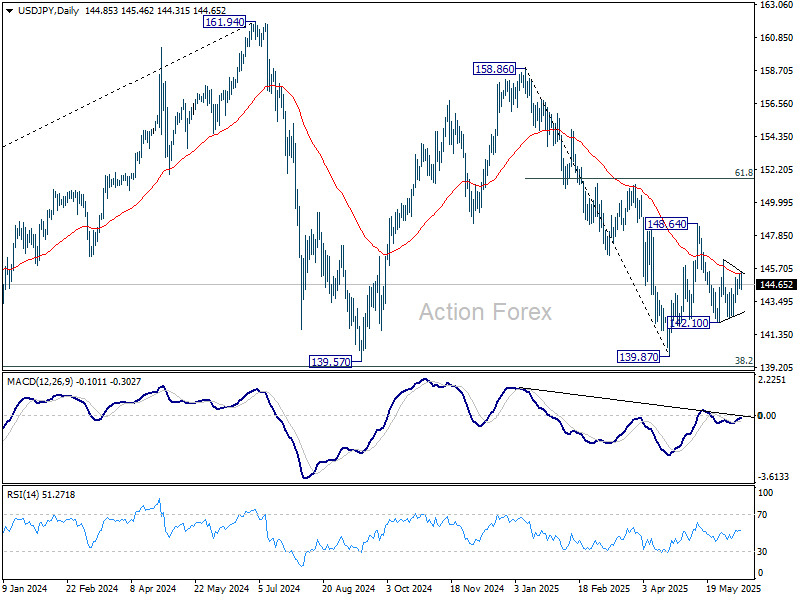
In the bigger picture, price actions from 161.94 are seen as a corrective pattern to rise from 102.58 (2021 low), with fall from 158.86 as the third leg. Strong support should be seen from 38.2% retracement of 102.58 to 161.94 at 139.26 to bring rebound. However, sustained break of 139.26 would open up deeper medium term decline to 61.8% retracement at 125.25.
Dollar Drops on CPI Miss; Trade Optimism Offers Limited Support
Dollar fell broadly following weaker-than-expected US inflation report for May, reinforcing the narrative that consumer prices have not yet felt the full brunt of tariff pressures. The data offered some relief that the feared pass-through from tariffs to end consumers hasn’t materialized, at least not yet.
However, it wasn’t enough to shift expectations for the June and July Fed meetings, where markets still overwhelmingly anticipate the central bank to hold steady. What did shift slightly was the probability of a September rate cut. According to fed funds futures, the odds of a cut in Q3 have now climbed above 55%. Nonetheless, the Fed is unlikely to act preemptively without more confirmation.
On trade, President Trump declared this week’s talks with China a success, albeit with no rollback of existing tariffs. While the 55% tariff rate remains in place, Trump noted that China has committed to supplying key items such as magnets and rare earths “up front,” with the US reciprocating on non-economic terms like student access.
In the broader FX market, Dollar is now the weakest performer for the week, followed by Sterling and Yen. The Pound remains weighed down by soft UK labor market data. On the other hand, Euro is gaining the upper hand, while commodity Aussie and Kiwi are benefiting from improved risk sentiment. Swiss Franc and Loonie sit in the middle.
In Europe, at the time of writing, FTSE is up 0.22%. DAX is up 0.41%. CAC is up 0.10%. UK 10-year yield is up 0.008 at 4.552. Germany 10-year yield is down -0.006 at 2.521. Earlier in Asia, Nikkei rose 0.55%. Hong Kong HSI rose 0.84%. China Shanghai SSE rose 0.52%. Singapore Strait Times fell -0.37%. Japan 10-year JGB yield fell -0.019 to 1.461.
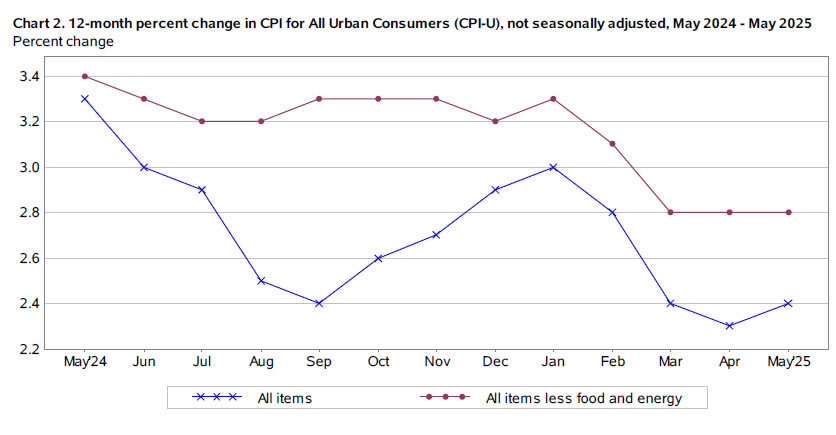
US CPI ticks up to 2.4%, core unchanged at 2.8%, undershoot expectations
US consumer inflation data for May came in softer than expected, offering some relief to markets concerned about price pressures from tariffs and broader cost pass-throughs.
Headline CPI rose just 0.1% mom, below consensus of 0.2% mom. Core CPI, which excludes food and energy, also surprised to the downside with a 0.1% mom rise against an expected 0.3% mom. The gains in overall prices were primarily driven by shelter (0.3% mom) and food (0.3% mom), while energy posted a -1.0% monthly drop.
On an annual basis, headline CPI rose slightly from 2.3% yoy to 2.4% yoy, still undershooting the forecasted 2.5% yoy. Core CPI held steady at 2.8% yoy, also missing expectations of 2.9% yoy.
ECB’s Lane: Last week's rate cut aimed at anchoring expectations, avoiding prolonged undershoot
ECB Chief Economist Philip Lane emphasized that last week’s rate cut was a strategic step to ensure inflation remains on track toward the 2% target over the medium term. He argued that, without this move, the "projected negative inflation deviation" over the next 18 months could have risked becoming entrenched.
In a speech today, Lane also stressed the importance of clarity in ECB’s reaction function. By cutting the deposit facility rate to 2.00%, the central bank signaled that "we are determined to make sure that inflation returns to target in the medium term". This helps "underpin inflation expectations and avoid an unwarranted tightening in financial conditions."
On the other hand, holding the rate at 2.25% could have sent the wrong signal, Lane warned, potentially triggering a market repricing that would reinforce a "more pronounced and longer-lasting undershoot of the inflation target."
ECB’s Kazaks: Further fine-tuning cuts likely
Latvian ECB Governing Council member Martins Kazaks signaled openness to further interest rate cuts, suggesting that while ECB has already delivered significant easing, "fine-tuning" adjustments could be needed depending on how the economy evolves.
He noted that current market pricing for one more cut is “not out of the realm of the baseline,” but stressed that any additional moves must be carefully calibrated to keep inflation anchored near the 2% target.
Kazaks warned against complacency, highlighting risks of a persistent inflation undershoot. While not yet leaning toward accommodative territory, he emphasized the importance of vigilance, particularly amid the uncertain impact of global trade tensions. So far, deflationary effects seem to dominate, but the final outcome remains highly uncertain and must be watched closely.
Japan’s CGPI cools to 3.2% in May, but food inflation continue to rise
Japan’s corporate goods price index slowed more than expected in May, easing from 4.1% to 3.2% yoy, versus the anticipated 3.5% yoy. The decline reflects the broader disinflationary trend in upstream prices, aided by the recent rebound in Yen. Yen-based import price index plunged -10.3% yoy, a sharper drop than April’s -7.3% yoy.
Falling raw material costs were evident across sectors, with steel prices down -4.8% yoy, chemicals -3.1% yoy, and non-ferrous metals -2.1% yoy
However, consumer-related categories showed more persistence in inflation. Prices of food and beverages accelerated to 4.2% yoy from April’s 4.0% yoy, suggesting that inflationary stickiness in essential goods remains a challenge despite broader producer-side cooling.
AUD/USD Mid-Day Report
Daily Pivots: (S1) 0.6497; (P) 0.6515; (R1) 0.6540; More...
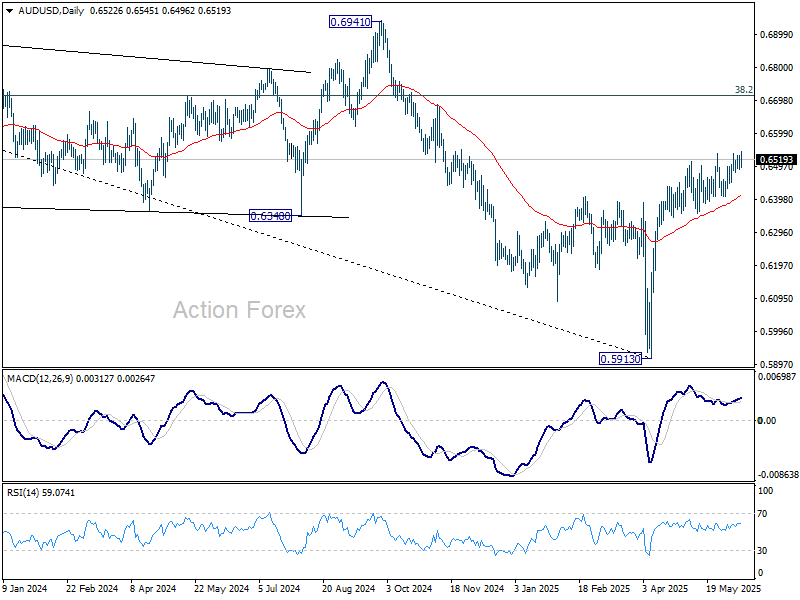
Intraday bias in AUD/USD is mildly on the upside with breach of 0.6536 resistance. Rise from 0.5913 could be resuming for 61.8% retracement of 0.6941 to 0.5913 at 0.6548. However, considering bearish divergence condition in 4H MACD, break of 0.6478 support will turn bias back to the downside for 55 D EMA (now at 0.6410) and possibly below.
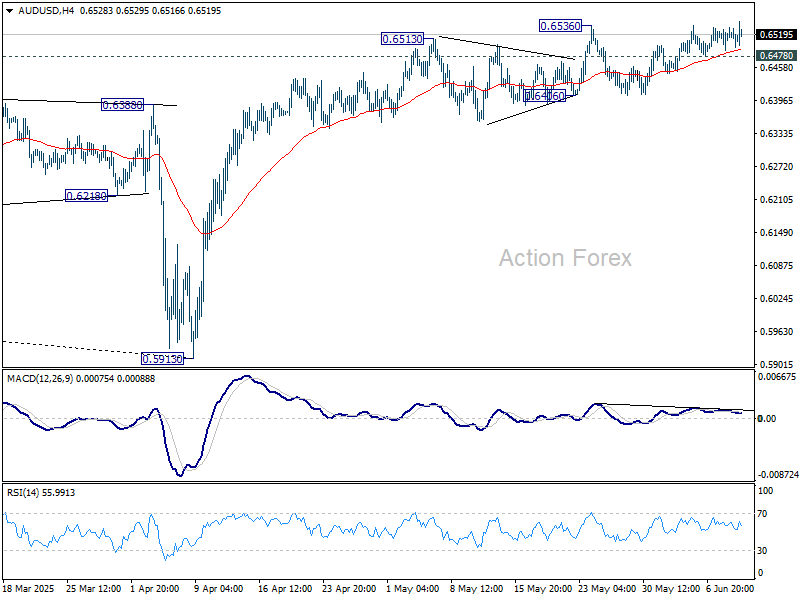
In the bigger picture, AUD/USD is still struggling to sustain above 55 W EMA (now at 0.6443) cleanly, and outlook is mixed. Sustained trading above 55 W EMA will indicate that rise from 0.5913 is at least correcting the down trend from 0.8006 (2021 high), with risk of trend reversal. Further rise should be seen to 38.2% retracement of 0.8006 to 0.5913 at 0.6713. However, rejection by 55 W EMA will revive medium term bearishness for another fall through 0.5913 at a later stage.
AUD/USD Mid-Day Report
Daily Pivots: (S1) 0.6497; (P) 0.6515; (R1) 0.6540; More...
Intraday bias in AUD/USD is mildly on the upside with breach of 0.6536 resistance. Rise from 0.5913 could be resuming for 61.8% retracement of 0.6941 to 0.5913 at 0.6548. However, considering bearish divergence condition in 4H MACD, break of 0.6478 support will turn bias back to the downside for 55 D EMA (now at 0.6410) and possibly below.

In the bigger picture, AUD/USD is still struggling to sustain above 55 W EMA (now at 0.6443) cleanly, and outlook is mixed. Sustained trading above 55 W EMA will indicate that rise from 0.5913 is at least correcting the down trend from 0.8006 (2021 high), with risk of trend reversal. Further rise should be seen to 38.2% retracement of 0.8006 to 0.5913 at 0.6713. However, rejection by 55 W EMA will revive medium term bearishness for another fall through 0.5913 at a later stage.

US CPI ticks up to 2.4%, core unchanged at 2.8%, undershoot expectations
US consumer inflation data for May came in softer than expected, offering some relief to markets concerned about price pressures from tariffs and broader cost pass-throughs.
Headline CPI rose just 0.1% mom, below consensus of 0.2% mom. Core CPI, which excludes food and energy, also surprised to the downside with a 0.1% mom rise against an expected 0.3% mom. The gains in overall prices were primarily driven by shelter (0.3% mom) and food (0.3% mom), while energy posted a -1.0% monthly drop.
On an annual basis, headline CPI rose slightly from 2.3% yoy to 2.4% yoy, still undershooting the forecasted 2.5% yoy. Core CPI held steady at 2.8% yoy, also missing expectations of 2.9% yoy.
ECB’s Lane: Last week’s rate cut aimed at anchoring expectations, avoiding prolonged undershoot
ECB Chief Economist Philip Lane emphasized that last week’s rate cut was a strategic step to ensure inflation remains on track toward the 2% target over the medium term. He argued that, without this move, the "projected negative inflation deviation" over the next 18 months could have risked becoming entrenched.
In a speech today, Lane also stressed the importance of clarity in ECB’s reaction function. By cutting the deposit facility rate to 2.00%, the central bank signaled that "we are determined to make sure that inflation returns to target in the medium term". This helps "underpin inflation expectations and avoid an unwarranted tightening in financial conditions."
On the other hand, holding the rate at 2.25% could have sent the wrong signal, Lane warned, potentially triggering a market repricing that would reinforce a "more pronounced and longer-lasting undershoot of the inflation target."
ECB’s Kazaks: Further fine-tuning cuts likely
Latvian ECB Governing Council member Martins Kazaks signaled openness to further interest rate cuts, suggesting that while ECB has already delivered significant easing, "fine-tuning" adjustments could be needed depending on how the economy evolves.
He noted that current market pricing for one more cut is “not out of the realm of the baseline,” but stressed that any additional moves must be carefully calibrated to keep inflation anchored near the 2% target.
Kazaks warned against complacency, highlighting risks of a persistent inflation undershoot. While not yet leaning toward accommodative territory, he emphasized the importance of vigilance, particularly amid the uncertain impact of global trade tensions. So far, deflationary effects seem to dominate, but the final outcome remains highly uncertain and must be watched closely.
USD/JPY Continues to Climb: Yen Loses its Safe-Haven Appeal
The USD/JPY pair remains in an uptrend, trading around 145.00 on Wednesday and nearing a two-week low for the yen. The Japanese currency is under continued pressure as demand for safe-haven assets fades, fuelled by growing optimism over US-China trade negotiations.
Trade optimism undermines yen demand
Positive signals from the US-China trade talks have eased market tensions. After two days of meetings, both delegations described the dialogue as productive, with discussions expected to continue today. Reports suggest that diplomats have reached a preliminary agreement on implementing the Geneva Consensus. Under the agreement, China could ease export restrictions on rare earth metals, while the US might loosen controls on advanced technology sales to China.
This improving external backdrop has diminished the appeal of the yen as a safe-haven asset, contributing to the continued strength of the dollar against it.
Domestically, Japan’s producer price inflation rose 3.2% y/y in May, marking the slowest growth in eight months. This suggests easing cost pressures in production, which could reduce the urgency for aggressive monetary tightening.
Still, Bank of Japan Governor Kazuo Ueda reaffirmed in parliament on Tuesday that the central bank remains prepared to implement a new rate hike, provided there is confidence in the sustainability of core inflation around the 2% target.
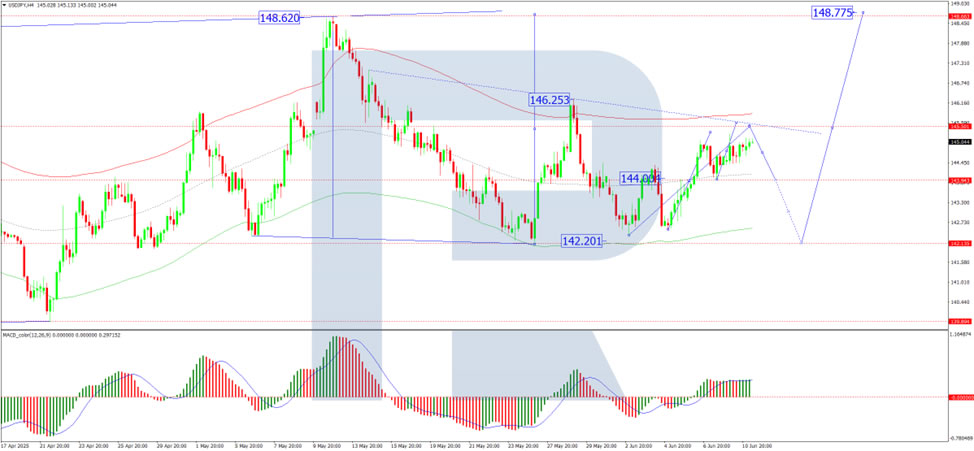
Technical analysis of USD/JPY
On the H4 chart, USD/JPY is moving upwards from support at 144.00, targeting 145.50, which is expected to be reached today. After hitting this level, a pullback to 144.00 is anticipated. Should the pair break below 144.00, the next move may extend to 142.20, with the possibility of continuing further to 140.50. A breakout above 145.50 would open the door to 146.25. The MACD indicator supports the bullish view, with its signal line above zero and pointing sharply upwards within the histogram zone.
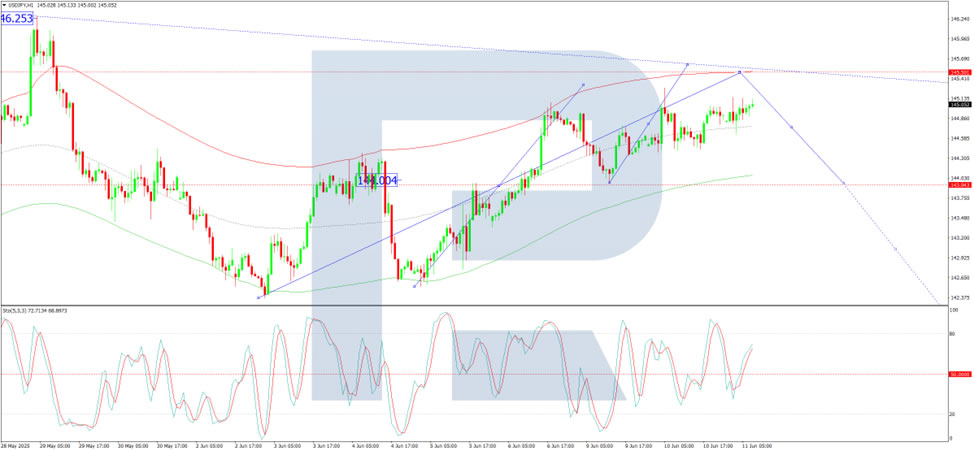
On the H1 chart, the pair is building an upward wave structure towards 145.50, which is likely to be fulfilled today. A corrective move to 144.00 is expected to follow. The pair remains in a broad consolidation range around these levels. The Stochastic oscillator also confirms this scenario, with its signal line above 50 and heading towards 80, indicating continued upward momentum in the short term.
Conclusion
USD/JPY continues to rise as risk appetite grows, and trade-related optimism diminishes the appeal of the yen. While positive domestic data and a willing BoJ support the yen longer term, the near-term technical setup remains bullish. Key resistance lies at 145.50 and 146.25, while a potential pullback could find support at 144.00, with deeper levels at 142.20 and 140.50 if the trend reverses.
Ethereum Dynamics Point to an Altseason Approaching
Market Picture
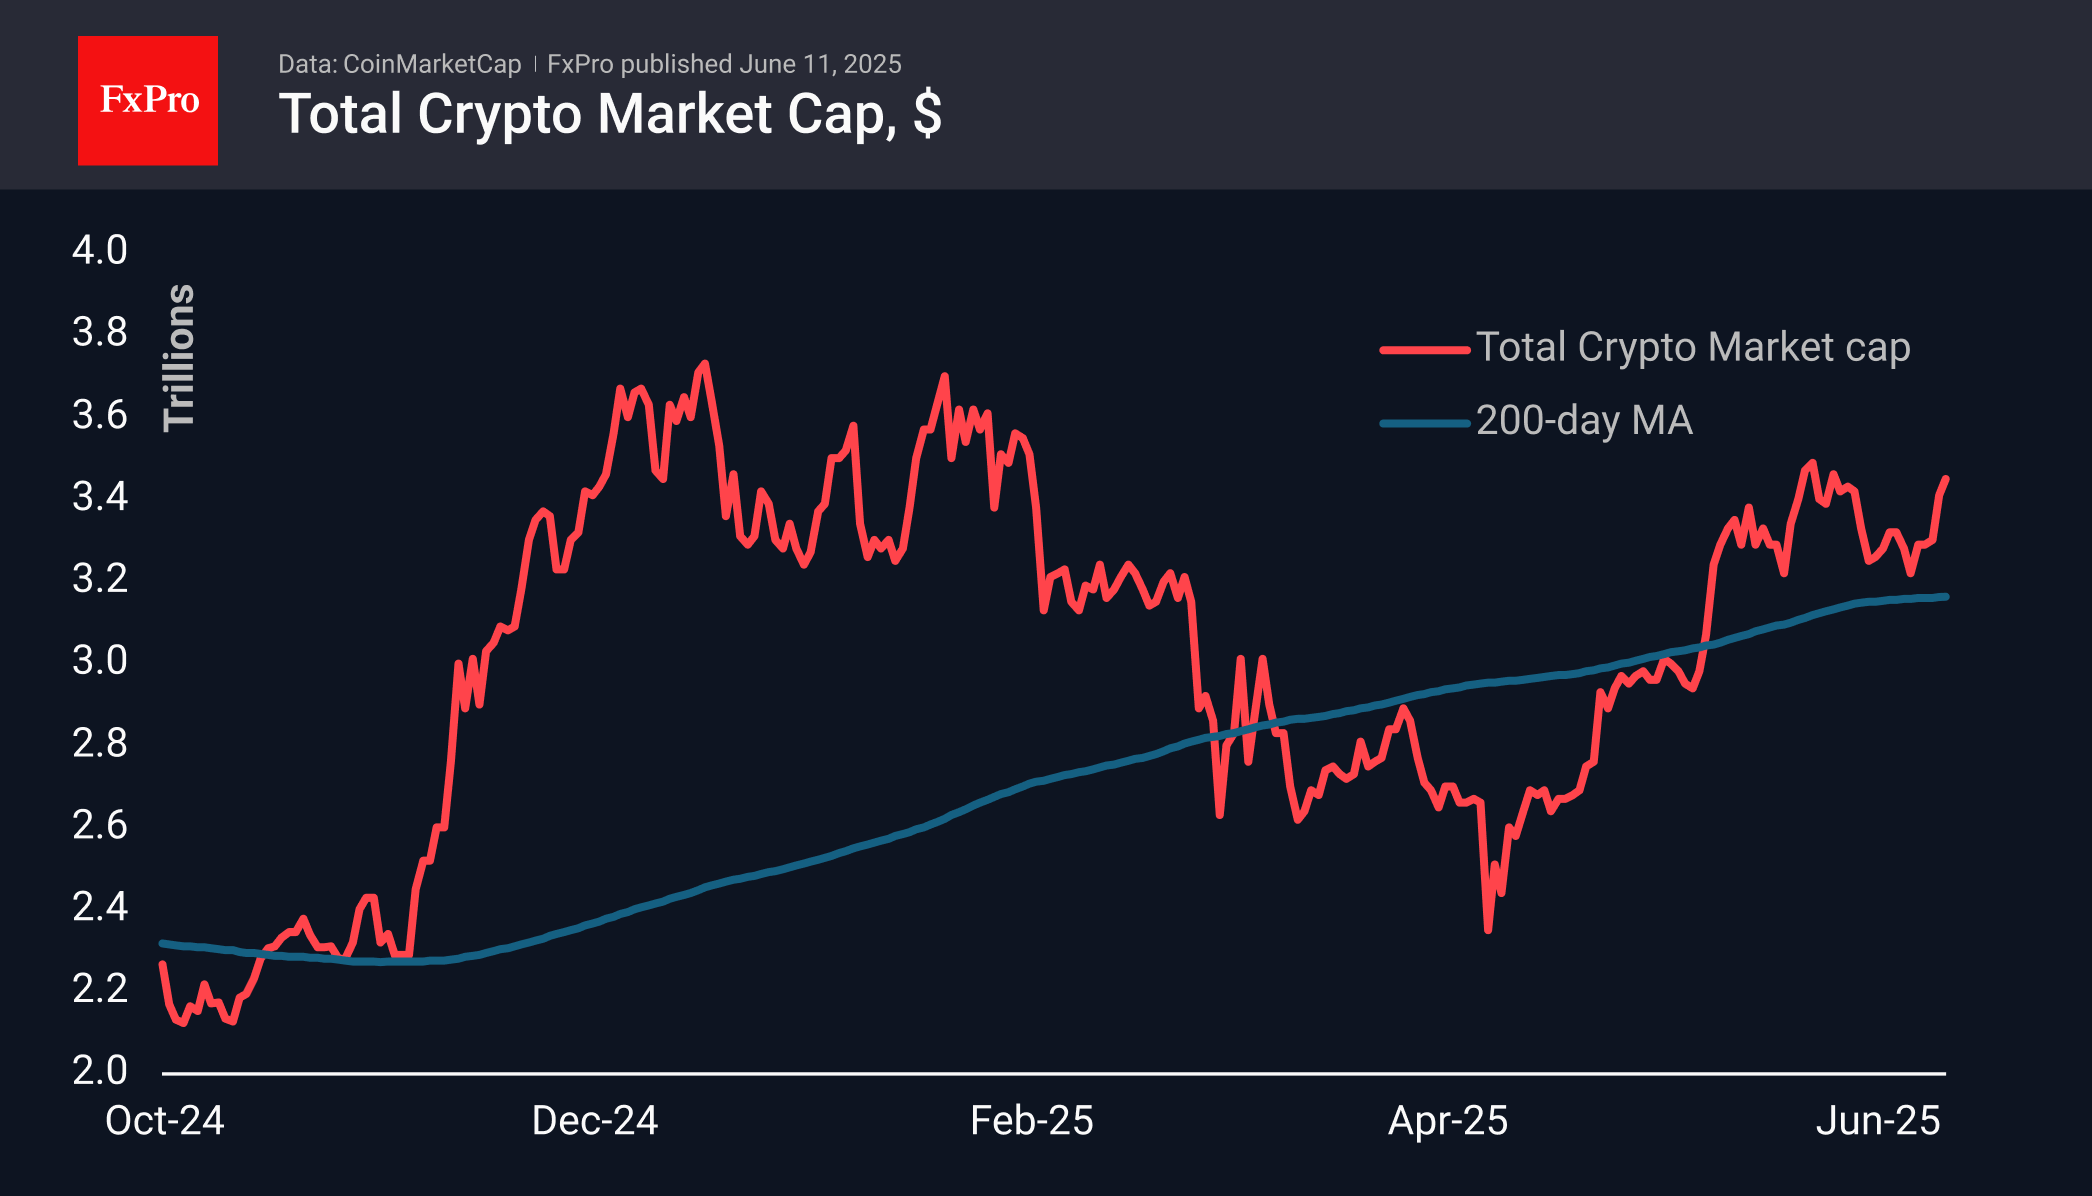
Market capitalisation grew by 0.6% in 24 hours, adding almost 4% in a week to $3.45 trillion. The market consolidated near these values a couple of weeks ago. Such a step-by-step climb is quite familiar. The likely continuation of positive sentiment allows us to consider the area of historical highs around $3.7 trillion as the next stop. The abundance of money from institutional and professional traders has dramatically suppressed FOMO impulses, so the type of market growth now looks more like a climb with frequent breaks than a rocket launch. Although less intense, this type of growth is more suitable for long-term portfolios.
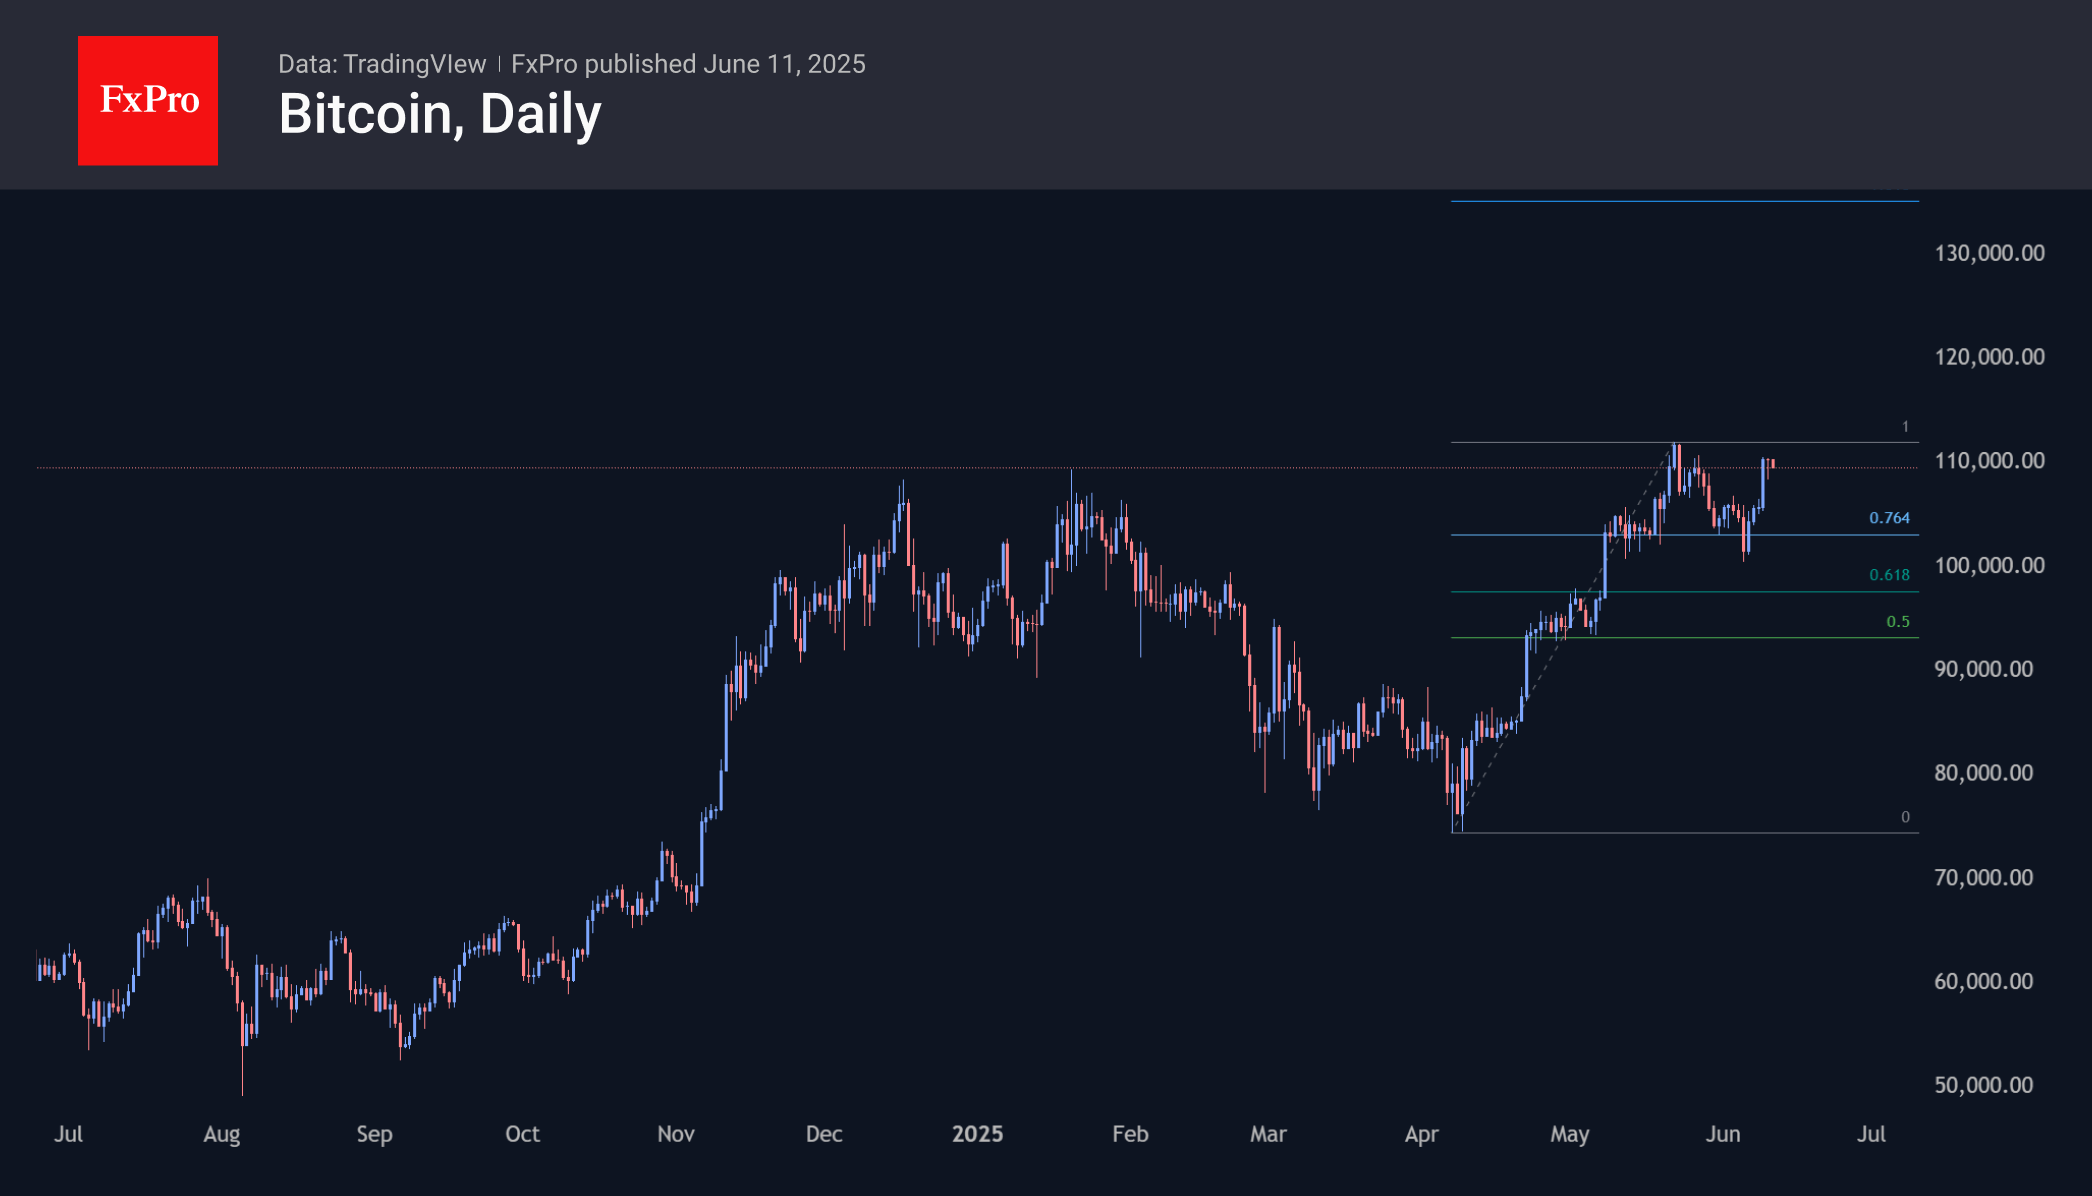
Bitcoin is trading above $109K, experiencing increased selling pressure on growth above $110K. This pressure may become even more intense as it approaches $112K, the area of the historical high set at the end of May. Breaking through this level will make $135K the technical target.
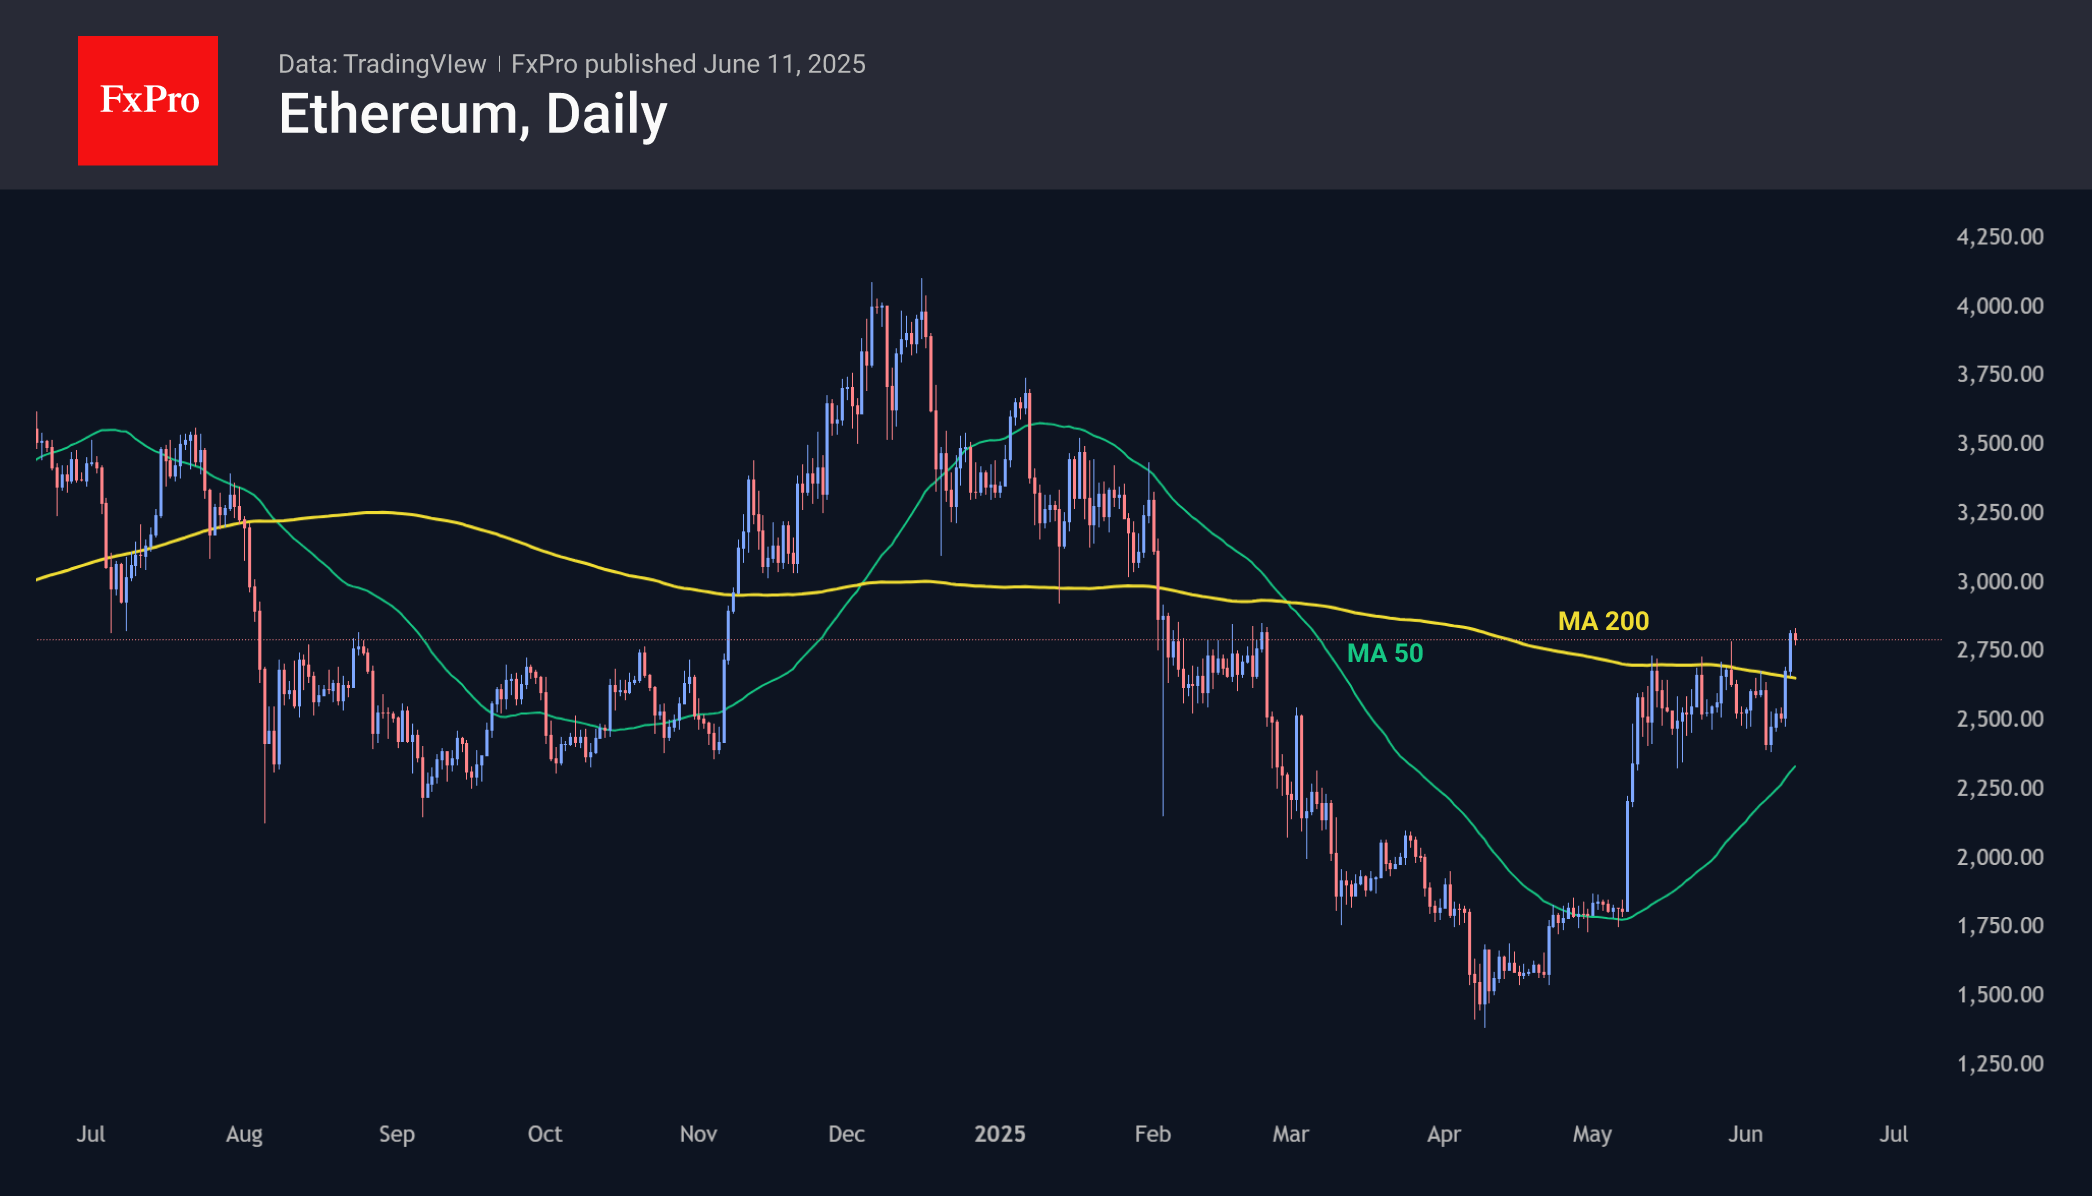
Ethereum has picked up momentum, adding nearly 5% in 24 hours to $2,800. It has recovered losses since the end of February and is consolidating above the 200-day moving average. If Ethereum’s dynamics are an indicator of altcoin sentiment, then we will see increased readiness for the altcoin season.
News Background
BlackRock’s largest Bitcoin ETF (IBIT) has become the fastest-growing exchange-traded fund in history. IBIT’s assets exceeded $70 billion in 341 trading days, while GLD took 1,691 days to do so.
Strategy additionally purchased 1,045 BTC ($110.2 million) last week at an average price of $105,426 per coin. The company now owns 582,000 BTC, purchased at an average price of $70,086. The total investment is estimated at $40.2 billion.
The Coinbase premium (the difference between prices on the largest American crypto exchange and other platforms) has reached a four-month high, indicating support from American buyers, according to CryptoQuant.
According to BaykusCharts, the supply of digital gold on exchanges has decreased by ~35%, from 1.55 million BTC to 1.01 million BTC, since July 2024.
US SEC Chairman Paul Atkins announced the agency’s new approach to non-custodial storage of cryptocurrencies. The agency is also working on measures to exempt De-Fi platforms from regulatory barriers.
USD/CAD Holds Near 2025 Low
When we last analysed the USD/CAD chart on 4 June, we identified a descending channel that remains relevant.
On 5 June, the pair reached a new low for 2025, and it is possible that bears will attempt to extend this move further over the course of the month.
Why is USD/CAD declining?
The Canadian dollar appears to be strengthening amid speculation that a trade agreement between the US and Canada could be finalised soon — possibly on 15 June, when the G7 summit is due to be held in Canada.
Media reports highlight several indicators supporting this view:
→ Prime Minister Mark Carney stated that Canada will meet its NATO spending target of 2% of GDP.
→ Canada refrained from retaliatory tariffs on steel and aluminium.
→ The US ambassador to Canada confirmed that “secret” negotiations are ongoing.
Technical Analysis of the USD/CAD Chart
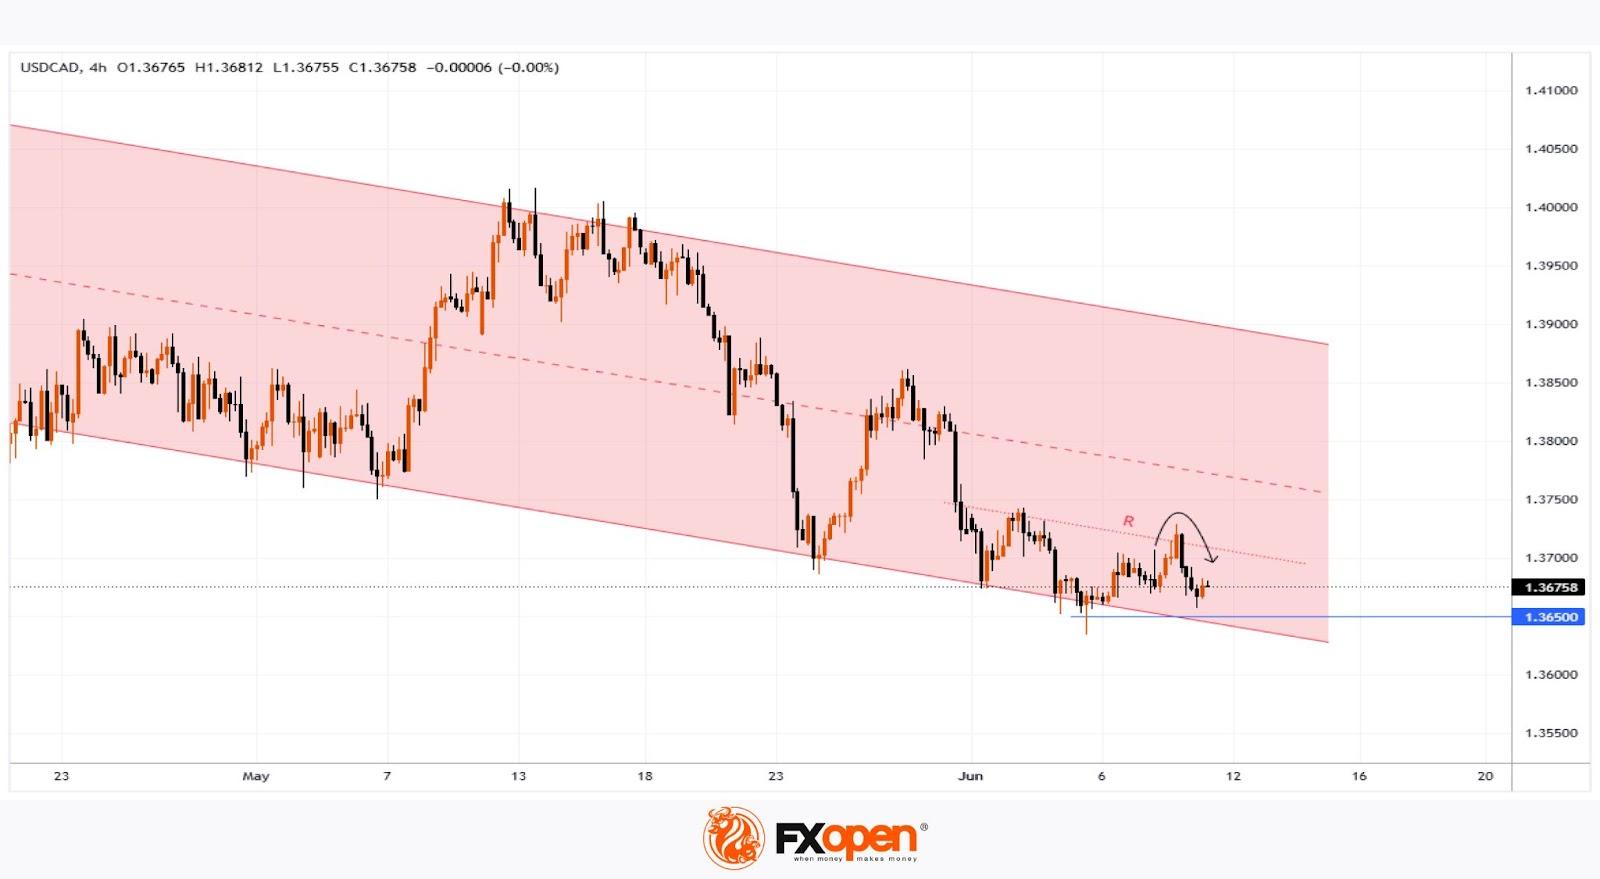
Note that the R-line, which divides the lower half of the descending channel into two equal parts, acted as resistance — price reversed downward from this line and accelerated lower (as indicated by the arrow). This reinforces the view that bears currently dominate the USD/CAD market.
For now, the 1.3650 level appears to be a support zone for bulls, but its strength may be tested today as markets react to US inflation data. The Consumer Price Index (CPI) report is scheduled for release today at 15:30 GMT+3. Be prepared for potential spikes in volatility.
Trade over 50 forex markets 24 hours a day with FXOpen. Take advantage of low commissions, deep liquidity, and spreads from 0.0 pips. Open your FXOpen account now or learn more about trading forex with FXOpen.
This article represents the opinion of the Companies operating under the FXOpen brand only. It is not to be construed as an offer, solicitation, or recommendation with respect to products and services provided by the Companies operating under the FXOpen brand, nor is it to be considered financial advice.
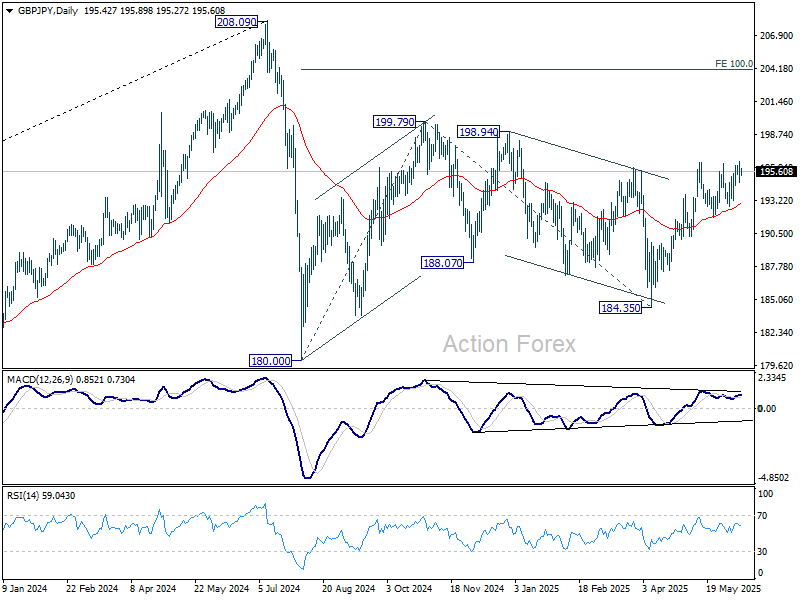
GBP/JPY Daily Outlook
Daily Pivots: (S1) 194.75; (P) 195.60; (R1) 196.43; More...
Intraday bias in GBP/JPY remains neutral first, and more consolidations could be seen. But further rise is in favor as long as 191.86 support holds. Firm break of 196.38 will resume whole rally from 184.35 to 199.79 resistance, and possibly further to 100% projection of 180.00 to 199.79 from 184.35 at 204.14.
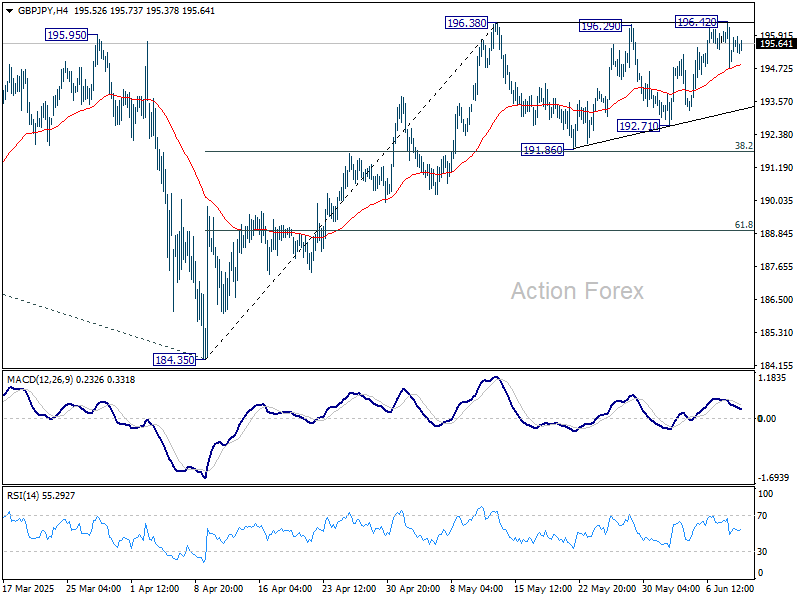
In the bigger picture, price actions from 208.09 are seen as a correction to rally from 123.94 (2020 low). Strong support should be seen from 38.2% retracement of 123.94 to 208.09 at 175.94 to contain downside. However, sustained break of 175.94 will bring deeper fall even still as a correction.