Sample Category Title
GBP/JPY Daily Outlook
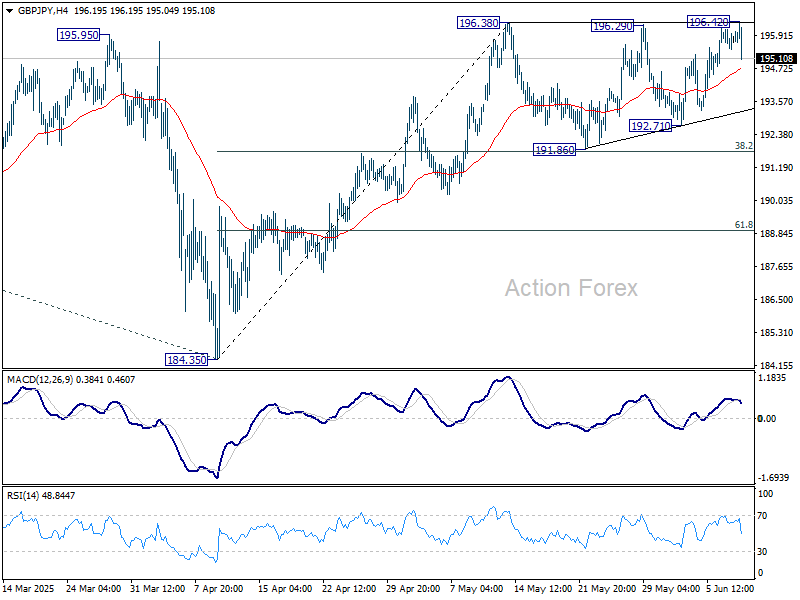
Daily Pivots: (S1) 195.56; (P) 195.86; (R1) 196.26; More...
GBP/JPY edged higher to 196.42 but reversed from there. Corrective pattern from 196.38 is extending with another falling leg and intraday bias remains neutral. Further rise is in favor as long as 191.86 support holds. Firm break of 196.38 will resume whole rally from 184.35 to 199.79 resistance, and possibly further to 100% projection of 180.00 to 199.79 from 184.35 at 204.14.
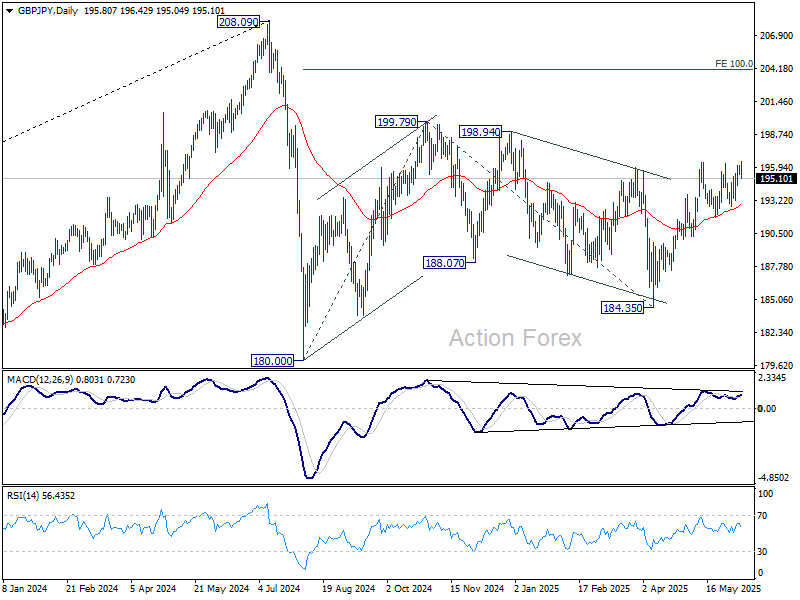
In the bigger picture, price actions from 208.09 are seen as a correction to rally from 123.94 (2020 low). Strong support should be seen from 38.2% retracement of 123.94 to 208.09 at 175.94 to contain downside. However, sustained break of 175.94 will bring deeper fall even still as a correction.
EUR/JPY Daily Outlook
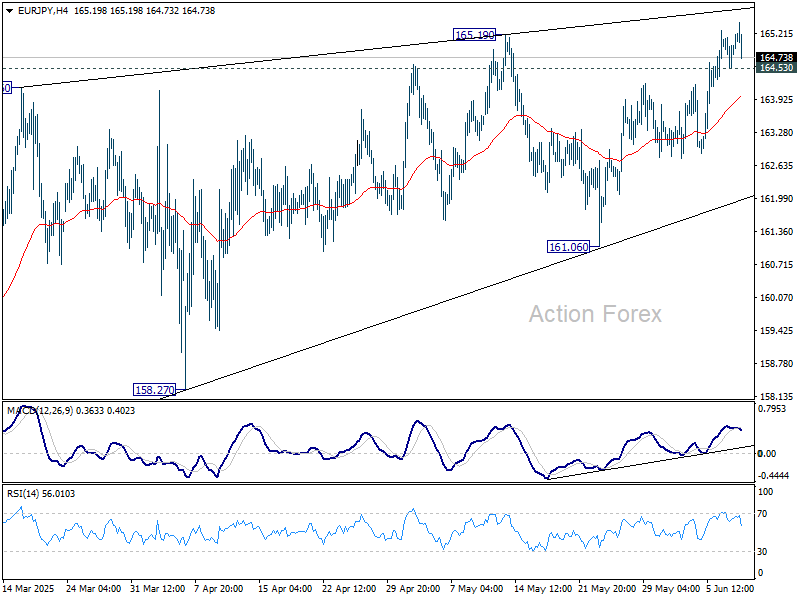
Daily Pivots: (S1) 164.73; (P) 164.97; (R1) 165.40; More...
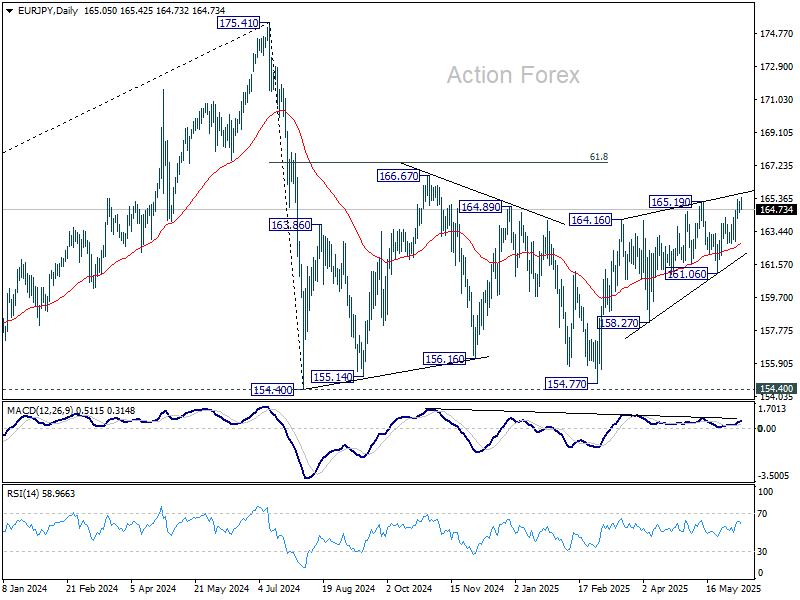
Intraday bias in EUR/JPY stays mildly on the upside. Current rise from 154.77 would target 166.67 resistance, and possibly further to 61.8% retracement of 175.41 to 154.77 at 167.38. On the downside, below 164.53 minor support will turn intraday bias neutral again first.
In the bigger picture, price actions from 175.41 are seen as correction to up trend from 114.42 (2020 low). Strong support should be seen from 38.2% retracement of 114.42 to 175.41 at 152.11 to contain downside. However, sustained break of 152.11 will bring deeper fall even still as a correction.
EUR/GBP Daily Outlook
Daily Pivots: (S1) 0.8419; (P) 0.8424; (R1) 0.8433; More...
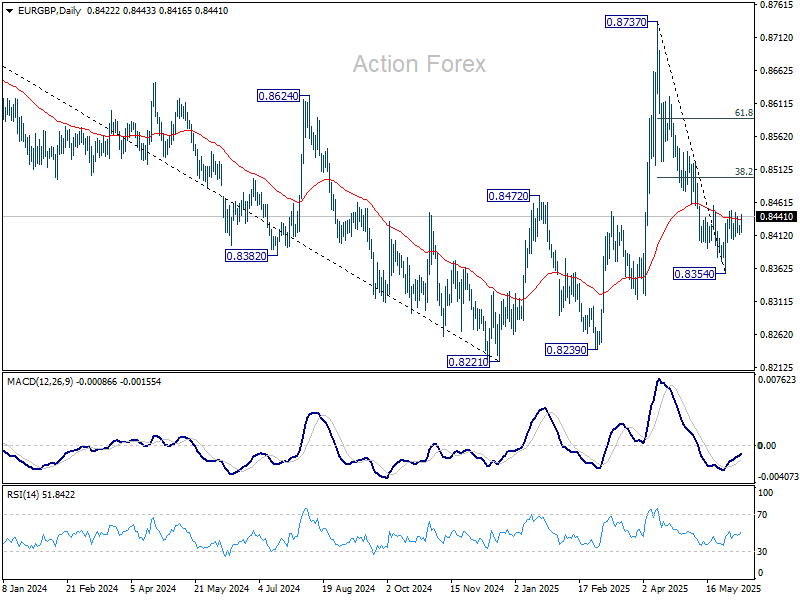
Intraday bias in EUR/GBP remains neutral and outlook is unchanged. On the upside, above 0.8448 will bring stronger rebound to 38.2% retracement of 0.8737 to 0.8354 at 0.8500. On the downside, below 0.8401 will bring retest of 0.8354 low.
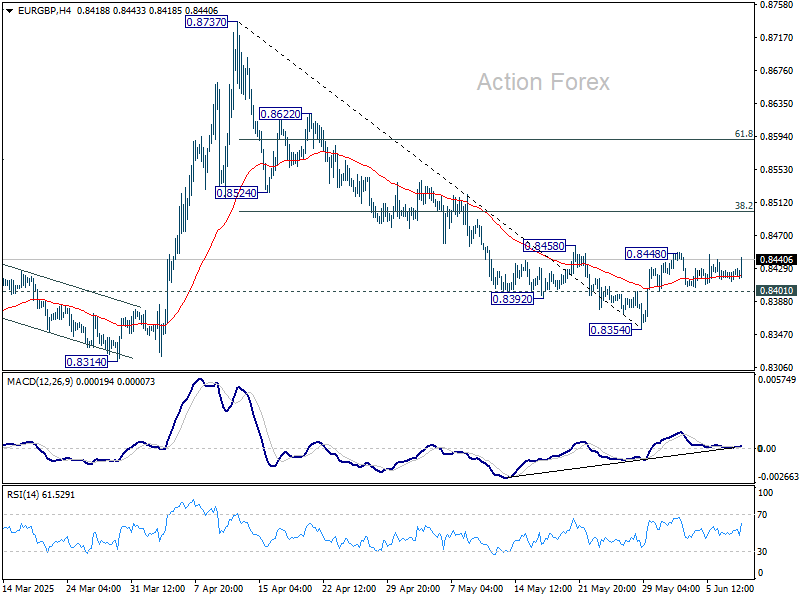
In the bigger picture, price actions from 0.8221 medium term bottom are merely forming a corrective pattern. Nevertheless, there is no clear momentum to break through 0.8201 key support (2022 low) yet. Hence, range trading is expected between 0.8221/8737 for now.
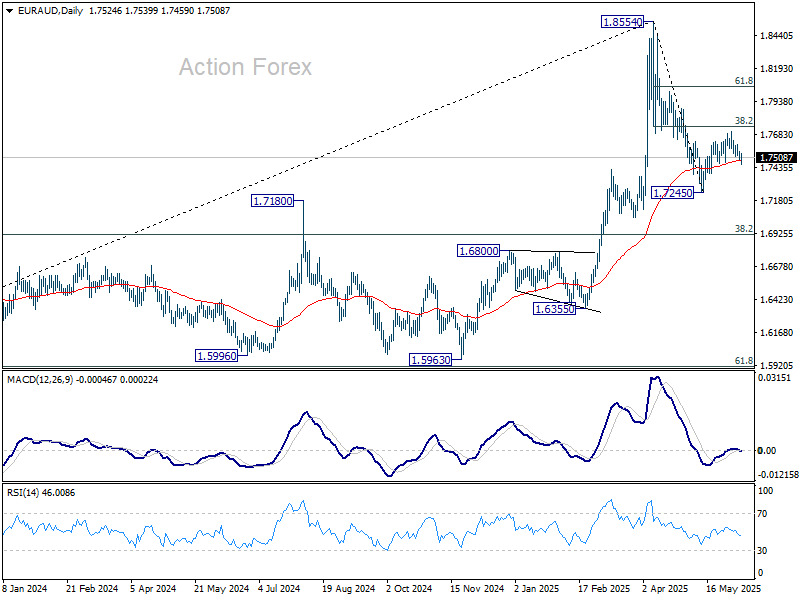
EUR/AUD Daily Outlook
Daily Pivots: (S1) 1.7491; (P) 1.7525; (R1) 1.7557; More...
Intraday bias in EUR/AUD remains neutral for the moment. On the downside, firm break of 1.7460 support will suggest that recovery from 1.7245 has already completed at 1.7705, 38.2% retracement of 1.8554 to 1.7245 at 1.7745. Intraday bias will be back on the downside for 1.7245 first. Firm break there will resume whole decline from 1.8554. On the upside, sustained break of 1.7745 will target 61.8% retracement at 1.8054.
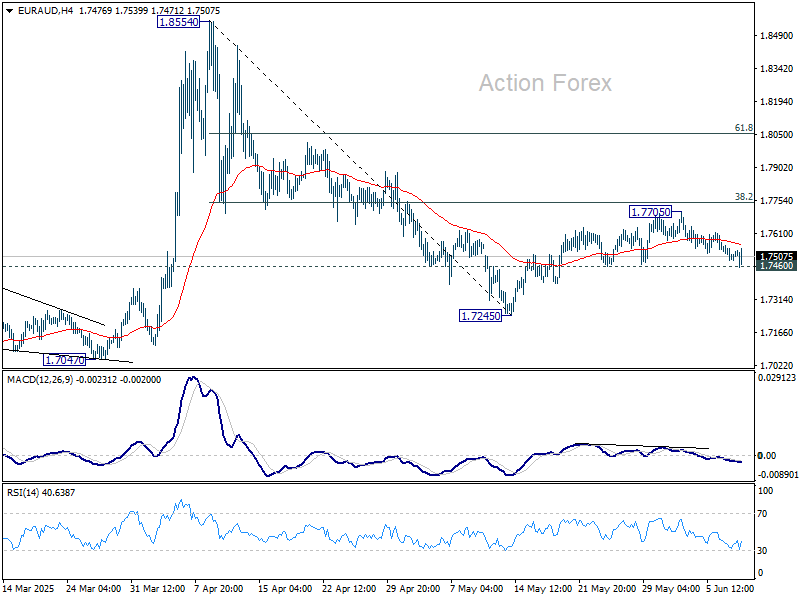
In the bigger picture, with 55 W MACD staying well below signal line, 1.8554 is likely a medium term top already. Price actions from there are seen as a corrective pattern only. While deeper pullback might be seen, downside should be contained by 38.2% retracement of 1.4281 (2022 low) to 1.8554 at 1.6922 to bring rebound. Up trend from 1.4281 is still expected to resume at a later stage.
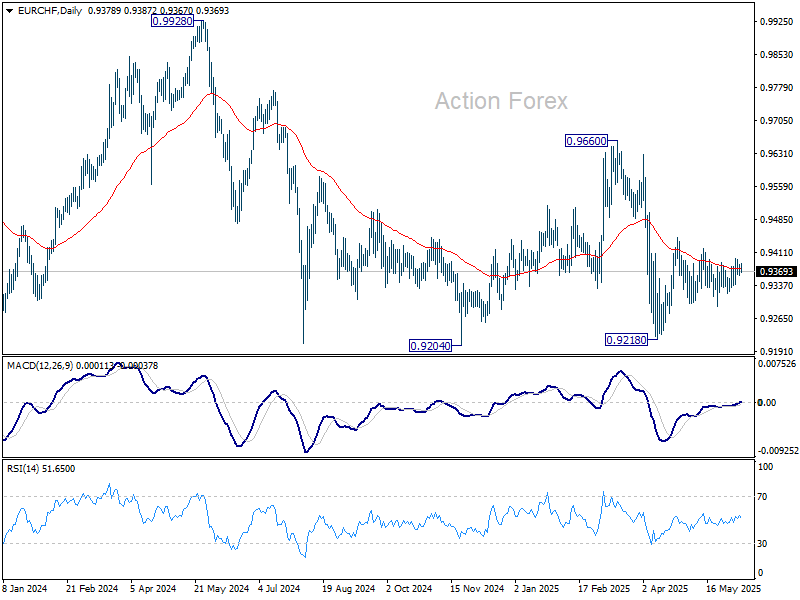
EUR/CHF Daily Outlook
Daily Pivots: (S1) 0.9352; (P) 0.9380; (R1) 0.9396; More....
No change in EUR/CHF's outlook as range trading continues. Intraday bias stays neutral for the moment. Price actions from 0.9445 are seen as a triangle consolidation pattern, and thus rise from 0.9218 is not finished. Break of 0.9419 will argue that the rise, either as a correction to fall from 0.9660, or the third leg of the pattern from 0.9204, is ready to resume through 0.9445. Nevertheless, on the downside, firm break of 0.9291 will bring retest of 0.9218 low.
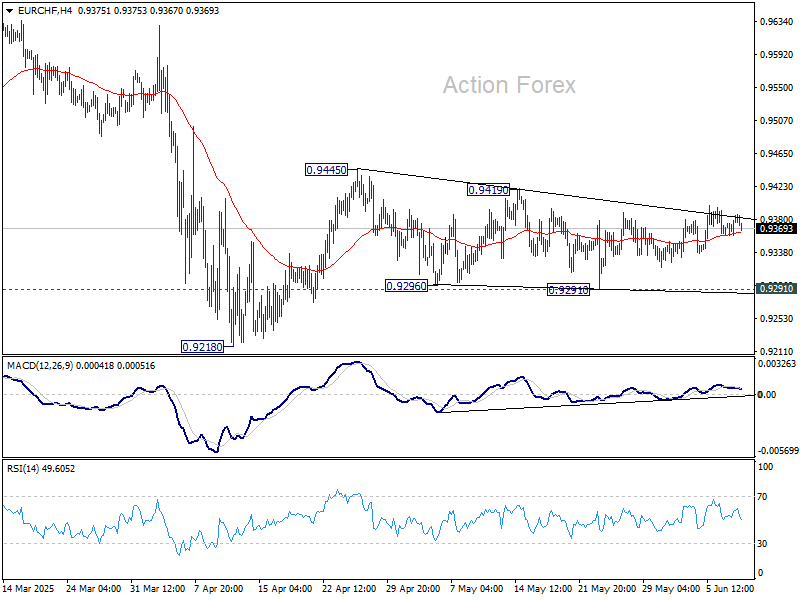
In the bigger picture, prior rejection by long-term falling channel resistance (now at 0.9527) retains medium term bearishness. That is, down trend from 1.2004 (2018 high) is still in progress. Firm break of 0.9204 (2024 low) will confirm resumption. This will remain the favored case as long as 0.9660 resistance holds.
Tonight’s $58bn 3-Year Auction Serves as a First Indication for Investor Appetite for US Bonds
Markets
US yields gave up a couple of basis points from Friday’s surge yesterday in choppy trading. The move end last week was inspired by the May payrolls report not delivering a feared-for downside surprise and news of imminent trade talks between the US and China. These discussions kicked off yesterday in London, will continue today and are centered around export curbs in tech (US) and rare earths (China). German Bunds underperformed slightly with net daily changes of no more than -2 bps at the front end of the curve. After last week’s 25 bps cut to 2%, ECB hawks are becoming a bit more vocal (Kazimir, Holzmann) but that doesn’t alter current market bets for one more late-2025 reduction to 1.75%. Trade optimism kept especially US stocks supported, with the likes of S&P 500 holding on to recent gains and trading an inch (+/- 2%) below the February record high. USD bulls stayed cautious with the greenback trading in the defensive at the start of the new week. EUR/USD rose slightly (above 1.14) to keep the short-term upward trading channel in tact. DXY holds near the recent lows in a tight sideways trading range around the 99 lever. Sterling is still going nowhere. EUR/GBP for all of June so far hovered slightly above 0.84.
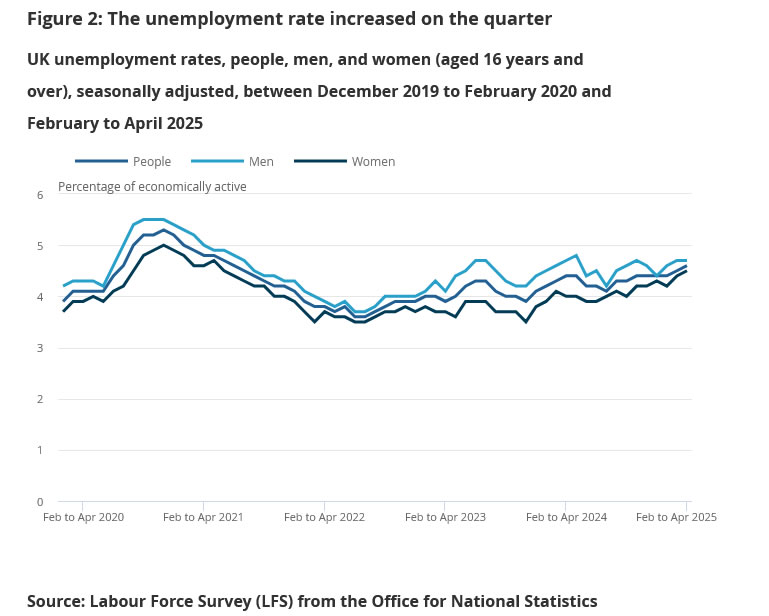
Japan’s yen this morning briefly fell to above USD/JPY 145. Bank of Japan governor Ueda doused any market expectations for a rate hike short-term as inflation is still some distance from its inflation goal (ie achieving 2% sustainably). Asian trading otherwise is mostly inspired by the “fruitful” US-Sino trade talks. That’s pushing most stock indices into the green as well as supporting the US dollar. The overall tone for now indeed is a constructive one but predicting the outcome is impossible, including for markets. Other things to watch today while the trade topic is running in the background is tonight’s $58bn 3-year auction. This serves as a first indication for investor appetite for US bonds ahead of the more important 10-yr and especially 30-yr auctions tomorrow and Thursday. Some major market players last week declared a buyers strike for the latter. Weak sales are likely to prompt Treasury and dollar losses. The greenback avoided a test of the April EUR/USD high (1.1573) but the risk is not at all gone. Its growing more fundamental and institutional vulnerabilities are being laid bare by US administration’s decision to send marines to LA after having federalized National Guard troops to address civil unrest. That started on Friday when federal agents arrested several immigrants during a targeted operation. GBP erases early gains after this morning’s April labour market report. Wage growth was strong but slightly below expectations while the unemployment rate rose to 4.6%. The bigger-than-expected employment growth (89k vs 40k) in the three months through April was offset by a poor (but only indicative) reading for the month May (-109k).
News & Views
According to the May Survey of Consumer expectations of the Federal Reserve ban of New York, households’ inflation expectations declined at all three horizons. At the same time, consumers’ recent pessimism about the labour market eased somewhat, while consumer debt delinquency expectations and expectations about one’s household financial situation improved slightly. One-year-ahead inflation expectations declined by 0.4 ppt to 3.2%, three-year-ahead expectations declined by 0.2 ppt to 3.0%, and five-year-ahead expectations declined by 0.1 ppt to 2.6%. The survey’s measure of disagreement across respondents (decreased at all three horizons. Median home price growth expectations decreased by 0.3 ppt to 3.0%. This series has been moving in a narrow range between 3.0% and 3.3% since August 2023. Expectations on the labour market also improve slightly. 1-y ahead earnings growth was seen at 2.6% (+0.2%), but remains below the 12 average. Unemployment expectations also declined. The mean probability of losing one’s job in the next 12 months decreased 0.5 ppt to 14.8% and the probability of leaving one’s Job voluntarily increased marginally.
The Finance Minister of Sweden, Elisabeth Svantesson, yesterday said that new military spending in the country for a couple of years (potentially four or five years) will be financed by debt. in this respect, the Fin Min said that the country will use the strength of the economy including a public debt of only just over 30% of GDP to step up defense spending. The government has the indication spend SEK 300 bln for the military over the next decade and wants to reach military spending of 3.5% of GDP in 20230. According to the Fin Min, the country will need to look for permanent financing to cover the need for military spending in the long run.
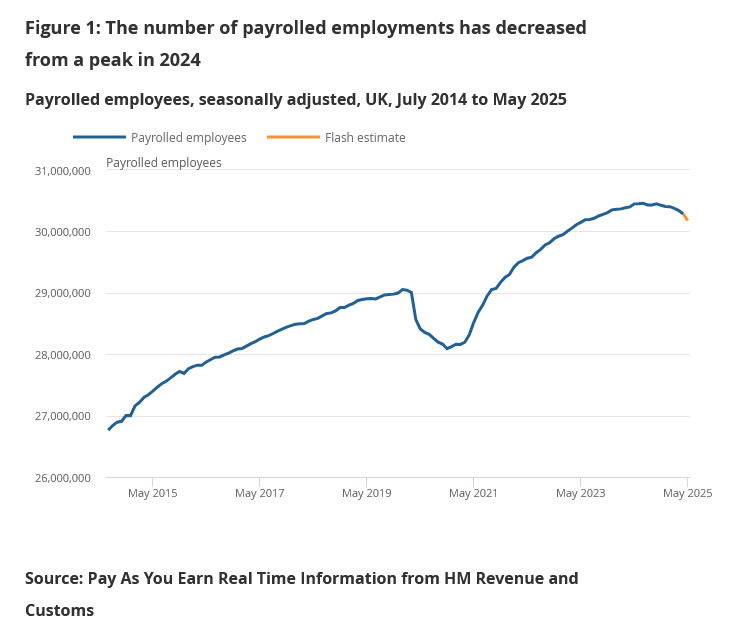
UK labor market softens as unemployment rises to 4.6% and wage growth slows
UK labor market data released today point to gradual cooling. In May, payrolled employment dropped by -109k, or -0.4% mom. Claimant count rose sharply by 33.1k, well above the expected 4.5k increase. Wage pressures are also easing, with median monthly pay rising by 5.8% yoy, down from 6.2% previously, though still within a relatively tight band seen this year.
For the three months to April, unemployment rate ticked up to 4.6% as expected, while both average earnings measures came in softer than forecast. Regular pay (excluding bonuses) rose 5.2% yoy, and total pay increased 5.3% yoy, both under the 5.5% consensus.
Trade Optimism Reins
The week started on a quiet note in the US and with some weakness in Europe, where many were off due to a religious holiday. But futures are in positive territory this morning as traders return to their desks.
One of the main drivers of optimism is the renewed momentum in US/China trade talks. The first day of the second round of negotiations reportedly went relatively well. There hasn’t been a breakthrough yet, and the talks in London continue today. Still, rumours are circulating that the US may be willing to make concessions on tech exports in exchange for China easing restrictions on rare earth metal exports. VanEck’s Rare Earth and Strategic Metals ETF rose another 2.8% on Monday. Meanwhile, Hong Kong’s Hang Seng Index looks poised to retest its March peak, with potential to extend gains if trade news is supportive. The index still trades at a 22% discount to its 2021 peak and 27% below its 2018 high, leaving ample room for upside.
In energy markets, trade optimism is helping US crude break through a key Fibonacci support level. The barrel is edging above the $65.35 mark, representing the 38.2% retracement of this year’s rally. A sustained move above this level could signal the start of a medium-term bullish consolidation, with potential to push toward $68. However, higher supply could eventually cap gains near the $68–$70 range.
By contrast, traditional safe havens such as gold and the Swiss franc are softer, while the US dollar is better bid in Asia. The EURUSD has dipped below the 1.14 mark, the USDJPY briefly traded above 145, while the trade- and China-sensitive Aussie dollar is holding above 65 cents. Progress in trade talks should support further risk-on sentiment. Any disappointment, however, could jolt markets.
The economic calendar is light in the US today, ahead of Wednesday’s crucial CPI release. As a result, markets will remain focused on trade developments. Importantly, positive trade headlines could help offset any negative surprises in tomorrow’s inflation print, which is expected to reflect mounting price pressures in the US—partly due to higher tariff-related costs. The US 2-year yield is consolidating near 4%, while the 30-year yield is softer ahead of Thursday’s key auction. Whether the nearly 5% yield on 30-year paper attracts sufficient demand remains to be seen, particularly as many investors have shifted toward shorter maturities amid budget uncertainties. A weak auction could drive long-term borrowing costs higher and refocus attention on ballooning US debt. That, in turn, could renew demand for alternatives—even in a risk-on environment.
Gold is one such alternative, but investor interest in precious metals is now extending beyond gold. Silver and platinum have both seen impressive rallies. Platinum is up around 15% so far this month, and more than 30% since April. Gold’s strength is certainly a tailwind for sister metals like silver and platinum—platinum ETFs saw a 300% year-over-year surge in investment demand in Q1. But the story goes deeper. The platinum market remains tight, and a second consecutive annual deficit is expected. The World Platinum Investment Council forecasts a shortfall of nearly 1 million ounces this year. As a result, borrowing costs for the metal have surged above 13%—compared to a typical near-zero rate. Meanwhile, demand continues to rise, particularly from hybrid car manufacturers who use platinum in catalytic converters. Jewellery demand is also increasing, as jewellers pivot away from expensive gold. At current levels, platinum still trades nearly 50% below its 2008 peak and may appeal to investors looking to diversify away from high-priced gold.
In equities, Apple unveiled its new “Liquid Glass” interface at its Worldwide Developers Conference, focusing on design rather than AI or core technology—another sign the company may be falling behind in the AI race. So far, Apple has been given breathing room, partly due to its brand power. But a continued lack of innovation on the tech front could cost the company its leadership status, encouraging investors to rotate elsewhere. Apple shares have notably diverged from the rest of the so-called Magnificent Seven. Tech history is littered with fallen giants—Kodak and Nokia come to mind. Apple isn’t there yet, but it needs to act to stay in the top tier.
Elsewhere in tech, TSMC released its May sales figures this morning, reporting a strong 39.6% year-on-year gain. The stock rose in Taiwan on the news and may help lift Nvidia at the US open—especially amid hopes the US might relax certain chip export rules to China. Nvidia has had to halt shipments of China-specific chips due to those restrictions, so any progress on that front can’t come soon enough.
US-China Trade Talks Resume Today
In focus today
In the euro area, we follow the Sentix investor confidence indicator, which is the first confidence indicator collected in June. The indicator rebounded sharply in May following the post-liberation day plunge in April and we think there is further room for a small increase in June.
In Sweden, a collection of data is released. The highlight of the day is the Riksbank's business survey at 9:30 CET, which is crucial for future monetary policy decisions. Early insights suggest a dovish tone, and its results will significantly influence the Riksbank's policy meeting next week. Other key data releases include household consumption and the Production Value Index for April, along with the monthly GDP indicator, all at 08.00 CET. Despite typically being unreliable, a strong GDP indicator, combined with last week's robust retail sales, could suggest a Q2 growth rebound.
Norwegian inflation figures for May are released today, with an expected decline in core inflation to 2.9%. Food prices are likely to rise, but air fares may drop due to post-Easter effects. The risk is tilted slightly to the upside, as prices on imported goods ex. food dropped in May last year and could give a positive base effect. If accurate, inflation will fall below Norges Bank's March estimate of 3.1%.
US-China trade talks resume today at 11:00 CET, focusing on tech restrictions and export limits.
Economic and market news
What happened overnight
US-China trade talks will resume today after kicking off yesterday. Talks came into place after a call between Xi and Trump on Thursday last week and followed a period where both sides accused the other of violating the deal reached in Geneva on 10-11 May. The crux of the talks in London are new US tech restrictions on China and China's limits to exports of rare earth minerals to the US in response. Trump said to reporters overnight "We are doing well with China. China is not easy". The US side has expressed willingness to ease some tech restrictions but not on some of the recent controls on the advanced H20 Nvidia AI chips. China also wants the US side to withdraw new limiting guidelines on Huawei AI chips that was released shortly after the Geneva talks. Trade talks are set to resume today at 11:00 CET.
What happened over the weekend and yesterday
In China, data were released for both inflation and trade yesterday. CPI inflation was slightly better than expected, remaining unchanged at -0.1% y/y (cons: -0.2%) and the core CPI measure (excluding energy and food) increased to 0.6% y/y (prior: 0.5% y/y). Producer price inflation, however, dropped to -3.3% y/y (prior: -2.7% y/y). The numbers underline that deflationary pressures in China continue, although the rise in core inflation is slightly positive. On the trade side, Chinese export data for May were weaker than expected dropping 4.8% y/y (cons: 6.0%, prior: 8.1%). A big decline in exports to the US pulled lower but likely reflected a stand-still in the first two weeks of the month when US tariffs were around 150%. We look for a rebound in the June exports as US-China trade has picked up after the trade war truce set in on 12 May.
In the US, the nonfarm payrolls released on Friday for May increased by +139k (cons: +130k, prior: +147k). The unemployment rate remained steady at 4.2%, and average hourly earnings growth rose by 0.4% m/m SA, slightly exceeding expectations. However, labour supply shrunk by 625k, largely due to a reduction in foreign-born workers. These figures illustrate positive employment growth alongside a declining labour supply, suggesting a tighter labour market, which can be perceived as hawkish.
In the euro area, the final estimates for the national accounts in Q1 2025 revealed revised GDP growth of 0.6% q/q (prior: 0.4%). This growth was mainly attributed to a significant rise in gross fixed capital formation (+1.8%) and exports (+1.9%). Household consumption made a modest positive contribution, while government spending had little impact. The positive balance between exports and imports added +0.3 percentage points to the overall growth.
In Norway, data on Friday showed manufacturing experienced a notable increase in April, with production rising by 2.8% m/m, leading to 2.4% growth over the past three months. This recovery was largely driven by a 3.8% m/m surge in oil-related industries, while mainland industries also showed upward movement. Despite market volatility, the manufacturing sector remains resilient, showing no signs of impact from a global trade war or a decline in oil investments.
Equities: Equities have traded with a positive tone over the past two sessions — Friday and Monday. The key catalyst was Friday's US jobs report, which investors interpreted as a sign of underlying economic resilience. It was not just the level of gains in equities that mattered, but the nature of the move: cyclicals outperformed, defensives underperformed, and implied volatility (VIX) dropped notably. In other words, a classic pro-cyclical pattern. Notably, the move came alongside a sharp rise in both short- and long-end US Treasury yields on Friday, a combination that clearly signals increasing confidence in the US economy's ability to navigate geopolitical uncertainty - particularly the evolving US-China trade tensions. In the US yesterday, Dow 0.0%, S&P 500 +0.1%, Nasdaq +0.3%, Russell 2000 +0.6%. This morning, Asian equities are trading higher, and futures in both Europe and the US point to a continuation of that upbeat tone.
FI and FX: US-China trade talks will resume today after kicking off yesterday. The seemingly positive tone has supported Asian equities alongside European and US futures. The USD firmed with EUR/USD back at the 1.14 level. USD/CNY has been fairly calm while gold dropped. US yields and the 10y2y curve are basically flat with US10y at 4.48 ahead of this week's 3y/10y/30y auctions. Today's Swedish data and Riksbank's company survey may have a marginal impact on Riksbank pricing and, by extension, EUR/SEK which has moved toward the upper end of the 10.80-11.00 range. EUR/NOK is back below the 10.50 level while NOK being supported by risk on and higher energy prices.
EUR/USD Daily Outlook
Daily Pivots: (S1) 1.1392; (P) 1.1415; (R1) 1.1444; More...
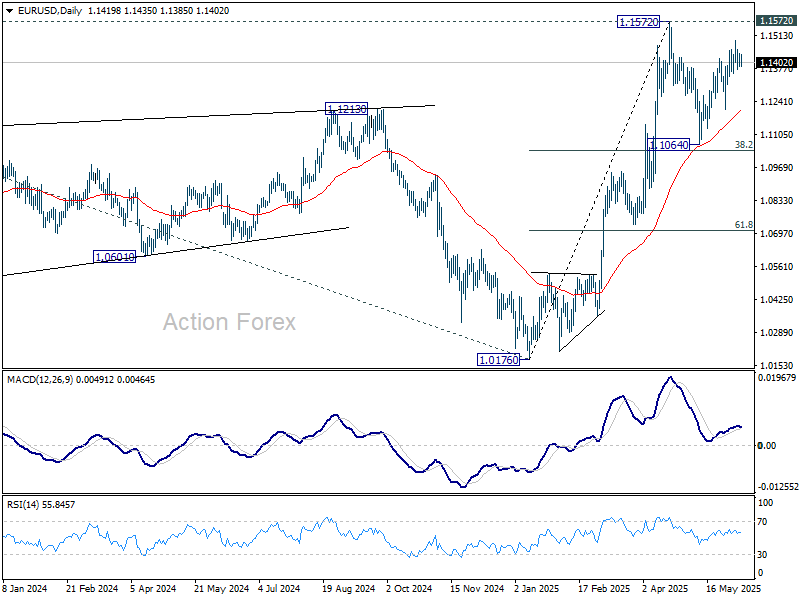
Range trading continues in EUR/USD and intraday bias stays neutral. Price actions from 1.1572 are seen as a corrective pattern to rally from 1.0716. While rebound from 1.1064 might extend, strong resistance should emerge from 1.1572 to limit upside. On the downside, break of 1.1356 support will argue that the correction is already in the third leg, and target 1.1209 support for confirmation.
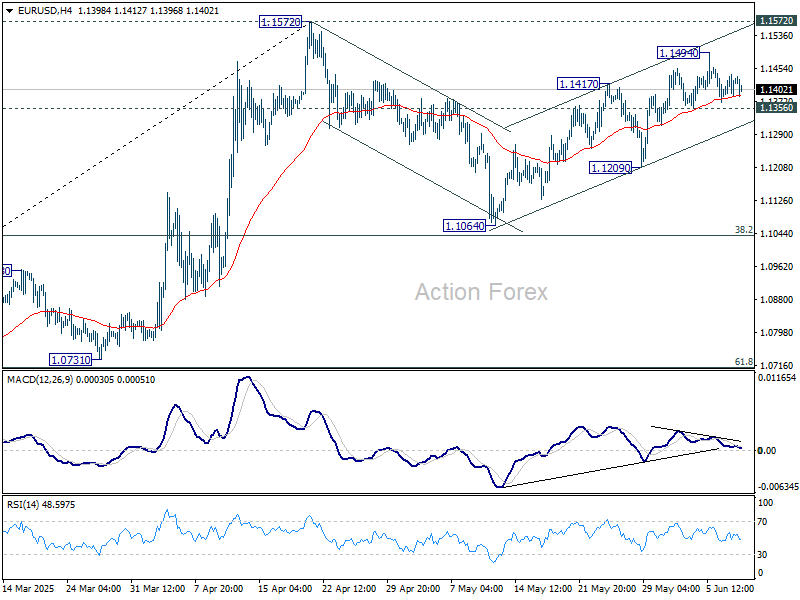
In the bigger picture, rise from 0.9534 long term bottom could be correcting the multi-decade downtrend or the start of a long term up trend. In either case, further rise should be seen to 100% projection of 0.9534 to 1.1274 from 1.0176 at 1.1916. This will now remain the favored case as long as 55 W EMA (now at 1.0894) holds.